Overpressure Modelling
Overpressure modelling predicts the peak sound pressure caused by a shock wave over and above normal atmospheric pressure measured in decibels (dB). It is calculated in a similar way to vibration with the following differences:
- The independent site variable and site exponent are defined in site settings.
- The calculation incorporates wind velocity (only very significant winds will affect the result).
- Overpressure modelling has a lower propagation rate (as sound travels faster in rock than in air).
- The formula uses the cube root of charge mass rather than the square root.
To open the Overpressure Modelling panel, load a tie-up into a view and go to Analysis > Modelling > ![]() Overpressure Modelling.
Overpressure Modelling.
Model inputs
Just as in vibration modelling, you can filter and calculate the results for overpressure modelling by the following options:
-
Using overpressure observations allows you to filter overpressure observations according to the following criteria:
-
Filter by monitoring station: You can select multiple stations from the drop-down menu and only observations from those stations will be displayed.
-
Filter by detonation location: This will display all observations with detonation coordinates within the specified filter radius of the provided location.
-
Filter by tag: When you enter text in the Tag field, the list will be filtered to only include observations that have a tag containing the entered text.
-
Filter by date: This will display only the observations which were recorded between the first and the last date you provide.

-
-
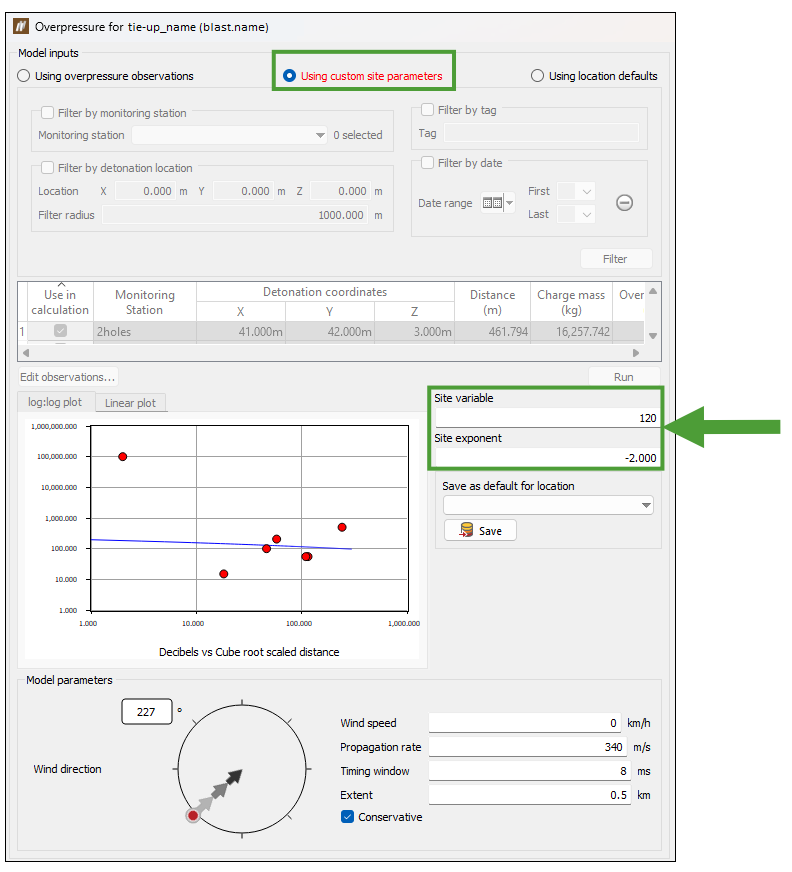
Using custom site parameters allows you to live-edit the overpressure observations by modifying the Site variable and Site exponent that become editable when this option is used. The values can be saved as the default values for a selected location.
-
Using location defaults automatically changes the Overpressure at locations table in Model results to display the Site variable and Site exponent using the values from their appropriate location. Overpressure values will not be calculated at a location which does not have a default variable and exponent.

Overpressure is dependent on a number of variables, including explosive mass, explosive timing, and wind speed and its direction. BlastLogic enables you to enter the following inputs:
-
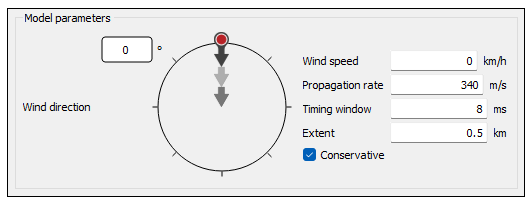
Wind speed. The speed of wind is included in calculations, but only strong winds can affect the result.
-
Propagation rate. The speed of sound through the current atmospheric conditions. This is generally taken to be 340 m/s, but it can vary significantly due to temperature and altitude.
-
Timing window. The time frame, usually set at 8 ms, within which the maximum instantaneous charge (MIC) is calculated.
-
Extent. The distance to evaluate from the blast. Larger extents will require longer calculation times.
-
Wind direction. The predicted travel direction of the wind at the moment of firing. You can specify the angle of wind direction by dragging the three arrows (that together resemble a hand of a clock) around the circle.
Calculation of overpressure
Follow these steps to calculate the overpressure at a particular location:
-
Collect and order each detonation event or time.
-
Calculate the total explosive mass and minimum distance to the point of interest at each detonation event. Adjust the distance values according to wind speed and speed of the sound wave.
-
Calculate the overpressure in kPa for each total explosive mass and minimum distance to the point of interest using the following equation (referenced in the Australian Standards (AS) 2187.2, 2006):
 ,
,
where is the site variable,
  is the minimum distance to the point of interest,
  is the charge mass, and
  is the site exponent.
Note: You can set the site variable and site exponent constants in Locations (Home ribbon > Setup group >
 Site).
 -
Convert the value into decibels using the following equation:
 , where the base pressure is equal to 0.00002 Pa (or 20µ Pa).
Conservative checkbox
Similarly to the Vibration Modelling panel (see Vibration Modelling for more information), you can choose to apply a conservative or non-conservative approach in your calculations. The conservative approach takes into account the closest distance from the point of detonation to the point of observation, which helps to model the worst case scenario. On the other hand, the non-conservative approach calculates the weighted average using the mass of explosives, which is a more technically sound method for modelling the resulting overpressure level.
Consequently, the conservative approach can be regarded as ,
,
whereas the non-conservative approach, where multiple detonations are taken into consideration, can be calculated for all contributing detonations according to the formula ,
,
where  is the distance to each detonation, and
  is the associated charge mass.
Based on these calculations, the resultant modelled overpressure is calculated according to the formula ,
,
where  is the site variable,
  is the effective distance,
  is the total charge mass, and
  is the site exponent.
Background model information
In the basic case scenario, with one hole fired and no wind interference, the maximum instantaneous charge (MIC) is calculated from the explosive mass in the hole, and the value of overpressure for each point on the grid is calculated using the cube-root-scaled distance formula.
When there are multiple holes, each hole is assigned an initiation time, which is equivalent to the initiation time of the first primer in the hole.
For each point in the grid, the propagation rate and initiation time per hole are then used to determine which holes are interacting with each other. It is done by taking into consideration the time for the overpressure wave to reach the point (that is, distance / propagation rate) and an assumed 8 ms window.
The charge mass is thus calculated to be the sum of all the charge masses of all the holes whose overpressure waves reach the same grid point within the 8 ms window. The MIC is calculated as the maximum of these charge mass sums. This is then used in the cube-root-scaled distance formula to calculate the overpressure value at a given point.
Wind will affect the time taken for the overpressure wave to reach any given point. The wind speed is directly added as a velocity component to the wave emanating from a hole.
Important! As the initiation time of a hole is required to work out the interaction of the overpressure waves originating from different holes, any hole that is not a part of a tie-up will be ignored by the modelling tools. Also holes that have no charge plan will have no effect on the model as they have no charge mass.
Model results
This section provides a visual tool to model the overpressure effects of a blast.
Custom colour schemes
Custom colour schemes created in the Custom Colour Schemes panel (Home ribbon > Setup group > ![]() Site) can be loaded into the Overpressure Modelling panel by clicking the Load colour scheme... button. The colours and intervals can be further edited in the Overpressure Modelling panel. Once the created scheme meets your expectations, you can copy it by right-clicking and pasting into the Custom Colour Schemes panel, where it will be saved for future use.
Site) can be loaded into the Overpressure Modelling panel by clicking the Load colour scheme... button. The colours and intervals can be further edited in the Overpressure Modelling panel. Once the created scheme meets your expectations, you can copy it by right-clicking and pasting into the Custom Colour Schemes panel, where it will be saved for future use.
Estimating Overpressure
The colour map will allow you to quickly evaluate the range of overpressure values from the blast within the specified extent.
Note: To save the plot, press the Save button. This will create two new objects in the cad folder: a grid of the plot and a contour map showing intervals in 5 dB increments.
Estimating overpressure at a point (x,y)
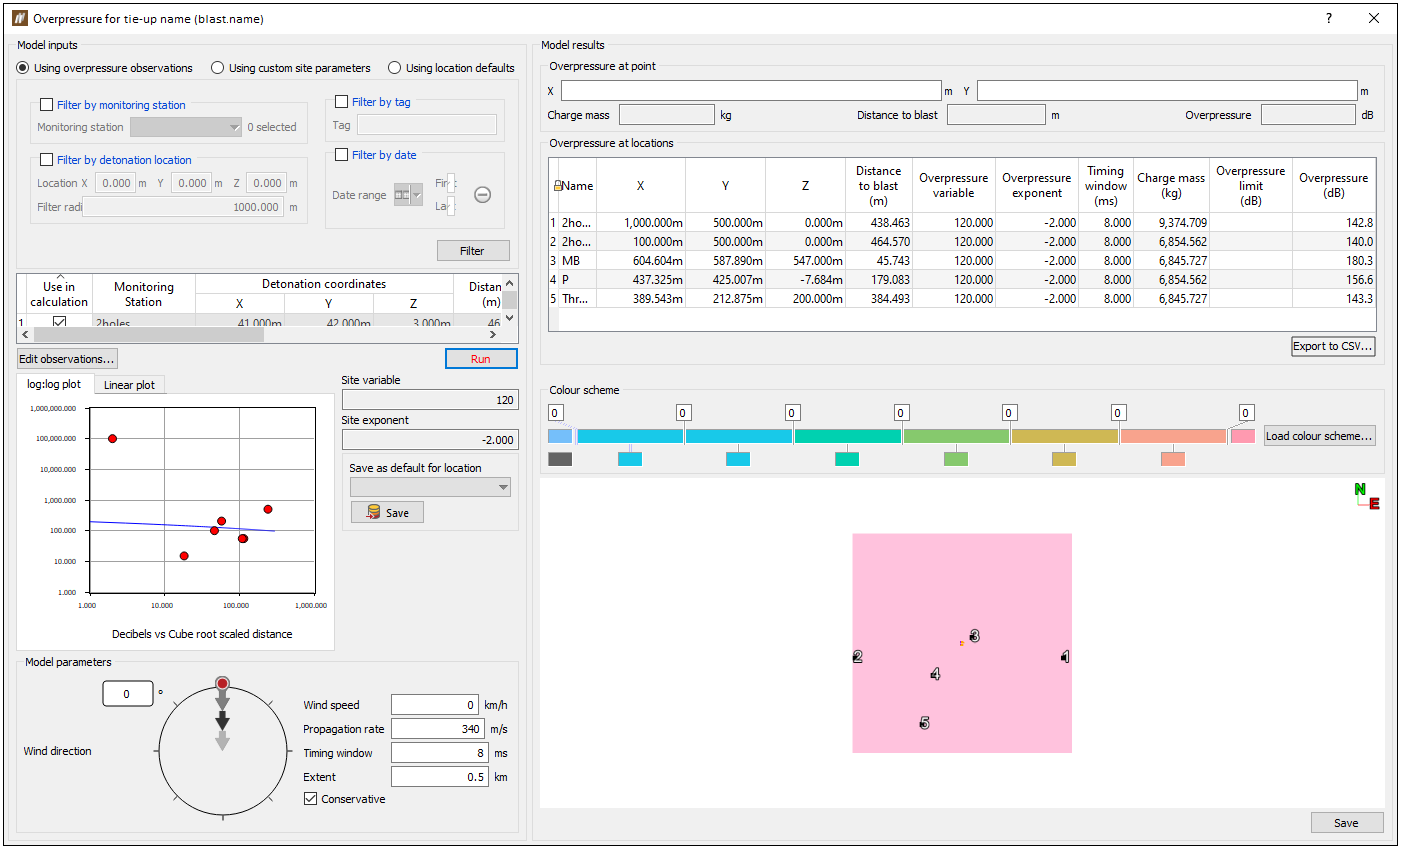
To verify overpressure at a specific point, you can enter x and y coordinates in the Model results > Overpressure at point section (for known monitor locations or sensitive areas) or simply click inside a coordinate field or anywhere on the plot: the x and y coordinates for the selected point will be displayed. The overpressure at the point will be shown on the right side of the panel.
Estimating overpressure at locations
The table lists all locations for the site that are within the range (defined in Locations) and lists the overpressure calculated from the model at the coordinates of the location. If the overpressure result exceeds the overpressure limit (defined in Locations), then the row will be highlighted in red.
Clicking Export locations will export the list of locations and their overpressure value to a CSV file.
