Report
The Report group on the Drilling ribbon contains tools to generate reports on drilling accuracy, calibration and productivity.

 Drilling Depth Accuracy
The Drilling Depth Accuracy tool provides a summary of the accuracy of the drilling process, in relation to the drill depth. BlastLogic uses the drill depth error tolerance as the point of reference when determining the drilling process accuracy. This tolerance is set in the Process Tolerances tab (Home ribbon > Setup group > ![]() Site, see Process tolerances).
Site, see Process tolerances).
To generate a drilling depth accuracy report, follow these steps:
-
Select the desired holes in the view window or data explorer.
-
On the Drilling ribbon, in the Report group, select
 Drilling Depth Accuracy.
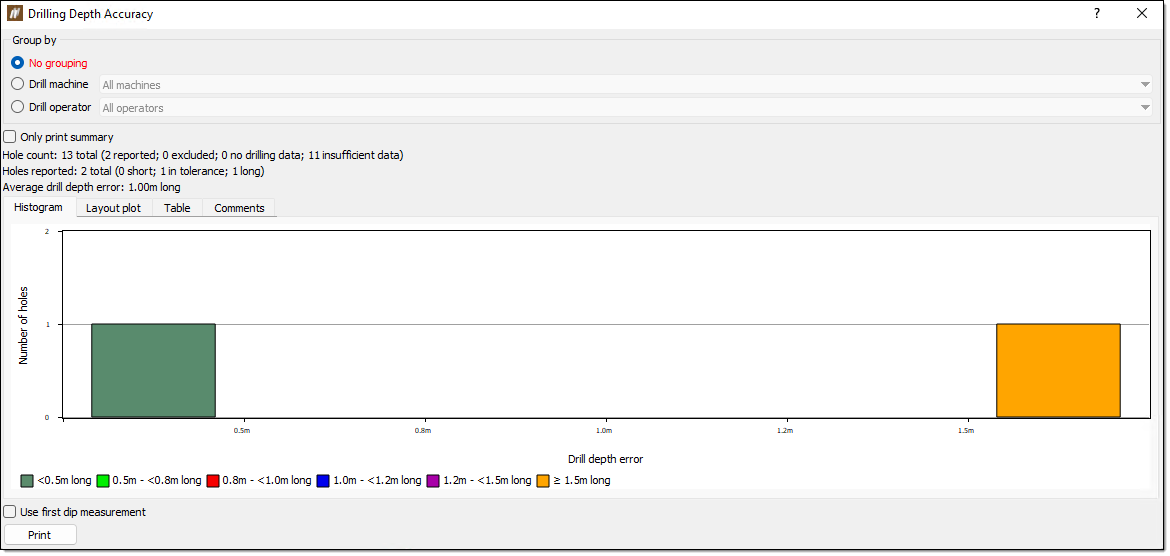
 The Drilling Depth Accuracy panel will appear.
-
Select how you wish to group the results using the radio buttons in the Group by section. BlastLogic will dynamically update the report depending on how you decide to group the data.
-
Optionally, select the Use first dip measurement checkbox to use the first dip measurement.
-
Browse the report tabs. The report displays data differently in four separate tabs:
-
Histogram. The Histogram tab displays a histogram of the number of holes against the drill depth error. You can interact with the histogram in the following ways:
-
Hover over a bar to display the number of holes in the bar and the specific range of the bar.
-
Double click a bar to open the hole tabular view associated with the holes in the bar.
-
-
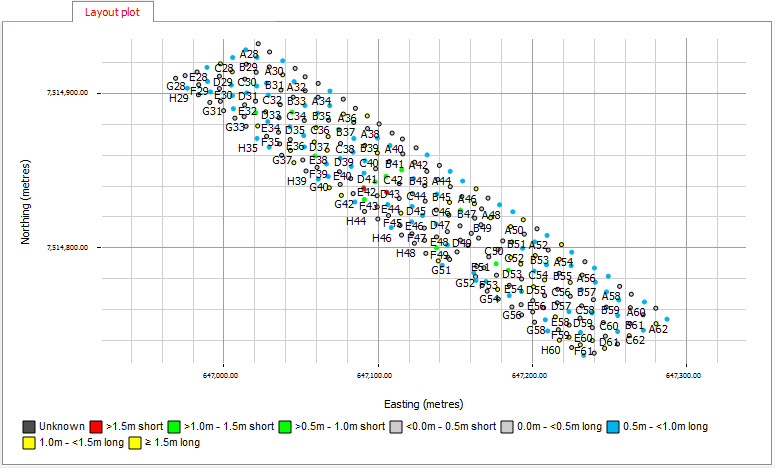
Layout plot. BlastLogic displays a plot of the holes in the Layout plot tab. You can interact with the plot in the following ways:
-
Zoom into sections of the plot by drawing a box around the desired area. Zoom out by right-clicking anywhere on the plot.
-
Double click on a hole in the plot to display the hole properties panel for that hole.
-
-
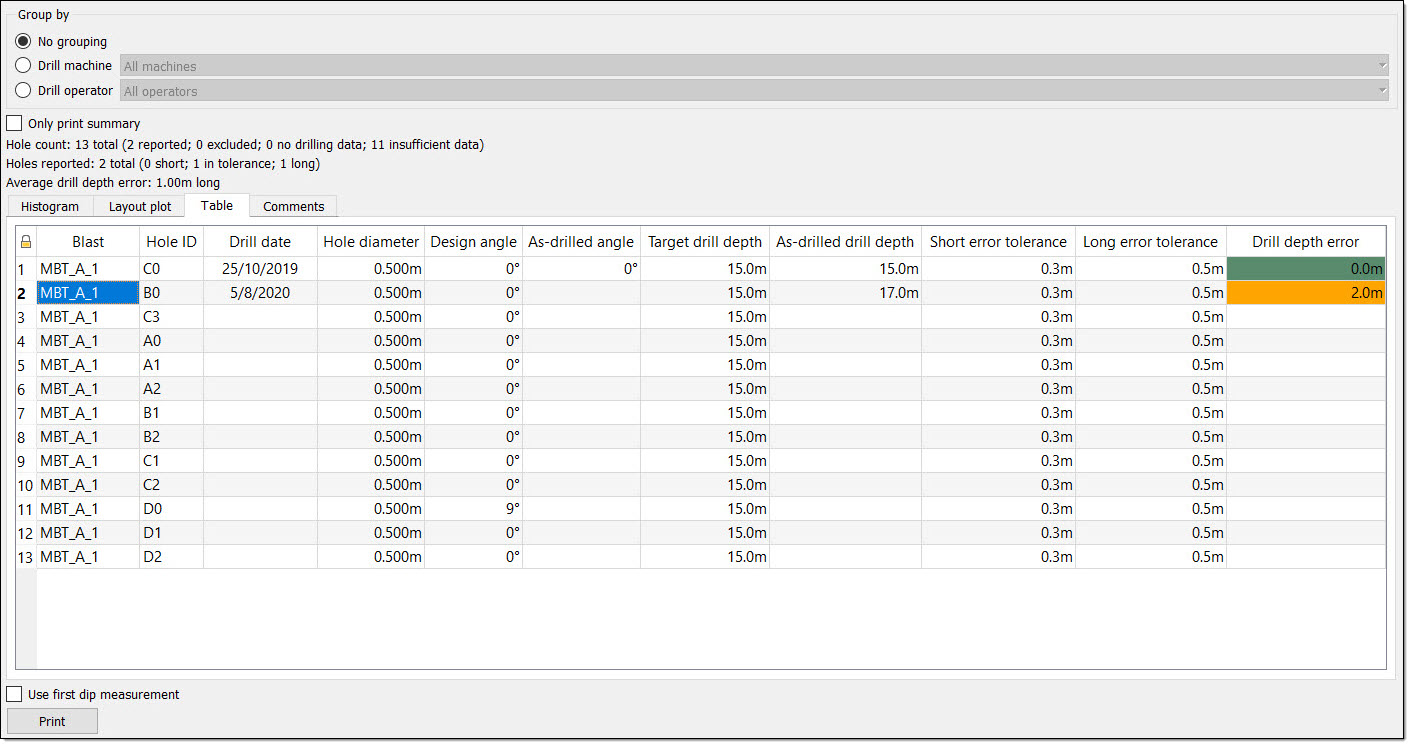
Table. The Table tab shows a table summary of the drill data. BlastLogic indicates abandoned holes with a strike through the text.
 Note:
Note:BlastLogic colours the Drill depth error column cells according to the settings in the report tab of the site tool panel. You can open this panel by navigating to the Home ribbon and selecting Site from the Setup group. For more information on changing these colours, see the Report setup section of the Setup topic.

-
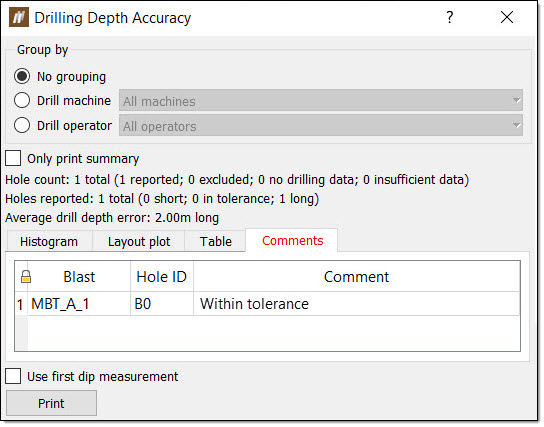
Comments. BlastLogic displays any comments entered with the drilling data in the Comments tab.
-
-
Optionally, print a PDF version of the report by selecting Print.
 Drilling Collar Accuracy
The Drilling Collar Accuracy tool provides a summary of the accuracy of the drilling process, in relation to the drill collar (X and Y axes). BlastLogic uses the drill collar error tolerance as the point of reference when determining the drilling process accuracy. This tolerance is set in the Process Tolerances tab (Home ribbon > Setup group > ![]() Site, see Process tolerances).
Site, see Process tolerances).
To generate a drilling collar accuracy report, follow these steps:
-
Select the desired holes in the view window or data explorer.
-
On the Drilling ribbon, in the Report group, select
 Drilling Collar Accuracy.
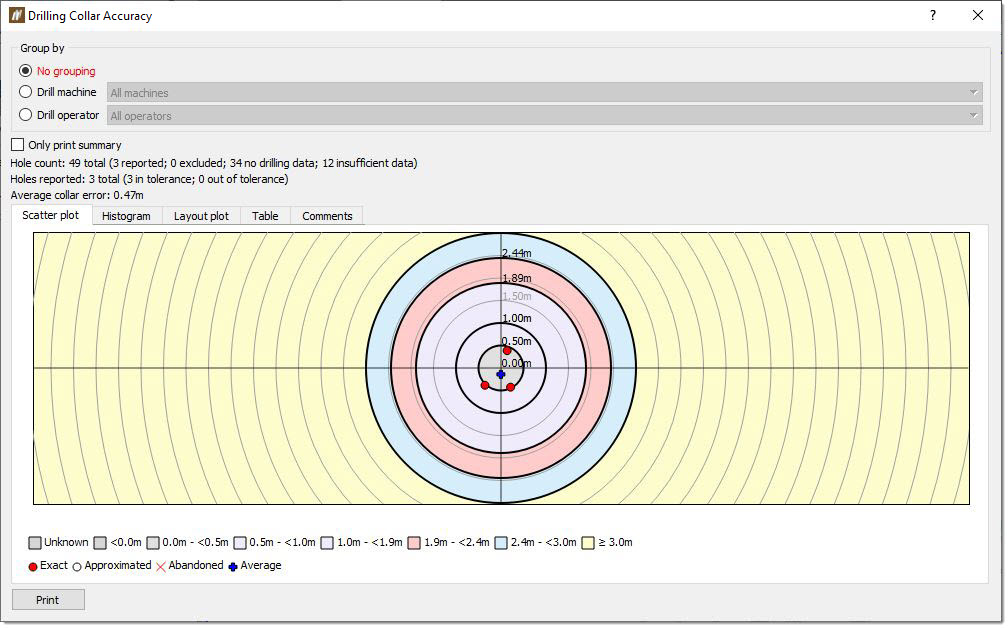
The Drilling Collar Accuracy panel will appear.
-
Select how you wish to group the results using the radio buttons in the Group by section. BlastLogic will dynamically update the report depending on how you decide to group the data.
-
Browse the report tabs. The report displays data differently in five separate tabs:
-
Scatter plot. The Scatter plot tab displays a scatter plot of the collar accuracy of the holes.
-
Histogram. The Histogram tab displays a histogram of the number of holes against the drill depth error. You can interact with the histogram in the following ways:
-
Hover over a bar to display the number of holes in the bar and the specific range of the bar.
-
Double click a bar to open the hole tabular view associated with the holes in the bar.
-
-
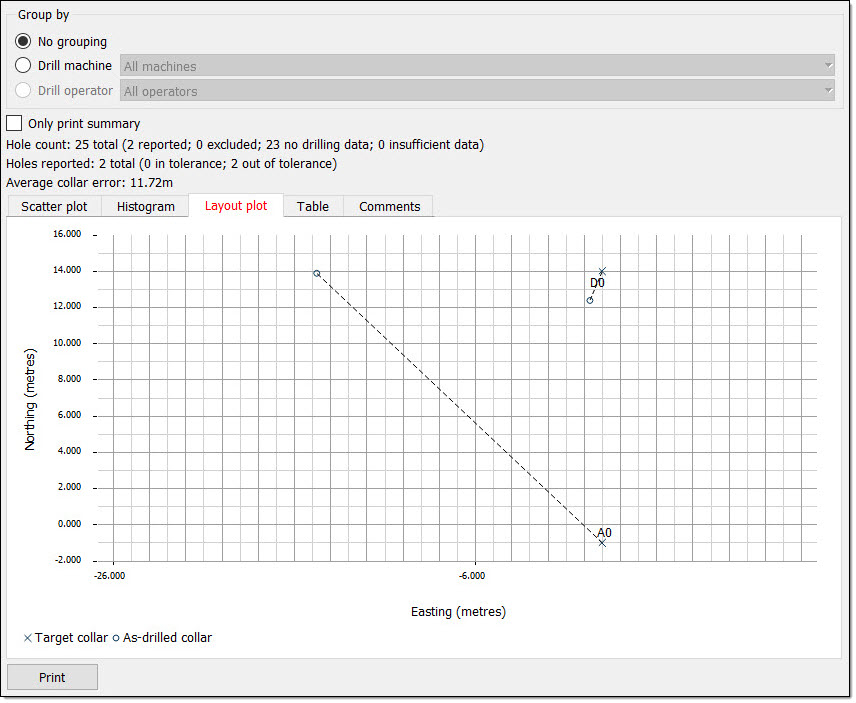
Layout plot. BlastLogic displays a plot of the holes in the Layout plot tab. You can interact with the plot in the following ways:
-
Zoom into sections of the plot by drawing a box around the desired area. Zoom out by right-clicking anywhere on the plot.
-
Double click on a hole in the plot to display the hole properties panel for that hole.
-
-
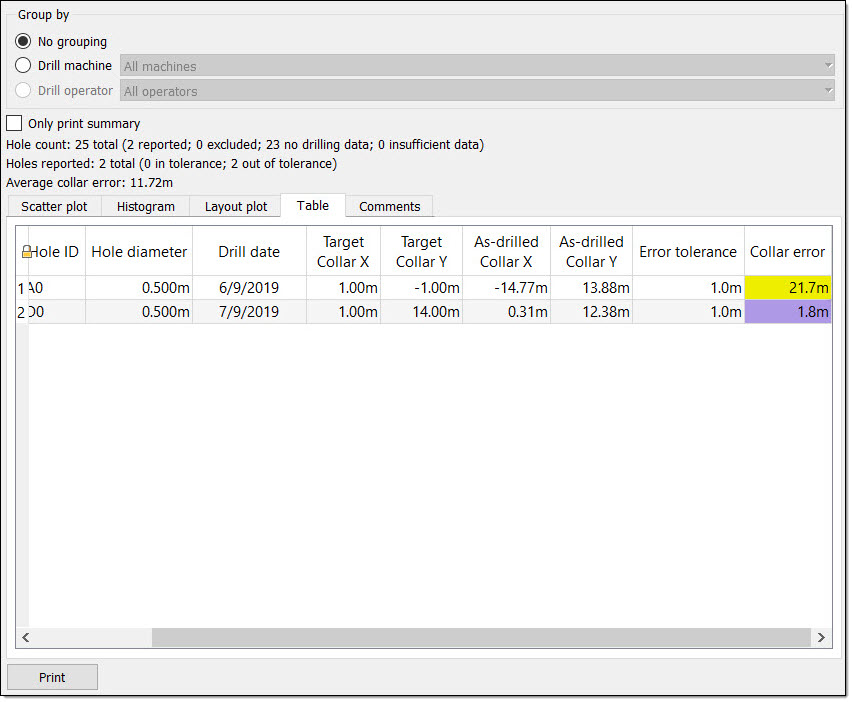
Table. The Table tab shows a table summary of the drill data. BlastLogic indicates abandoned holes with a strike through the text.
 Note:
Note:BlastLogic colours the Collar error column cells according to the settings in the report tab of the site tool panel. You can open this panel by navigating to the Home ribbon and selecting Site from the Setup group. For more information on changing these colours, see the Report setup section of the Setup topic.

-
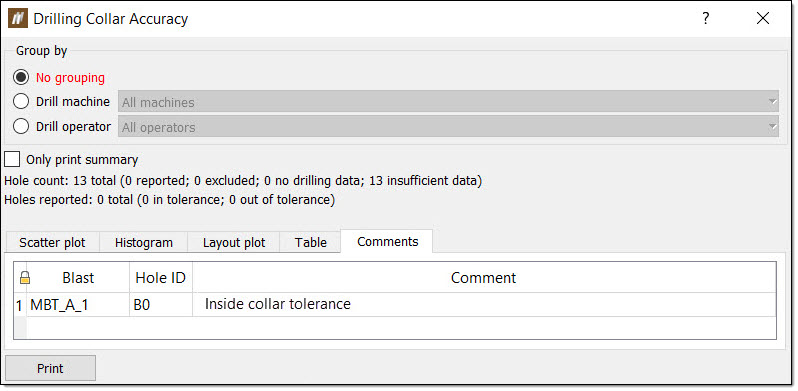
Comments. BlastLogic displays any comments entered with the drilling data in the Comments tab.
-
-
Optionally, print a PDF version of the report by selecting Print.
 Drilling Setup Accuracy
The Drilling Setup Accuracy tool provides a summary of the accuracy of the drilling process, in relation to the setup. BlastLogic uses the setup error tolerance as the point of reference when determining the drilling process accuracy. This tolerance is set in the Process Tolerances tab (Home ribbon > Setup group > ![]() Site, see Process tolerances).
Site, see Process tolerances).
To generate a drilling setup accuracy report, follow these steps:
-
Select the desired holes in the view window or data explorer.
-
On the Drilling ribbon, in the Report group, select
 Drilling Setup Accuracy.
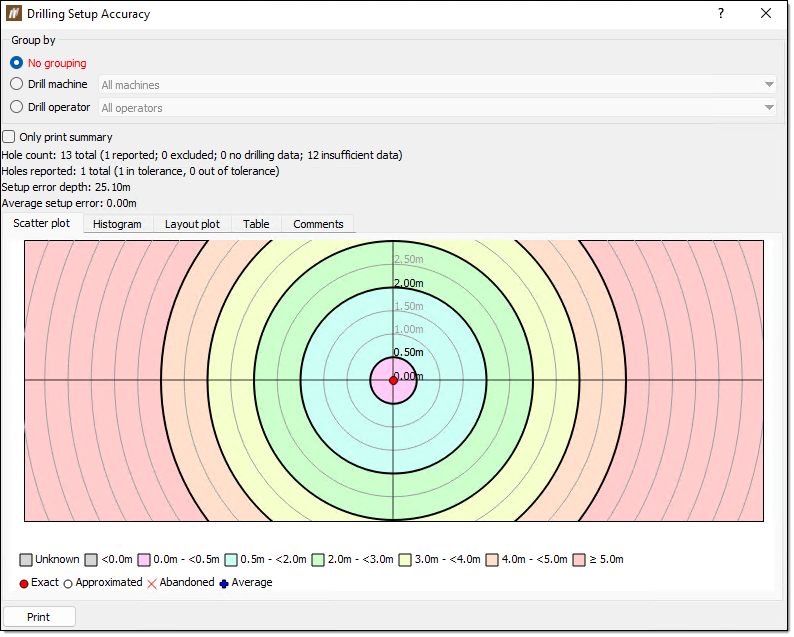
The Drilling Setup Accuracy panel will appear.
-
Select how you wish to group the results using the radio buttons in the Group by section. BlastLogic will dynamically update the report depending on how you decide to group the data.
-
Browse the report tabs. The report displays data differently in five separate tabs:
-
Scatter plot. The Scatter plot tab displays a scatter plot of the setup accuracy of the holes.
-
Histogram. The Histogram tab displays a histogram of the number of holes against the setup error. You can interact with the histogram in the following ways:
-
Hover over a bar to display the number of holes in the bar and the specific range of the bar.
-
Double click a bar to open the hole tabular view associated with the holes in the bar.
-
-
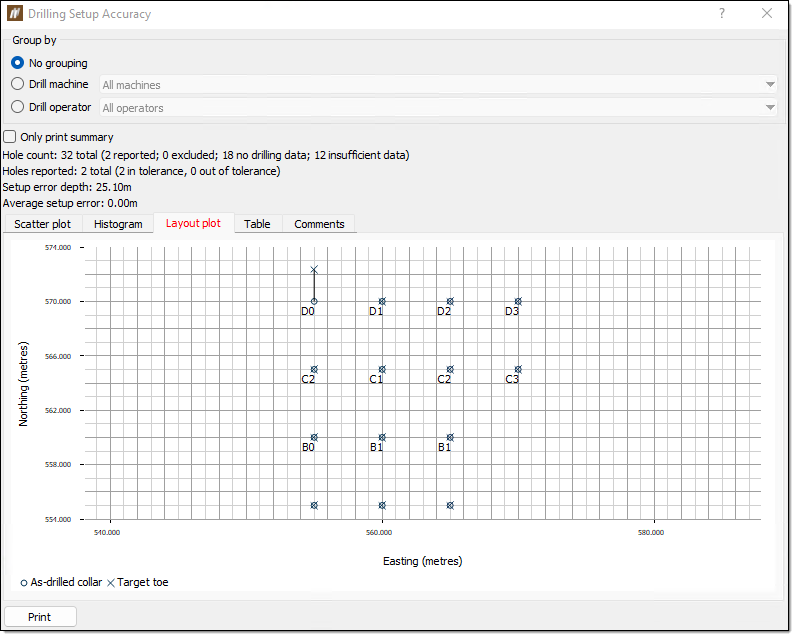
Layout plot. BlastLogic displays a plot of the holes in the Layout plot tab. You can interact with the plot in the following ways:
-
Zoom into sections of the plot by drawing a box around the desired area. Zoom out by right-clicking anywhere on the plot.
-
Double click on a hole in the plot to display the hole properties panel for that hole.
-
-
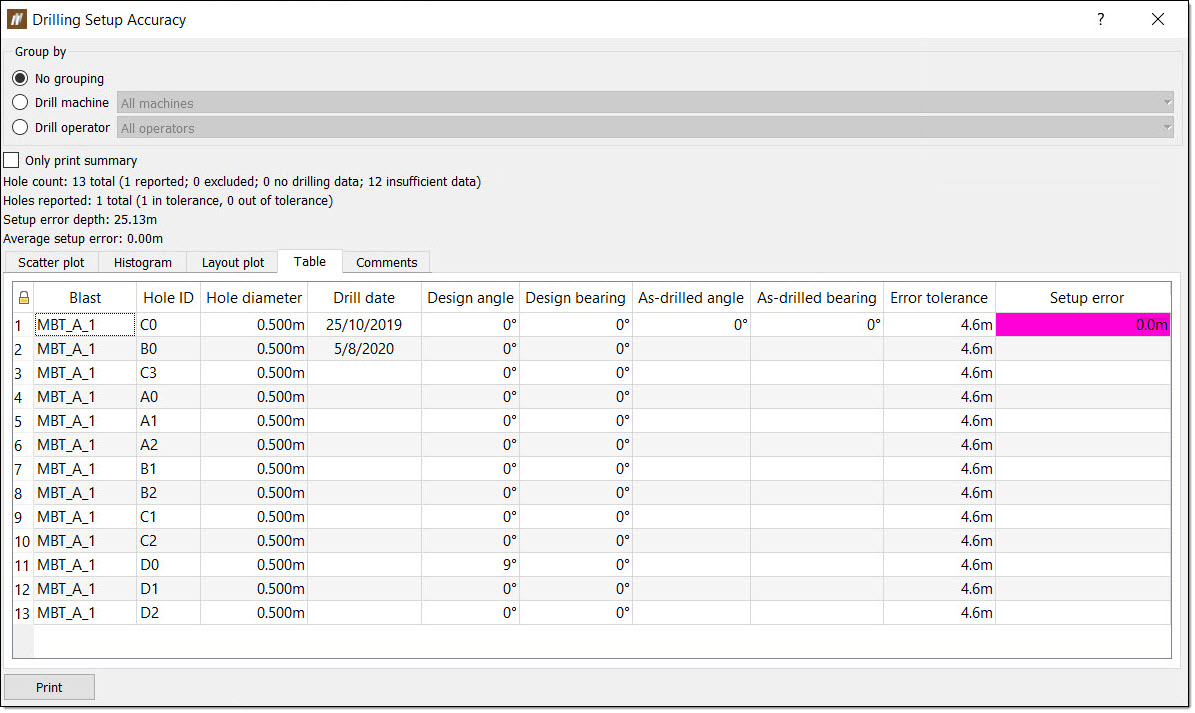
Table. The Table tab shows a table summary of the drill data. BlastLogic indicates abandoned holes with a strike through the text.
 Note:
Note:BlastLogic colours the Setup error column cells according to the settings in the report tab of the site tool panel. You can open this panel by navigating to the Home ribbon and selecting Site from the Setup group. For more information on changing these colours, see the Report setup section of the Setup topic.

-
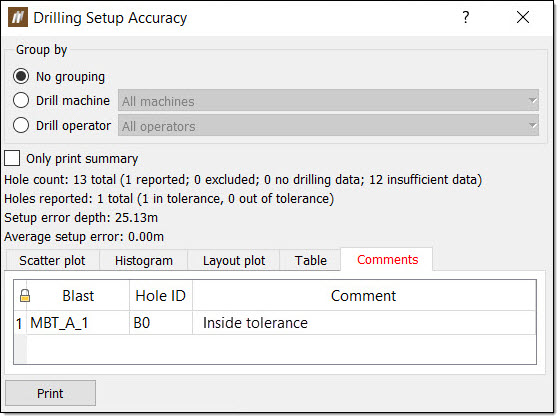
Comments.BlastLogic displays any comments entered with the drilling data in the Comments tab.
-
-
Optionally, print a PDF version of the report by selecting Print.
 Drill Calibration
As a part of quality control, operators are required to check the depth of the first hole that they drill in a shift. The difference between the as-drilled depth and the dip depth for the first hole is the drill calibration error.
The Drill Calibration tool displays the drill calibration error for each first hole within a specified time frame for each drill machine. The cell containing the error is coloured according to the drill depth calibration colour legend set in the Report setup tab (Home > Setup > ![]() Site ).
Site ).
To generate a drill calibration report, follow these steps:
-
Select the desired holes in the view window or data explorer.
-
On the Drilling ribbon, in the Report group, select
 Drill Calibration.
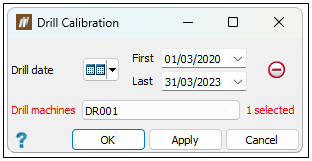
The Drill Calibration panel will appear.
-
Select the time frame and drill machine from the Drill date and Drill machine drop-downs respectively. If you do not select a drill machine, BlastLogic will return results for all the drill machines on site.
-
Click OK or Apply.
A new Drill Calibration panel tabulating the results will appear.
-
Optionally, print a PDF version of the report by selecting Print.
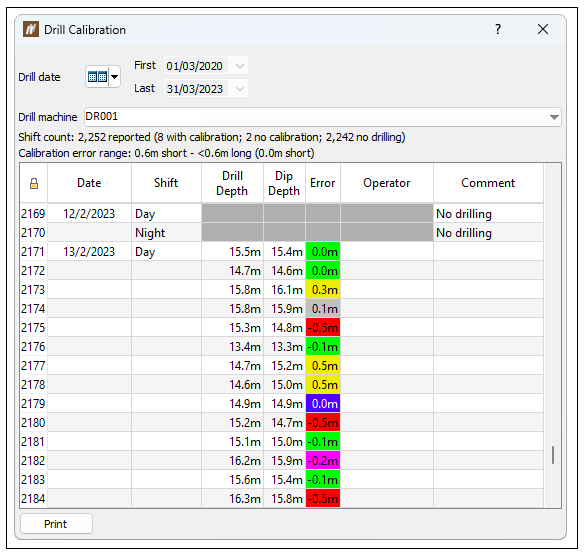
BlastLogic colours the Error column cells according to the settings in the Report setup tab of the site tool panel (Home ribbon > Setup group > ![]() Site). For more information on changing these colours, see the Report setup section of the Setup topic.
Site). For more information on changing these colours, see the Report setup section of the Setup topic.

 Drilling Productivity
The Drilling Productivity Report provides a summary of the quality of the drilling process. You can export the results as either a PDF or a CSV.
To generate a drilling productivity report, follow these steps:
-
Select the desired holes in the view window or data explorer.
-
On the Drilling ribbon, in the Report group, select
 Drilling Productivity Report.
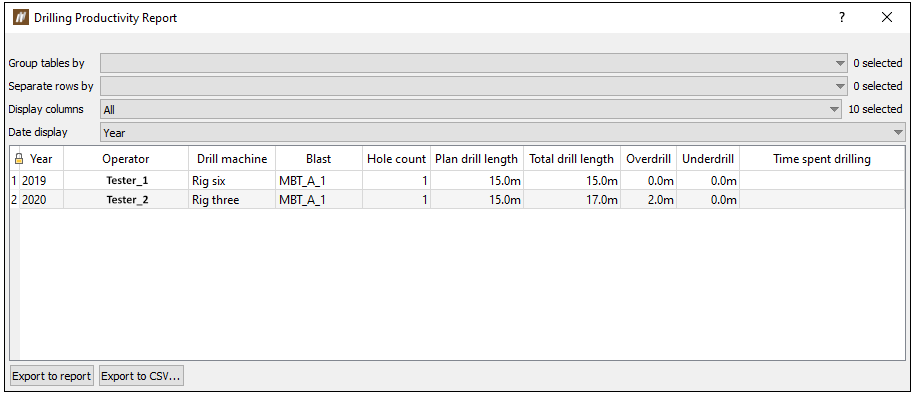
 The Drilling Productivity Report panel will appear.
-
Customise the report using the following drop-down options:
-
Group tables by: Use this drop-down to select which tables BlastLogic should display in the report.
-
Separate rows by: Use this drop-down to specify the variable you wish to separate the report table rows by. A histogram of the total drill length will also be included in the report.
-
Display columns: Use this drop-down to select the columns you wish to display in the report.
-
Date display: Select a time period to list data.
-
-
Export the report to a PDF or a CSV by selecting Export to report or Export to CSV... respectively.
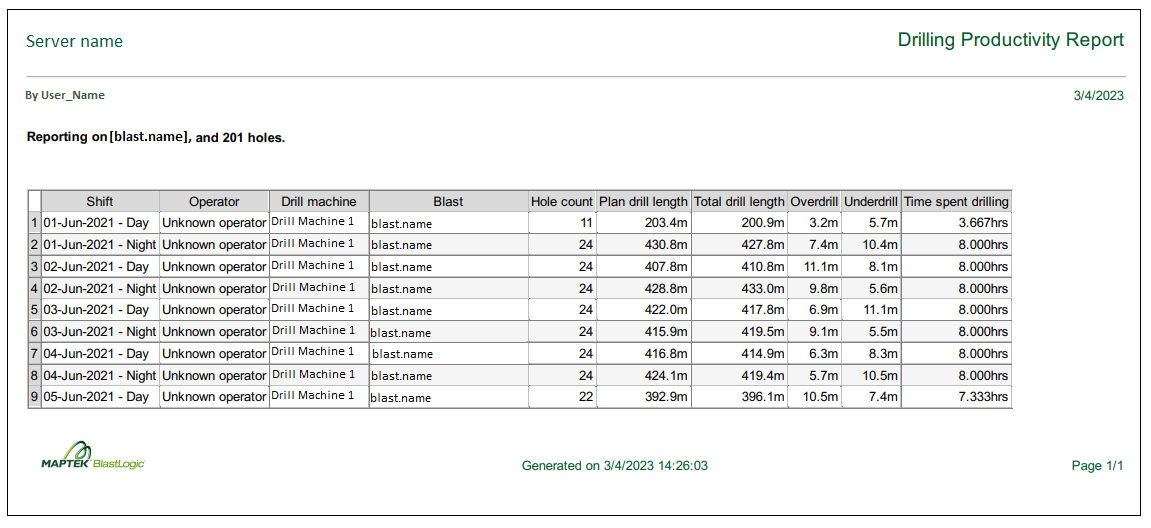
The following is an example of a report exported to PDF:
