Report
Source file: charging-report.htm
The Report group of the Charging ribbon contains tools to generate reports on different charging processes.

 Charging Productivity
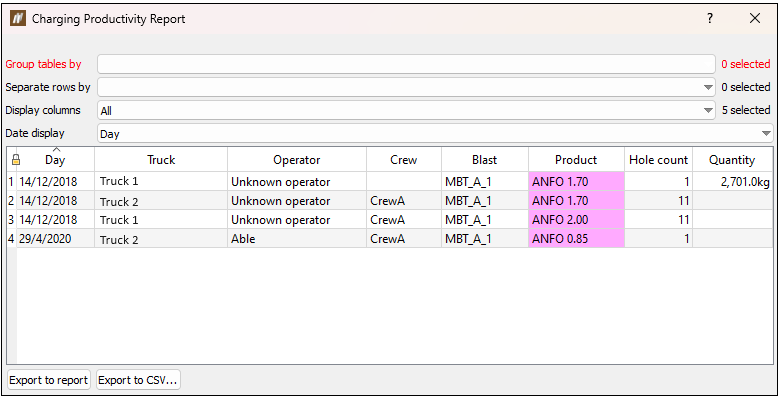
The Charging Productivity tool provides a summary of the charging process. The results can be exported as either a PDF or CSV.
To generate a charging productivity report, follow these steps:
- Select holes.
- Go to Charging > Report >
 Charging Productivity. This will open a new panel.
 - Customise the report using the following options:
- Group tables by: Controls what tables are displayed in the report.
- Separate rows by: Controls the display of histograms in the report.
- Display columns: Either all or a selected number of columns can be displayed.
- Date display: Users can choose to list data by shift, day, week, month or year.
- Export the report to a PDF or a CSV file.
 Charge Placement Accuracy
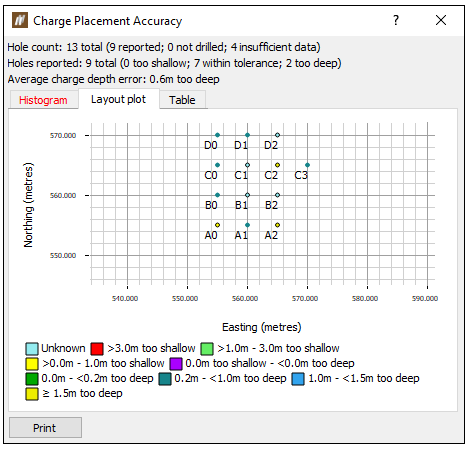
The Charge Placement Accuracy tool presents a measure of the accuracy of the charging process. Ideally, it is run after the holes have been charged. This report can be used for identifying systematic errors in the charging and (or) backfilling process, and evaluating the quality of backfilling and charging across the blast.
The report will only consider holes that are not abandoned, and are loaded with charge. Reconciled charge will take precedence over loaded charge.
To generate a charge placement activity report, follow these steps:
- Select holes.
- Go to Charging > Report > Charge Placement Accuracy. This will open up a new panel.
The panel contains three tabs:
-
Histogram
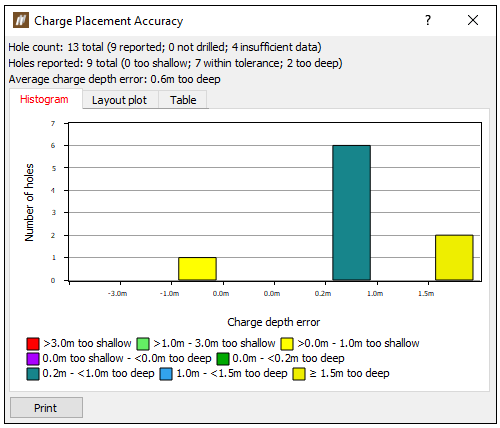
Note: Hovering over a bar displays the number of holes in the bar and the specific interval (range) of the bar.
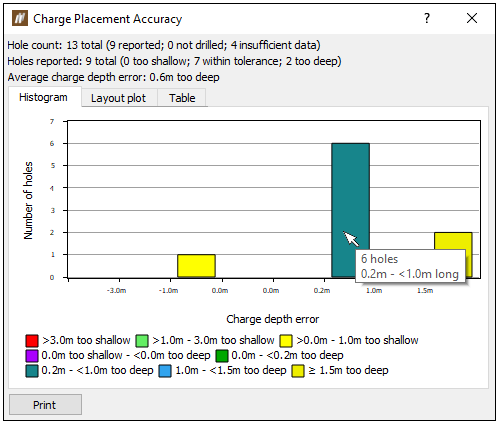
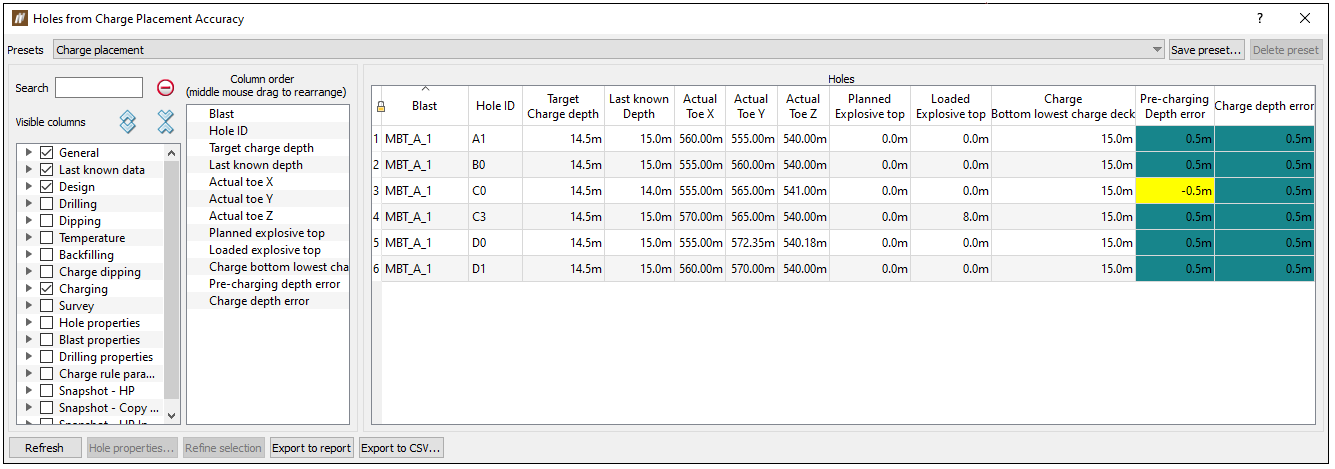
Note: You can open Hole Tabular View by double-clicking a bar in the Histogram tab.
-
Layout plot
-
Table
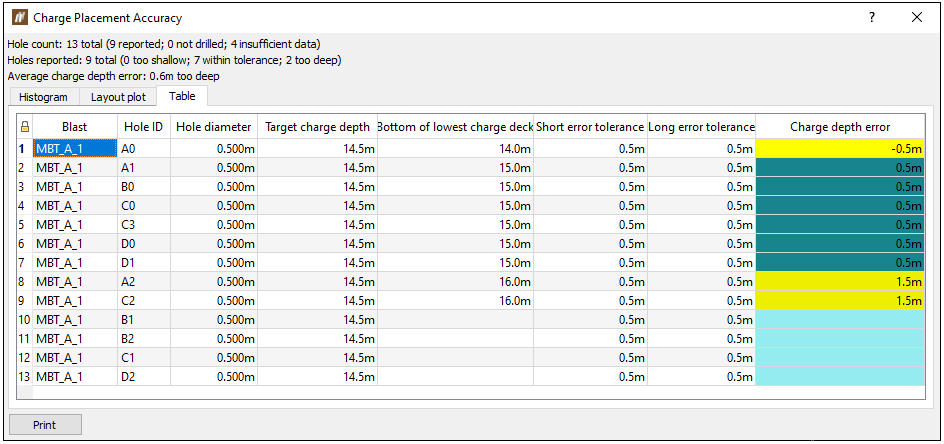
Note: You can set the colour configuration of the Charge depth error cell in the Report setup (Home ribbon > Setup group >
 Site).
 Protective Cap Performance
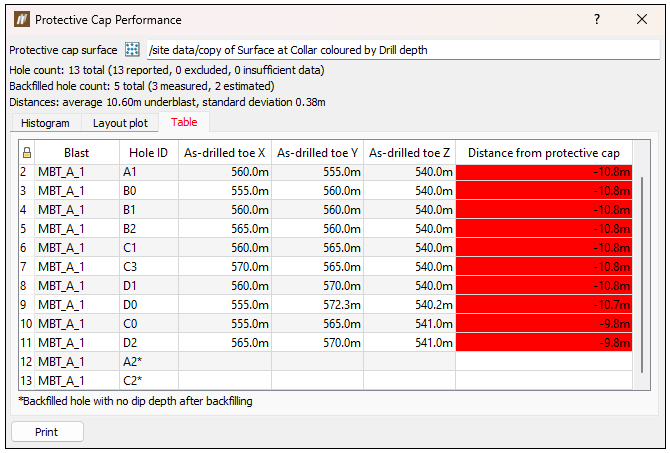
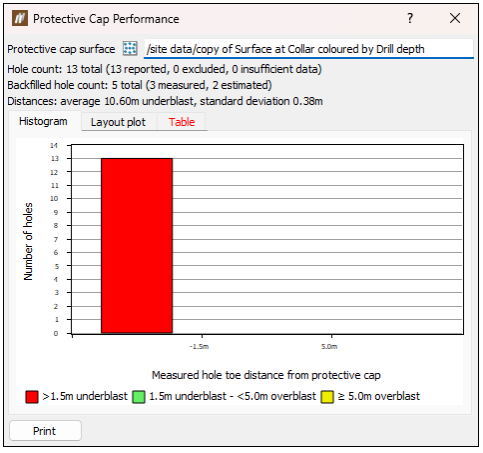
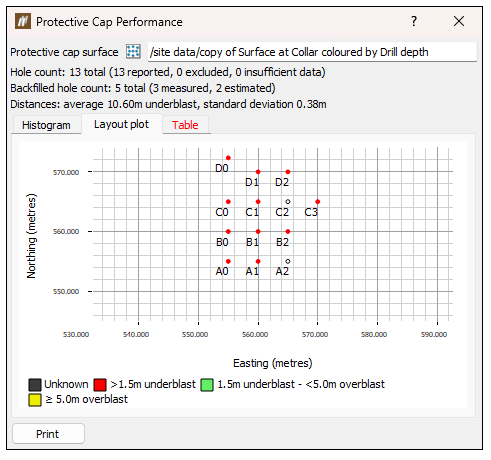
The protective cap performance report is used to compare the surveyed post-blast surface (protective cap) against the locations of the as-built hole toes. This allows to evaluate the overall performance of the blast.
To generate a protective cap performance, follow these steps:
-
Ensure the post-blast surface is available in BlastLogic. It will usually be stored in the site data container. If it is not available, import the surface using the Import tool (Home ribbon > Data group >
 Import).
 -
Select the blast containing the holes for the report.
-
Go to Charging > Report>
Protective Cap Performance. -
Drag and drop the protective cap surface from the explorer window into the Protective cap surface field using middle mouse button.
The panel contains three tabs:
-
Histogram
-
Layout plot
-
Table
 Charge Reconciliation
The Charge Reconciliation tool compares the charge plan of each hole in a blast with the actual.
To generate a charge reconciliation report, follow these steps:
-
Select a blast.
-
Select Charging > Report >
Charge Reconciliation Report. This will open a new panel.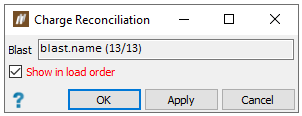
-
Click OK or Apply.
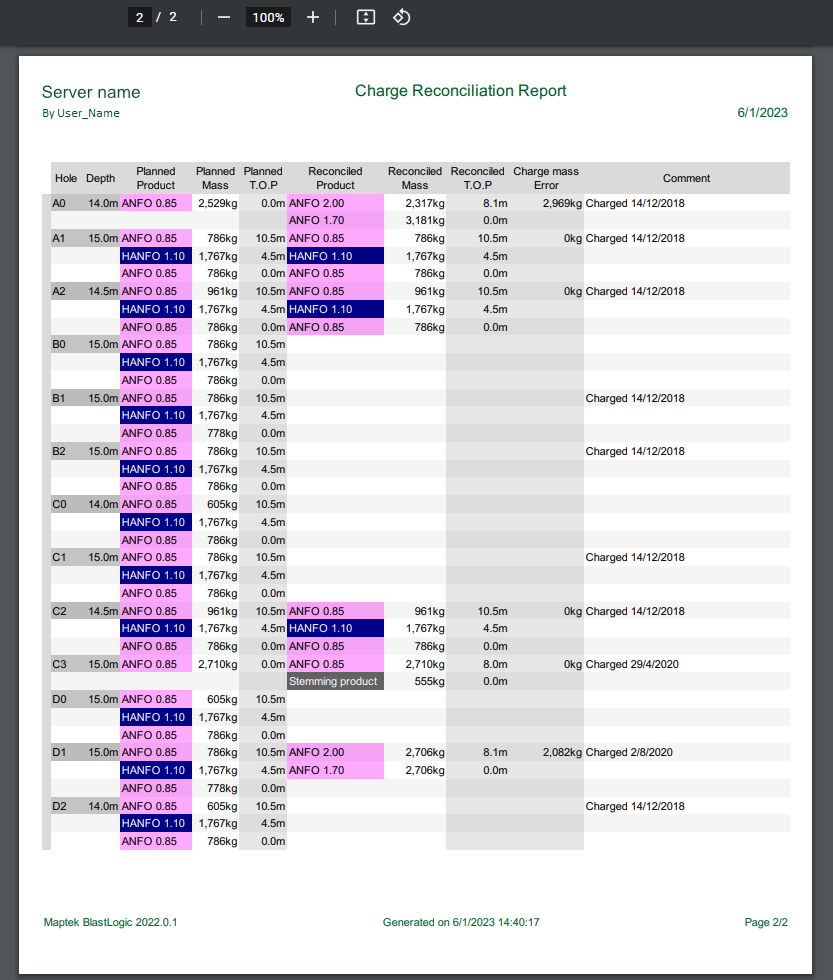
The charge reconciliation report, which can be printed or saved to PDF, is created. The cover page shows a summary of the products used.
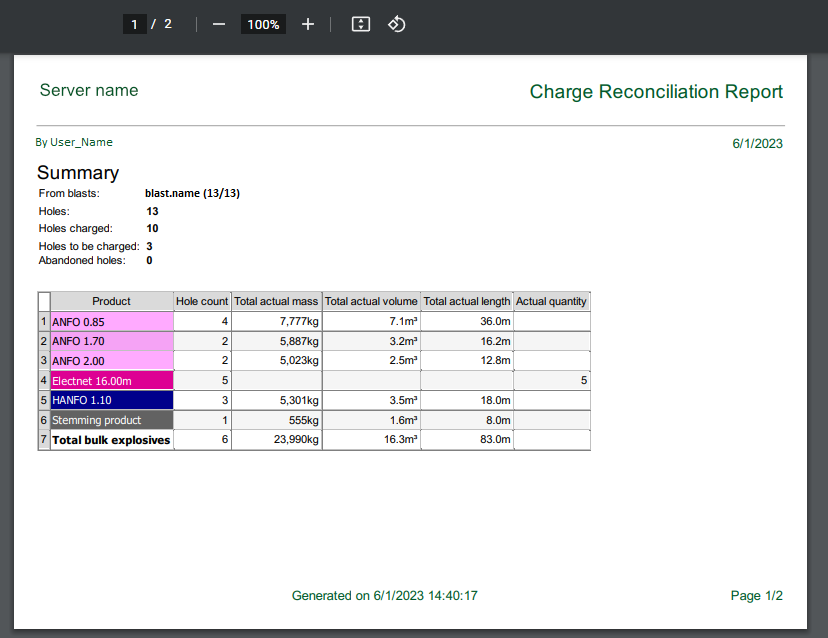
The remaining pages in the report show a hole by hole breakdown of the charging data.
 Density Measurements Report
-
Select some holes that contain loaded decks with density measurements.
-
Open the Density Measurements Report from the Charging ribbon > Report group >
Density Measurements Report or from the Report ribbon > Charging group > Density Measurements Report. This will open a new panel. -
Configure the following options to refine your report:
-
Set the Separate rows by field to one of the following: Charging shift, Truck, Operator, Crew, Blast, Product, Hole, or Deck.
-
Use the latest density measurements by selecting the Latest measurements only checkbox.
-
Only include decks containing density measurements by selecting the Exclude decks without measurements checkbox.
-
Refine your selection by selecting rows in the table and then clicking Selected rows (to select multiple rows, press and hold the Ctrl keyboard button and select the desired rows by left-clicking on them).
-
Refine your selection by only selecting holes that have density measurements that are out of tolerance by clicking Out-of-tolerance rows.
-
Select rows in the table to update the graph on the right side of the panel to plot the recorded density over time since the first measurement. Multiple rows can be selected to compare measurements from different samples.
-
-
Export your report:
-
As a PDF file by clicking To report. If any rows are selected, this report will contain the current graph as shown in the panel.
Or
-
As a CSV file by clicking To CSV.
-
