Schedule Report
You can view the schedule report by double-clicking the schedule in the project explorer. The report contains the following tabs, which can also be exported for further analysis.
Schedule overview
The Schedule Overview tab contains the following information groups:
-
Overall Schedule Totals — This shows the mining and processing physical and financial data per period.
-
Block Models — This shows the mined tonnes and closure costs per period.
-
Process — This reports the cut-off grade applied to the following measures:
-
process
-
tonnes
-
grades
-
recovery
-
costs
-
revenue
-
profit generated
-
-
Waste — This shows the waste tonnes mined and the associated costs per period.
-
Stockpile Accumulation — This reports the amount of material mined to the stockpile for a given period, along with the grades and mining costs.
Charts
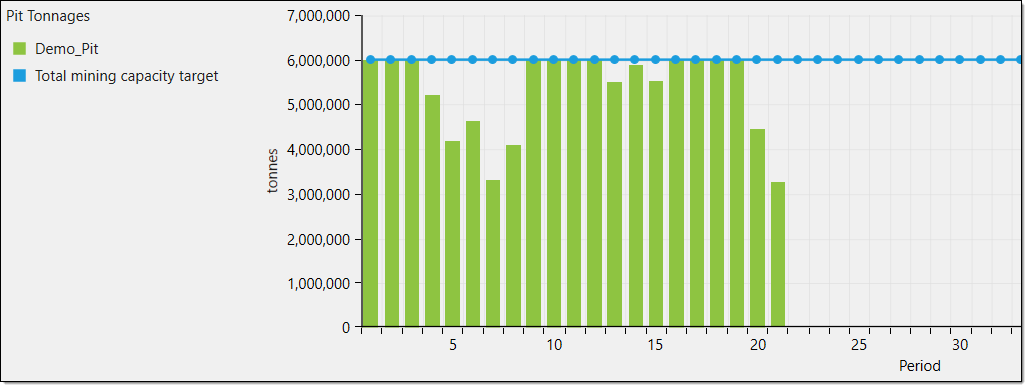
The Charts tab displays charts based on variables in the Schedule Overview tab. If applicable, each chart will also feature a line depicting a chart target. This allows you to compare the schedule values against the targets set in the schedule setup. You can view the following charts in this tab:
-
Pit Tonnages — This chart displays the total tonnages removed from the pit(s) per period.
-
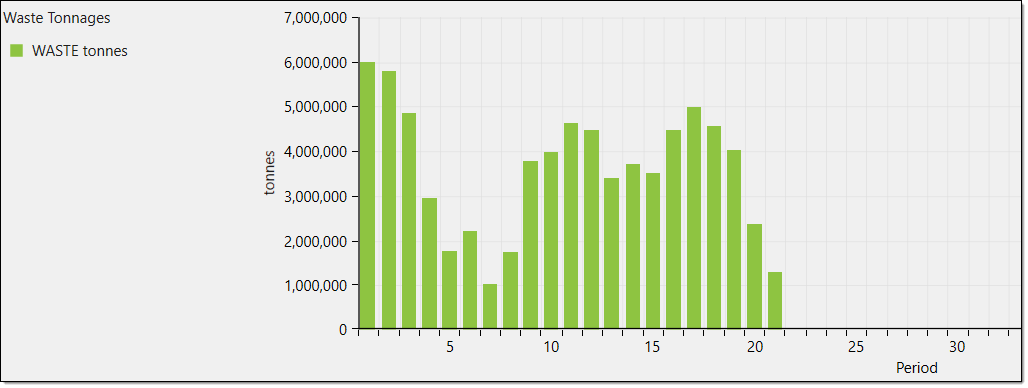
Waste Tonnages — This chart displays the total tonnages of waste mined per period.
-
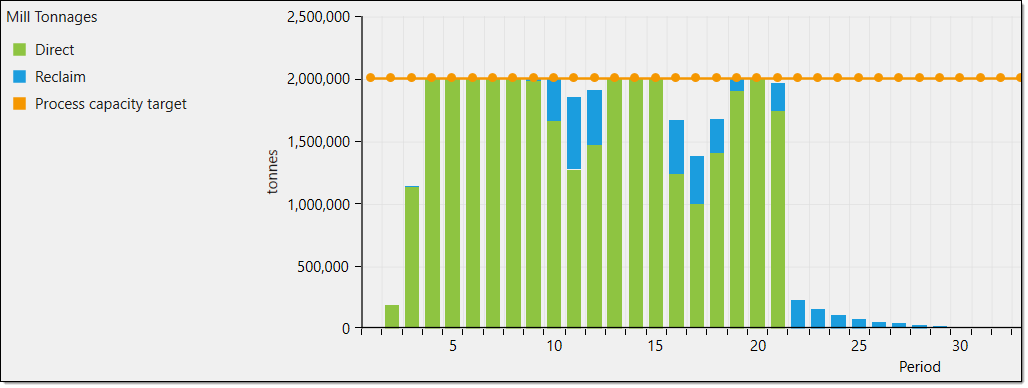
Mill Tonnages — This chart displays the tonnages processed by the mill directly and through stockpile reclaim.
-
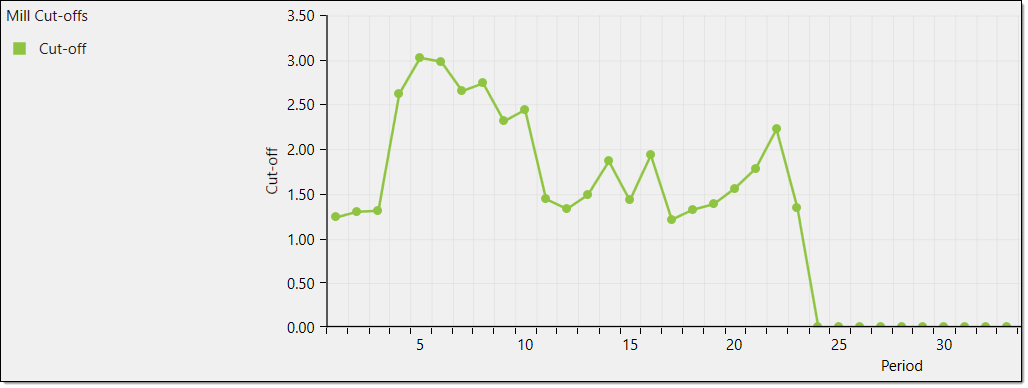
Mill Cut-off — This chart displays the cut-offs applied to the mill per period.
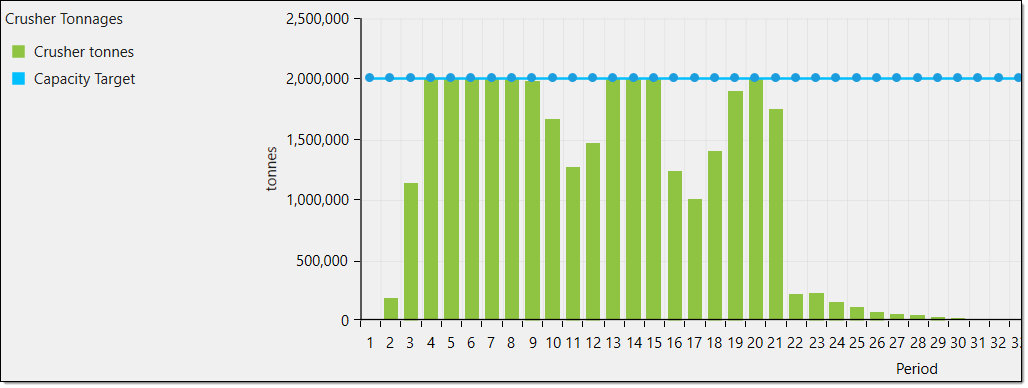
- Crusher Tonnages — This chart displays the tonnages of material generated by the crusher per period.
Other charts may also be displayed depending on your schedule setup. These include:
-
Dependent Tonnages — This chart displays the total tonnages mined for each ore type when the processes are dependent on each other.
-
Dependent Cut-offs — This chart displays the cut-offs applied to the dependent processes.
-
Process Tonnages — This chart displays the tonnages generated by the process directly and through stockpile reclaim.
-
Process Cut-offs — This chart displays the cut-offs applied to the process.
-
Stockpile Inventory Mass — This chart displays the mass of each stockpile—including manual stockpiles—per period.
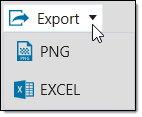
You can export these charts by clicking Export in the top left corner of the workspace. In the drop-down, select either a PNG or EXCEL export.
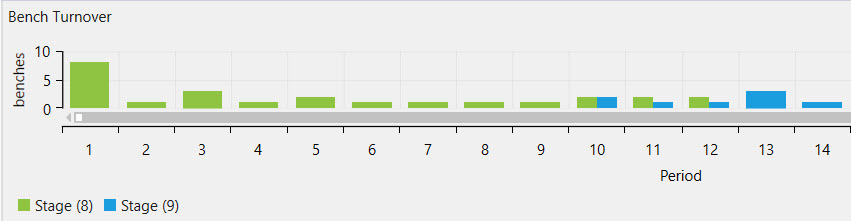
Stages
The following information is detailed in the Stages section.
-
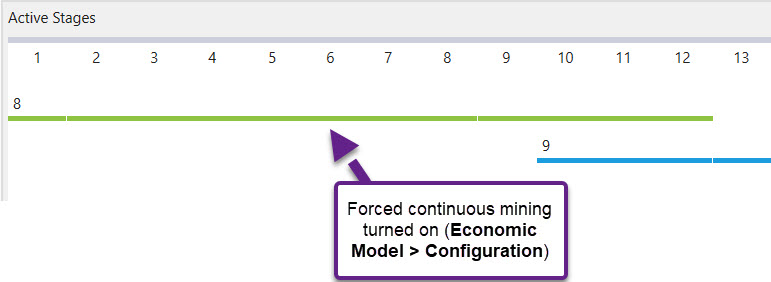
Active Stages — Shows on a period basis, the active mining stages in a Gantt chart view.
-
Bench Turnover — Shows the total number of benches ( based on block height) mined in a period.
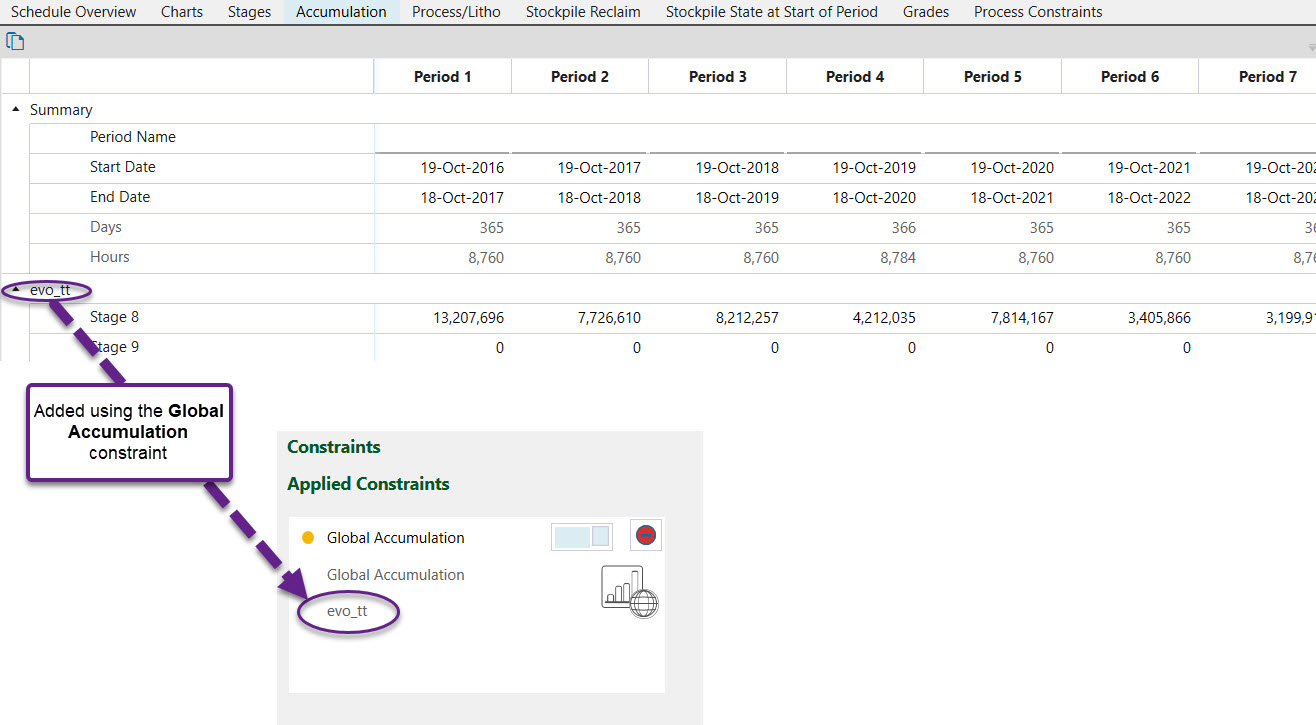
Accumulation
This section details the results of the Accumulation constraints added in the Constraints tab of setup preparation.
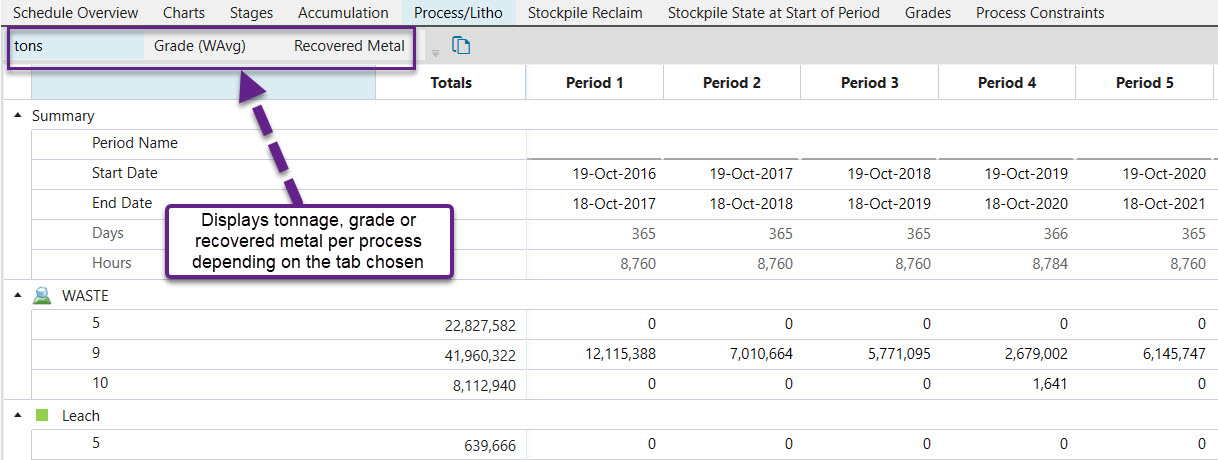
Process/Litho
For each process, the total tonnes, grade average and recovered metal by lithography are displayed per period.
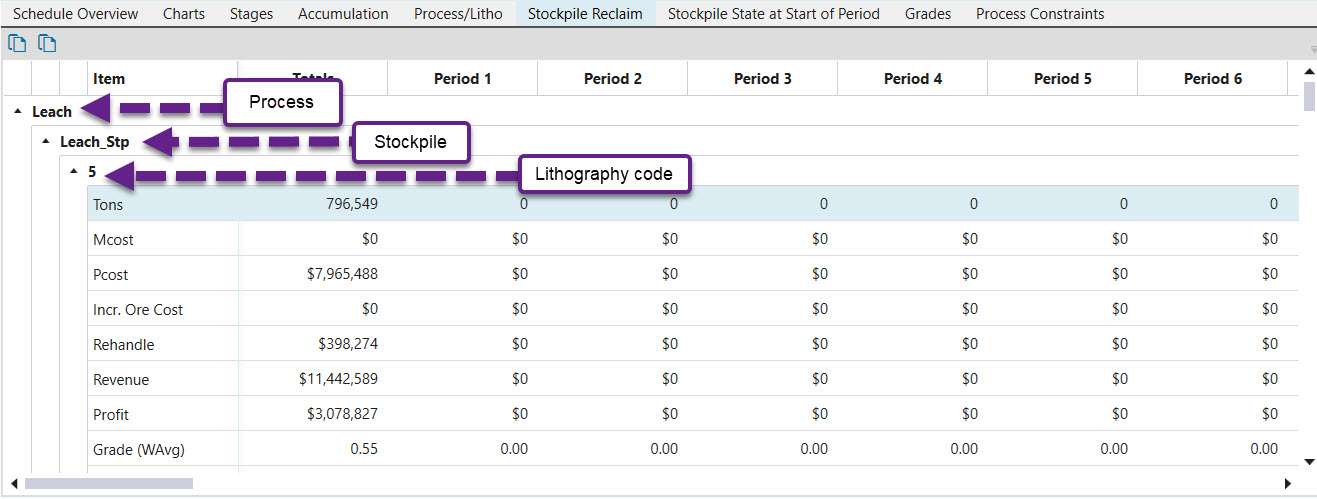
Stockpile Reclaim
This section provides an economic breakdown (per lithography) for each stockpile in the setup.
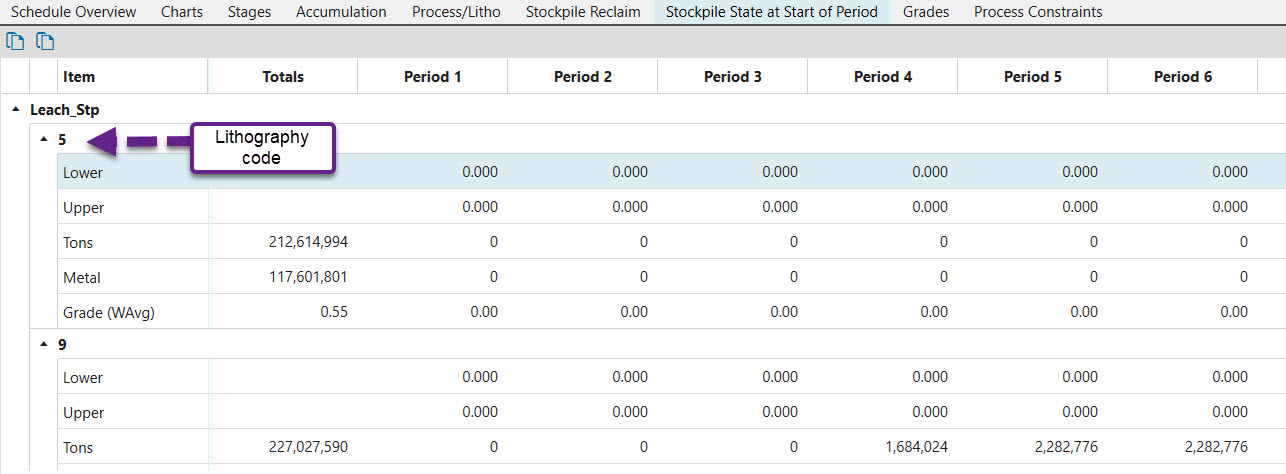
Stockpile State at Start of Period
For each stockpile, the amount of material available at the start of the period is displayed.
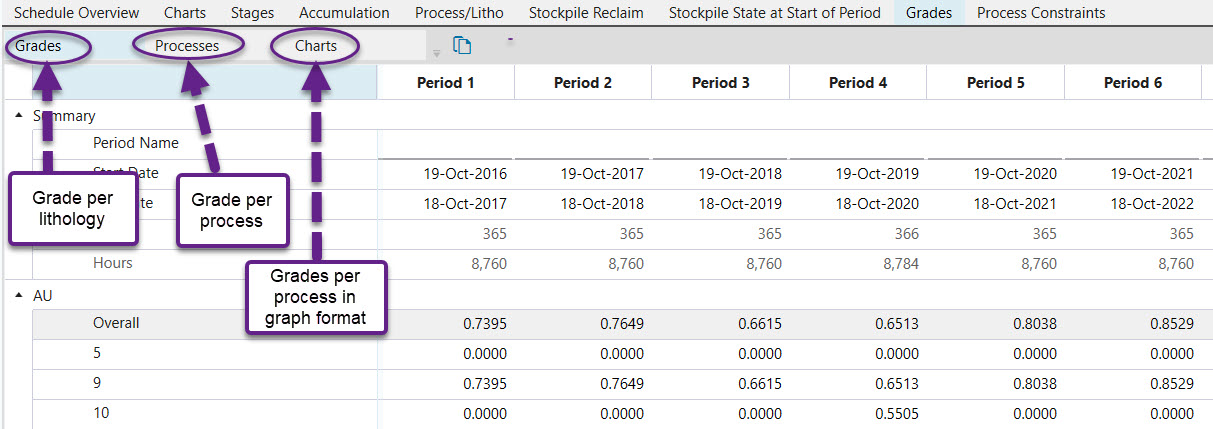
Grades
Grades can be viewed by lithology or by process for each period. Tabular and chart data is available.