Creating Trucks
Trucks are represented by 3D models in the viewer. Add trucks to your setup to simulate the transfer of material from one destination to another.
To add a new truck to the project:
-
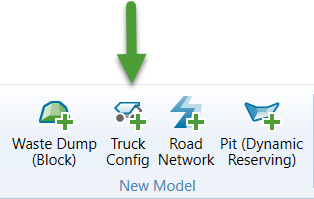
Click the
 Truck Config icon in the Ribbon Control menu under New Model.
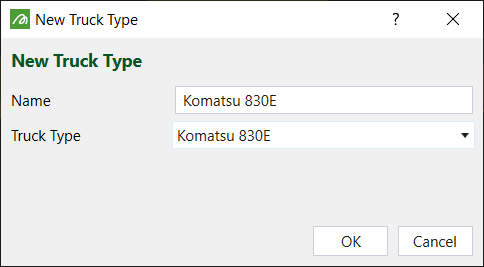
- Enter a Name and select a Truck Type from the drop-down list.
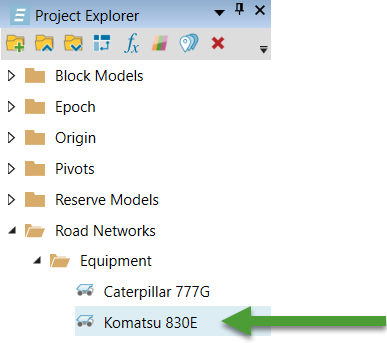
- The truck will be added to your project and stored in a configured folder under the project explorer.


You can now configure the truck by double-clicking on the truck in the project explorer, to view its settings in the Workspace. There are two sections to complete: the Truck Settings and the Engine Force Settings.

Truck Settings
Configure the following settings:
-
Weight Distribution Rear(%)
Enter the percentage of weight distributed on the rear axles. -
Actual truck payload
Enter the maximum amount of material in kilograms that a truck can carry from one destination to another. -
Empty truck weight
Note: The weight is indicated in kilograms.
-
Trolley fuel burn
Engine Force Settings
Each of the Engine Force Settings tabs contain a table and a graph. The graph is a reflection of the table, and cannot be edited directly.
-
To add rows to the table, select the row where you want to insert the new row and click
 .
. -
To delete a row in the table, select the row you want to delete and click
 .
. -
To import CSV data, click
 .
.
Configure the following Engine Force Settings tabs:
-
Rimpull Curve
Rimpull is the amount of force exerted at the point where the vehicle touches the road surface. The table and the graph show you the amount of rimpull at a particular speed that the vehicle is travelling.

-
Trolley Rimpull Curve
Rimpull is the amount of force exerted at the point where the vehicle touches the road surface. The table and the graph show you the amount of rimpull at a particular speed that the vehicle is travelling.
-
Retard Curve
The Retard Curve shows how much force it takes to break the vehicle as it touches the road surface at a given speed.

-
Fuel Consumption
The Fuel Consumption tab contains a table and a graph which display the effect of load variation on the fuel consumption of a truck.
