Use Live Charts
Evolution contains a feature called Live Charts for Strategy and Origin jobs, which allows you to view the results of a job as it is being processed.
To access this feature, complete the following steps:
-
Select the job in progress.
-
Open the result.
-
Select the Live Charts tab.
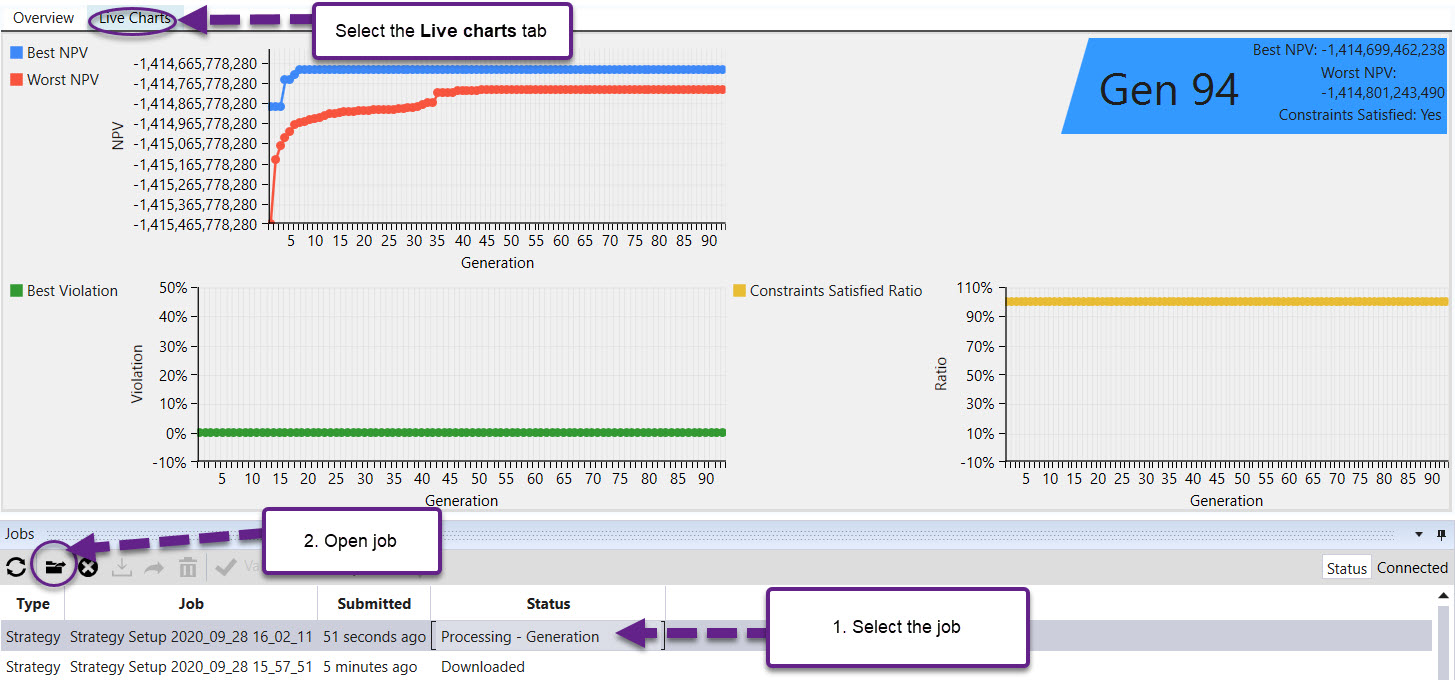
For strategy jobs, you will see three different charts: one showing best and worst NPV, one showing the percentage of violations that have occurred and a final graph showing the percentage of total constraints met.
For origin jobs, you will see a chart for both schedules generated. For each schedule, the ore tonnes, waste tonnes and haulage hours are displayed.
