4. Generate and View the Schedule
Source file: 4-epoch-schedules-generate-and-view.htm
After you have successfully validated your Epoch setup, you can generate and view your schedule. To generate a schedule, Epoch uses a client-side evaluator.
Note: Unlike Strategy and Origin, generating schedules in Epoch is deterministic, which produces the same outcome every time for the same setup configuration.
You can view your generated schedule in the viewer tab and gain a deeper understanding of the schedule using the Gantt view and the Live Dashboard.
Generating a schedule
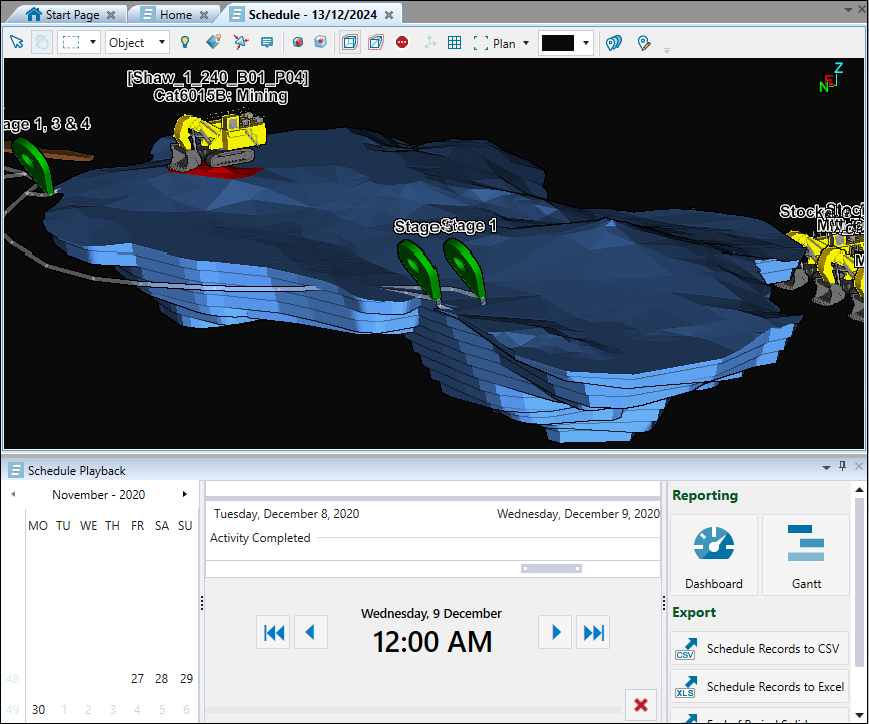
To generate a schedule for your Epoch setup, go to the ![]() Viewer and open the Schedule Playback tab.
Viewer and open the Schedule Playback tab.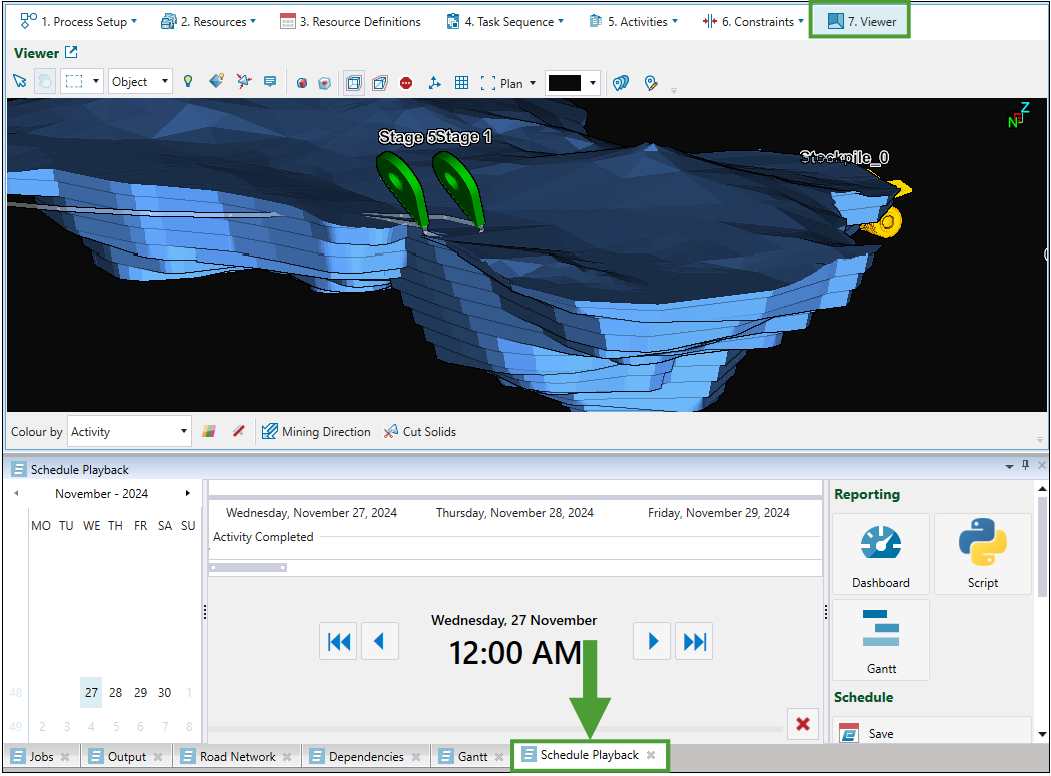
Your schedule will be generated as you step through it by clicking the ![]() (Step forward) button.
(Step forward) button.
Click the
 (Step to end) button to schedule until the end date of your setup.
Click the
 button to step back to the last scheduled period.
Click the
 button to step back to the first period of your setup.
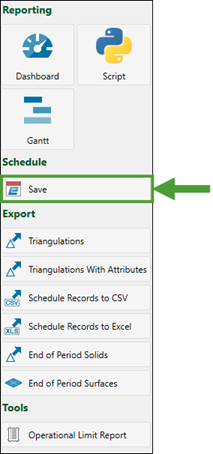
Saving and opening a schedule
Follow these steps to save the generated Epoch schedule:
-
In the Schedule Playback tab, click
 Save in the Schedule section on the right-hand side of the screen.
Note: Saving schedules is not supported for dynamic solids setups.
The Save Schedule panel will appear.
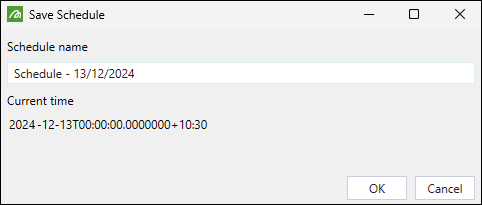
-
Enter the name for your schedule.
Note: The Current time section shows the date up to which you have scheduled your setup.
-
Click OK. Evolution will save your schedule in the project explorer, under the setup that corresponds to that schedule.
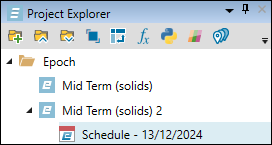
-
To open a saved schedule, double-click on it in the project explorer. Evolution will open your schedule in the workspace.
Tip: You can open and compare two schedules originating from a non-dynamic solids setup in your workspace. To do so, click Ctrl and select the required schedules in the project explorer. Next, right-click on them and select ![]() Compare Schedules from the context menu.
Compare Schedules from the context menu.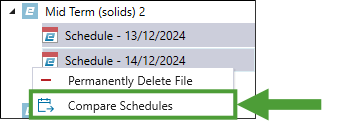
Evolution will open the selected schedules in the split view in your workspace.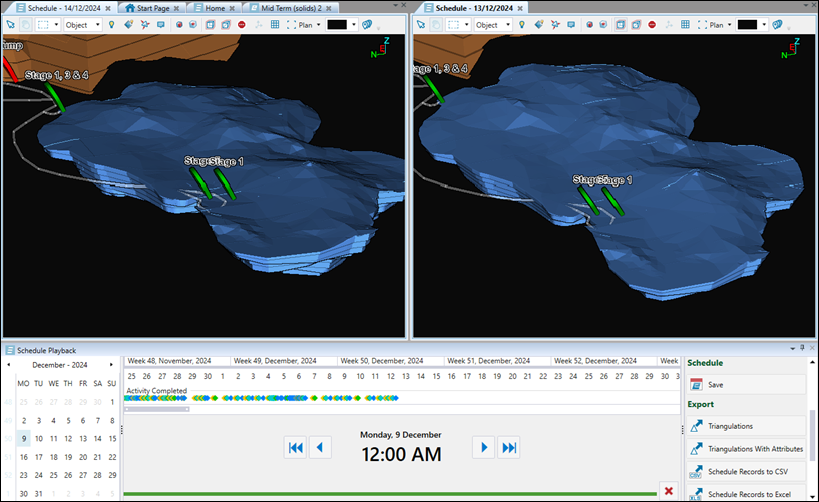
Viewing the schedule
Viewing the schedule allows you to review and analyse the activities and events it contains. To view the aspects of your schedule, use the following:
See the following for the information on customising the way your schedule is displayed and editing the settings:
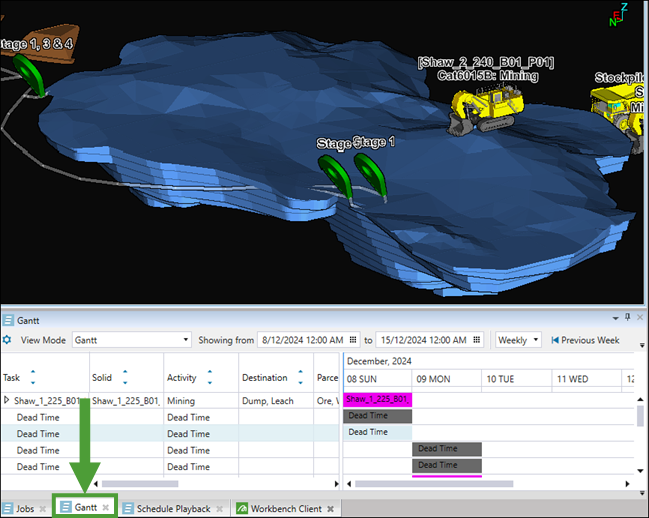
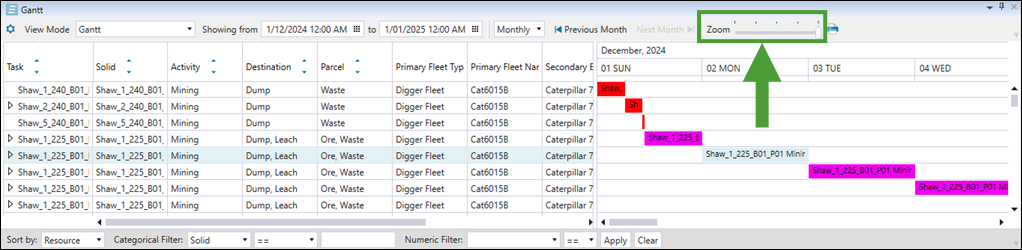
Gantt view
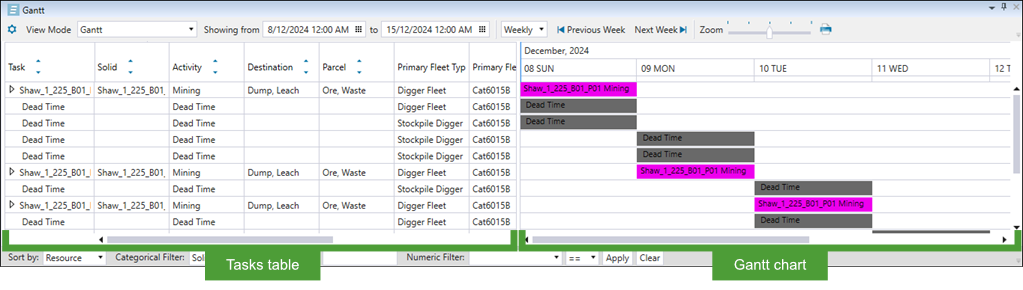
The Gantt view represents the data in the form of a table and a Gantt chart. The table details each task in the schedule and the Gantt chart displays the schedule.
You can open the Gantt view by doing either of the following:
-
Navigate to the viewer and select the Gantt tab at the bottom of the screen.
Or
-
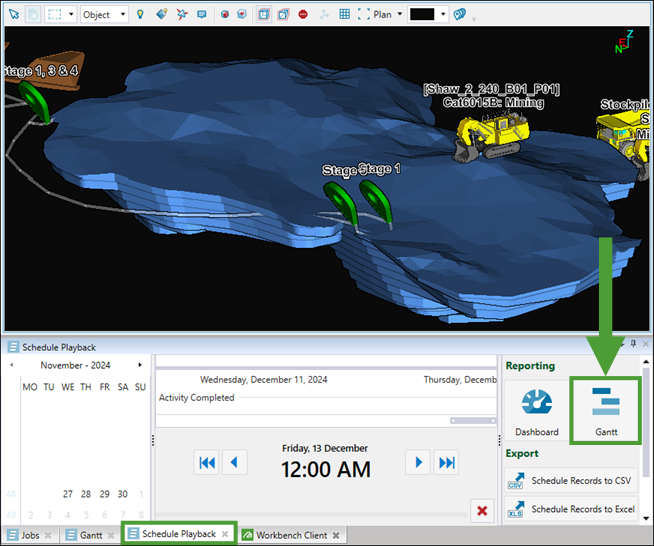
Navigate to the viewer, open the Schedule Playback tab, and select Gantt in the Reporting section.
Note: You can access the Gantt tab when viewing either a saved schedule or a generated schedule that you have not saved yet.
Analysing and navigating schedule data in the Gantt tab
The Gantt tab displays the following within the schedule:
-
Evaluated tasks. The evaluated tasks are the tasks which have occurred before the current time in the Schedule Playback tab. The term evaluated signifies that Evolution's evaluator has scheduled these tasks. For evaluated tasks, you can view the following:
- The time it takes to complete each task.
- The resources used to complete each task.
- The order in which the tasks are completed.
-
Non-evaluated tasks. The non-evaluated tasks are yet to occur with respect to the current time in the Schedule Playback tab. The term non-evaluated signifies that Evolution's evaluator has yet to process these tasks. Non-evaluated tasks have a default duration of 24 hours.
The ![]() buttons next to the tasks displayed in the table indicate the tasks are summary tasks. You can expand these summary tasks by clicking on the
buttons next to the tasks displayed in the table indicate the tasks are summary tasks. You can expand these summary tasks by clicking on the ![]() buttons.
buttons. 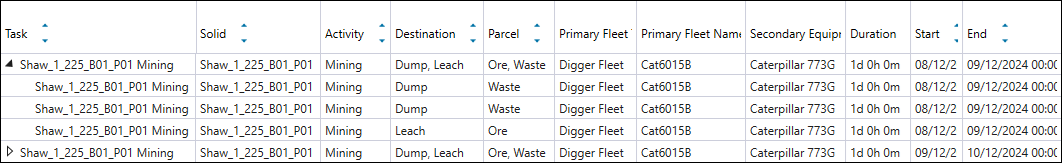
Epoch will display a child task for each parcel, destination, and equipment combination in your setup. For example, if two parcels were mined from a single solid, Epoch would display two child task entries.
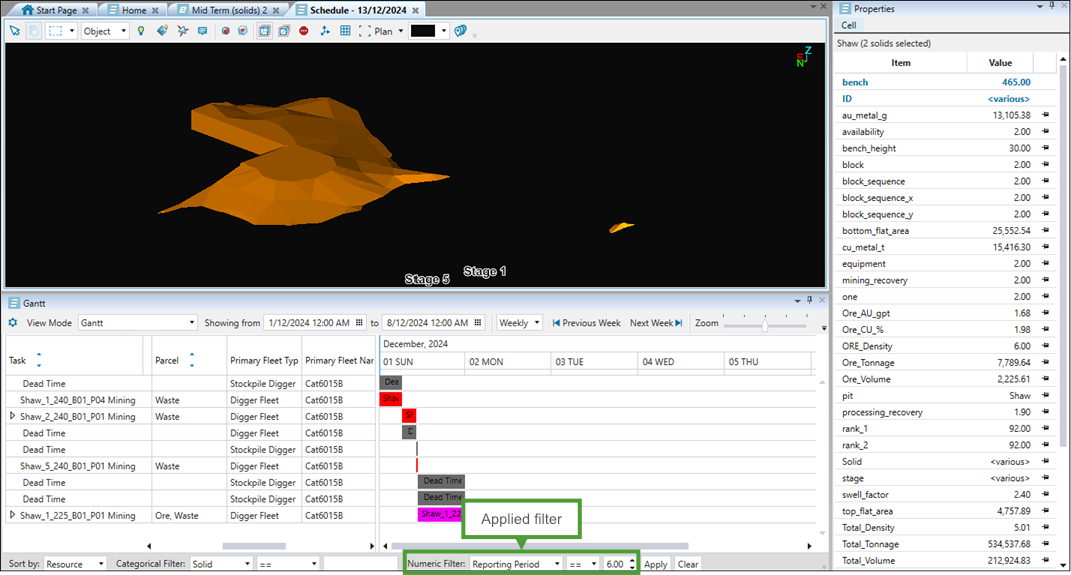
Use the following filters to limit the data displayed in the Gantt tab:
-
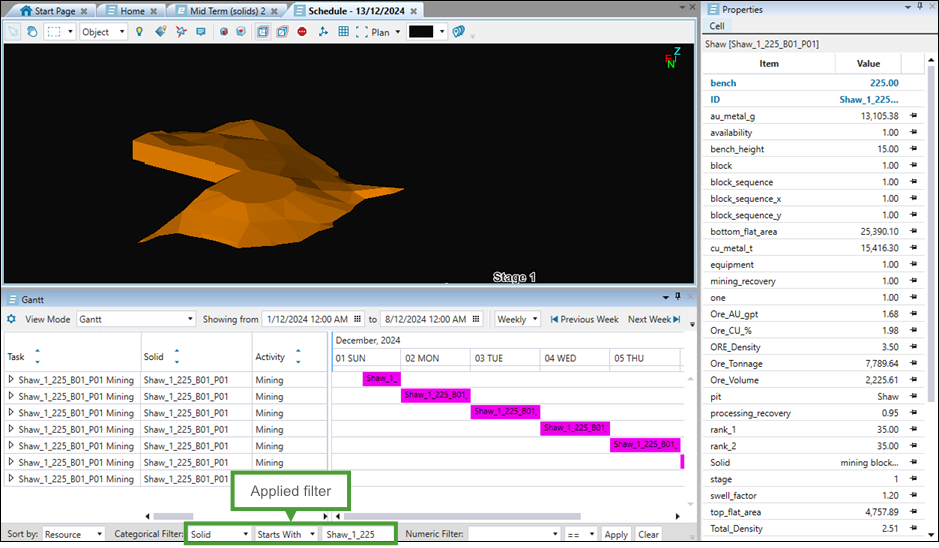
Categorical filter: Customise the view of your schedule by selecting the required category (Solids, Activity, or Primary Equipment Name) from the drop-down. You can further customise the filter by selecting one of the following relations from the drop-down:
-
== (Equal to)
-
!= (Not equal to)
-
Starts with
-
Ends with
-
Contains
Finish by specifying the name of the solid, activity, or primary equipment name for which you want the filter relation to be applied and click Apply.
Note: When you apply the categorical filter, Evolution will also filter the model in the viewer to display the solids related to the applied filter.
Example
-
-
Numeric Filter: Customise the view of your schedule by specifying the required time frames. The filter settings that you have to apply will depend on the point of time that you select from the drop-down, as follows:
-
For Start and End, select the desired date from the calendar. Next, choose the appropriate condition from the drop-down to define how the filter should apply:
-
== (Exactly the specified date)
-
!= (Any date other than the specified one)
-
> (Later than the specified date)
-
< (Earlier than the specified date)
-
>= (The specified date and later)
-
<= (The specified date and earlier)
-
-
For Duration, specify the exact duration of the task and choose the appropriate condition from the drop-down to define how the filter should apply:
- == (Exactly the specified duration)
-
!= (Any duration other than the specified one)
-
> (Longer than the specified duration)
-
< (Shorter than the specified duration)
-
>= (The specified duration and longer)
-
<= (The specified duration and shorter)
-
For Reporting Period, enter the reference number of reported periods (steps in your schedule) choose the appropriate condition from the drop-down to define how the filter should apply:
- == (Exactly the specified number of reporting periods)
-
!= (Any number of reporting periods other than the specified one)
-
> (Greater than the specified number of reporting periods)
-
< (Less than the specified number of reporting periods)
-
>= (Greater than or equal to the number of reporting periods)
-
<= (Less than or equal to the number of reporting periods)
Note: To confirm or change the duration of reporting periods in your setup, right-click on the setup in the project explorer and select
 Settings... from the context menu. See Editing a setup for more information.
Click Apply to enable the numeric filter settings in the Gantt view.
Note: When you apply the numeric filter, Evolution will also filter the model in the viewer to display the solids related to the applied filter.
Example
-
Click the Clear button to remove all Gantt filters you have applied.
-
You can also customise the way your data is displayed by setting the following:
-
Sort the displayed information by selecting either Resource or Time from the drop-down.

-
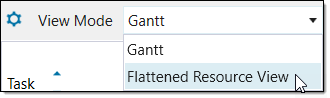
Change the view from Gantt (default setting) to the Flattened Resource View using the View Mode drop-down.
This flattened resource view mode contains an equipment-based timeline that displays the actions of each resource throughout the schedule.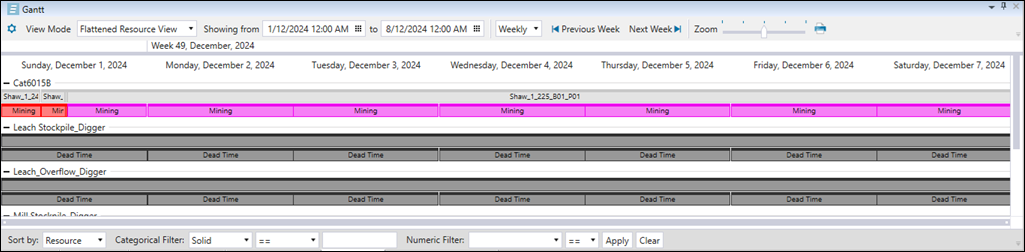
-
Specify the time interval to limit the amount of the displayed data by selecting Shift, Daily, Weekly, Monthly, or Yearly from the drop-down.
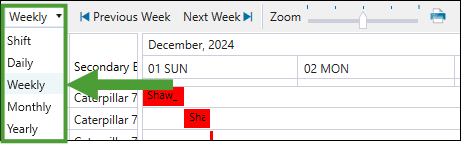
Note: When you specify the time interval, the names of the
 Previous <time interval> and
  Next <time interval> buttons will change accordingly.
 -
Set the specific date and time that you want to include in the Gantt view by selecting them in either the Showing from or To field. Adjacent dates will be displayed based on the time interval that you set.

-
Using the Zoom slider, set the size of task tiles displayed in the Gantt chart.
 Tip
Tip
Setting a smaller size will help you reduce the number of pages if you choose to print your schedule or save it on your machine. To print or save your schedule report as it is currently displayed in the Gantt tab, click the (Print report) button next to the Zoom slider. Next, select the required page orientation in the Gantt Chart Print Preview screen, click OK, and do either of the following:
Select the required printer from the drop-down and click Print.
Or
Select Print to PDF from the drop-down, click Print, specify the location where you want the report file to be saved and click Save.
Live Dashboard
To open and use a live dashboard, see Live Dashboard.
Partial solid cuts
The partial solid cutting feature allows you to view incremental mining progress within individual solids as you step through your Epoch schedule. This feature cuts solids based on the actual mining progress, which provides a more accurate and intuitive visual representation of your mining operations in each period. This can help you visualise how different accumulations (tonnage, volume, or grades) are extracted over time and also analyse the timing and sequence of mining activities.
Important: To use the partial solid cutting feature, you must set the ![]() (Hiding Completed Viewer Solids) option in the viewer. With this setting enabled, Evolution will automatically apply partial solid cutting to all pit solids.
(Hiding Completed Viewer Solids) option in the viewer. With this setting enabled, Evolution will automatically apply partial solid cutting to all pit solids.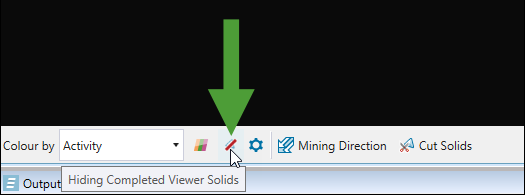
The visualisation of the partial solid cuts in your schedule will be different depending on the type of your pit models, as outlined below:
-
For standard solid pits, Evolution cuts pit solids proportionally along their mining direction by processing the parameters as follows:
-
Uses the mining direction from the first digger fleet to arrive in each solid.
-
Calculates the length of the mining direction that intersects with each solid.
-
Determines the proportion of the solid that has been mined.
-
Creates a perpendicular cut at the appropriate distance along the mining direction.
-
-
For dynamic solids pits, Evolution cuts pit solids based on the settings that you have applied, as follows:
-
If you have not enabled accumulation-based cutting, Evolution will cut solids proportionally along their mining direction, in the same way as standard solid pits.
-
If you have enabled accumulation-based cutting, Evolution will do the following to display partial cuts:
-
Access underlying block model attributes for precise material calculations.
-
Cut solids based on actual accumulation values (tonnage, volume, or custom accumulations).
-
Use the mining direction to determine cutting orientation.
-
This provides an accurate representation of material extraction patterns.
-
Note: Partial cutting uses the mining direction assigned to each solid to determine cutting orientation. All mining directions default to north, unless you have customised the configuration. If you have specified custom directions, Evolution will use the first mining direction defined for that solid and the first direction from the first digger fleet to arrive for that solid. If you have assigned multiple directions for the same fleet-solid combination, only the first assigned direction will be used. For more information on configuring mining directions, see Mining Direction.
To enable accumulation-based cutting, proceed as follows:
-
Go to the
 Viewer tab and click the
  button in the bottom toolbar.
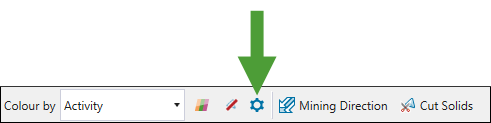
Note: This button is provided only in setups containing dynamic solids models. For more information on dynamic solids, see Dynamic Solids Pits.
The Evaluator Settings panel will appear.
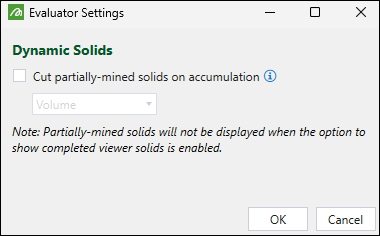
-
Select the Cut partially-mined solids on accumulation checkbox.
-
Using the drop-down, select the accumulation type based on which the partially-mined solids will be cut.
Note: The accumulation types listed in the drop-down correspond to the categories you have configured for your setup, and include Volume, Tonnage, and any custom accumulations you have configured in the
 Parcel Reporting subtab. See Parcel Reporting in dynamic solids setups for more information.
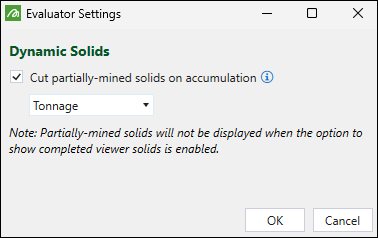
Click OK to apply the settings.
Evolution will cut the partially mined solids based on the selected accumulation type as you step through your schedule.
Customising the schedule view
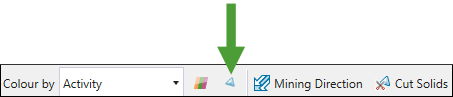
You can customise the schedule view using the following settings from the bottom toolbar in the viewer:
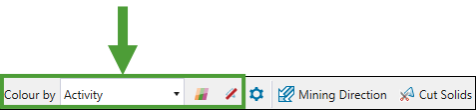
Colour by
The Colour by drop-down allows you to customise the criteria used to colour the solids. You can select from the following:
-
Activity. Colour the solids according to the activity that has been performed on them.
Note: This is the default setting.
-
Period. Colour the solids according to the period the solids were mined in.
-
Primary Equipment. Colour the solids according to the primary equipment that Evolution has selected to use.
Note: Primary equipment includes diggers, drills, and custom equipment.
-
Secondary Equipment. Colour the solids according to the secondary equipment that is selected for use.
Note: Secondary equipment refers to trucks.
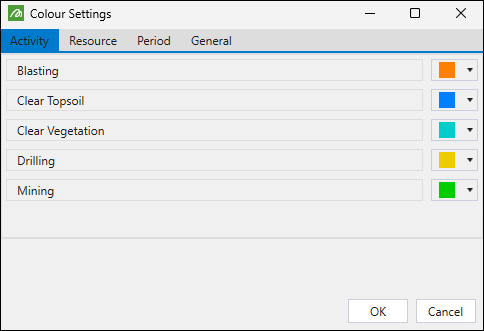
Colour Settings
The ![]() (Colour Settings) tool allows you to apply the selected colours to solids corresponding to each activity, resource, and period of your schedule.
(Colour Settings) tool allows you to apply the selected colours to solids corresponding to each activity, resource, and period of your schedule.
When you click ![]() (Colour Settings), the Colour Settings panel containing four tabs (Activity, Resource, Period, and General) will appear. Apply the required colours as follows:
(Colour Settings), the Colour Settings panel containing four tabs (Activity, Resource, Period, and General) will appear. Apply the required colours as follows:
-
Activity tab. Select the required colour from the colour picker for each activity. When you step through the schedule, Epoch will highlight the solid using the selected colours.
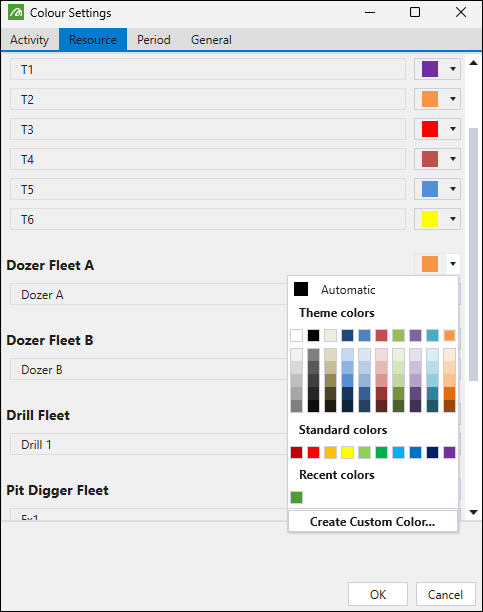
-
Resource tab. Select the required colour from the colour picker for each resource. When you step through the schedule, Epoch will highlight the solid using the selected colours.
Note: You can select the same colour for the whole fleet or apply different colours for each resource constituting the fleet.
-
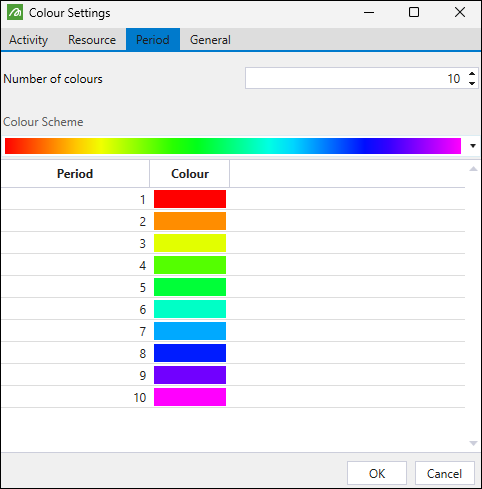
Period tab. Enter the required value into the Number of colours field and select the colour scheme. When you step through the schedule, Evolution will colour the solids according to the period that is mined, based on the selected colour scheme.
-
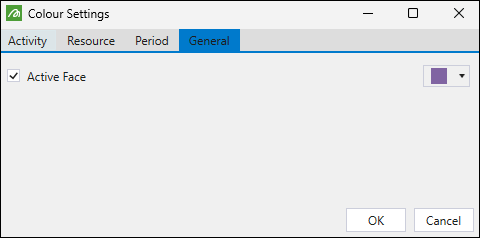
General tab. Select the required colour from the colour picker for the Active Face. When you step through the schedule, Epoch will colour the current solid being mined according to the selected colour.
When you finish applying the required colour settings, click OK.
Showing and hiding completed viewer solids
-
Toggle the
 button to show all completed solids in the viewer.
 -
Toggle the
 button to hide the completed solids in the viewer.
Changing the reporting time
For steps on changing the reporting periods, see Editing a setup.
