5. View the Schedule
Source file: 5-origin-solids-schedule-view.htm
Once you have downloaded your schedule, you can analyse the results using pivot reports. See Pivot Reporting for more information.
-
Right-click on the parent schedule in the project explorer and select
 Open to enter the schedule animation in the viewer.
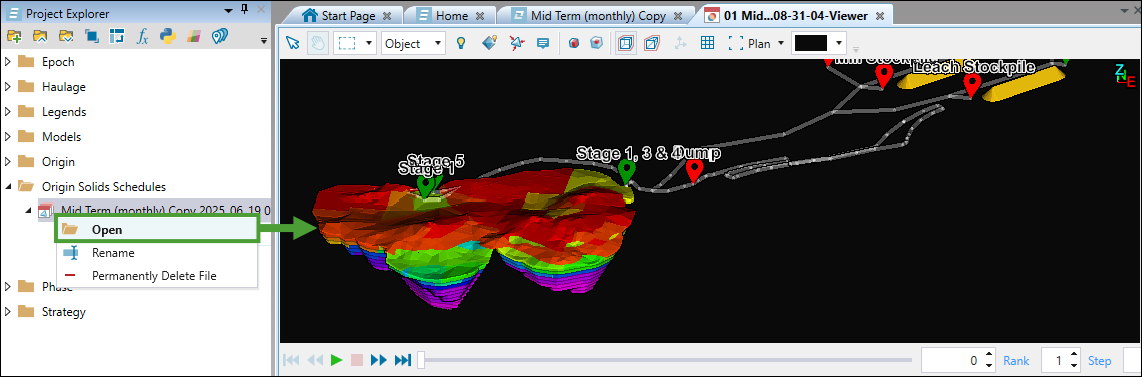
-
Right-click on the schedule in the project explorer and select
 Open Schedule Report to see an overview of your schedule results.
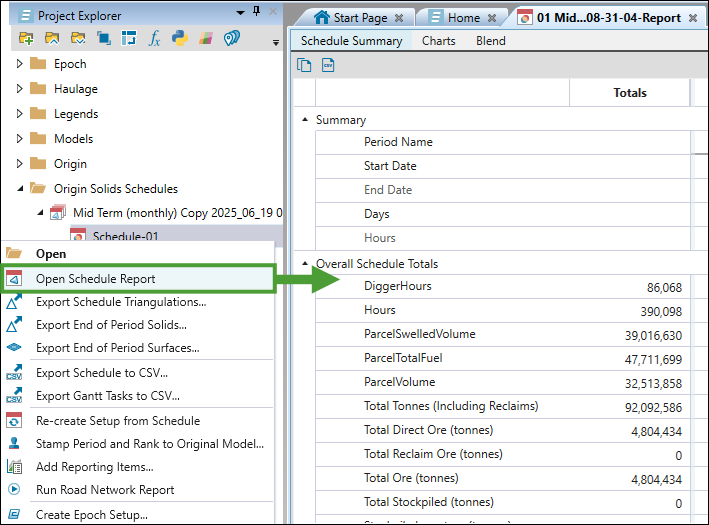
If you would like to export the data and analyse it externally, Evolution also provides a number of export tools for Origin Solids schedules. These tools are:
You can also generate a report summarising the road network data in your Equipment schedule. See Run Road Network Report for more information.
See also: Stamp Period and Rank to Original Model
To open any of the above tools, right-click on the schedule in the project explorer and select the required tool from the context menu.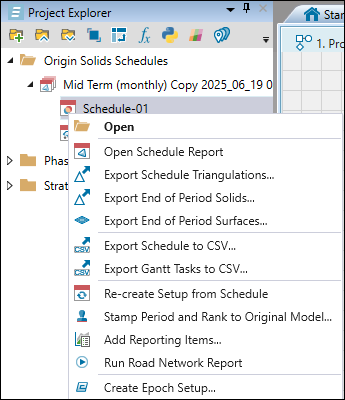
Tip: To see the fitness chart that shows the degree of violation of your setup objectives in each period, double-click the parent schedule in the project explorer. Evolution will open Schedule Fitness Summary in the new window.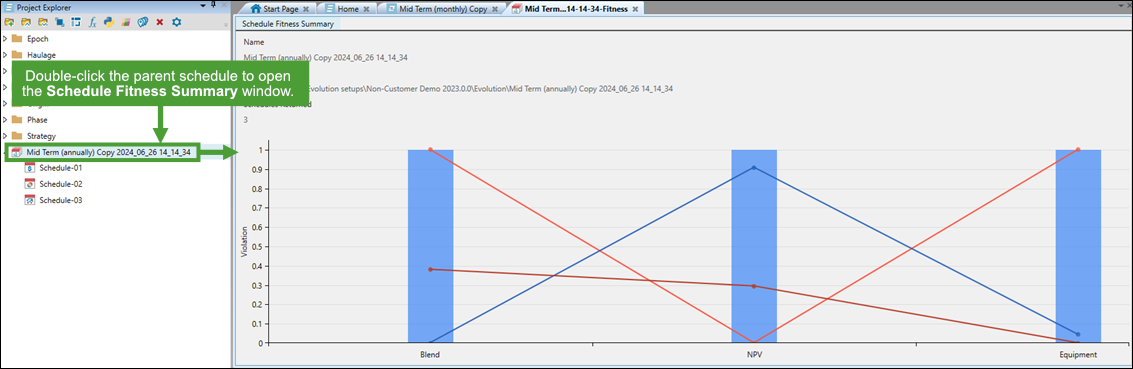
Export Schedule Triangulations
Follow these steps to export the pit and waste triangulations of an Origin Solids schedule:
-
Right-click on a schedule report in the project explorer and select
 Export Schedule Triangulations... from the context menu.
 -
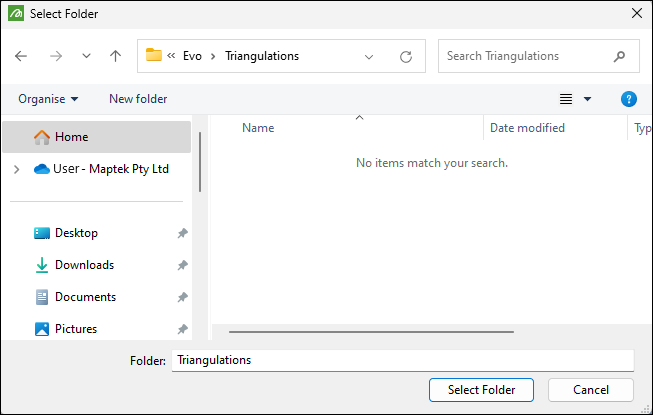
In the Select Folder dialog, select a folder to save the triangulations in and click Select Folder.
Once the export is complete, Evolution will inform you about it by displaying a toast notification at the bottom of your screen.

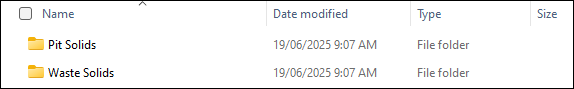
The exported triangulations are categorised into Pit Solids and Waste Solids folders.
In these folders, each triangulation name contains its period and rank. In the image below, the pit triangulation has a period (P) of one and a rank (R) of two.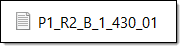
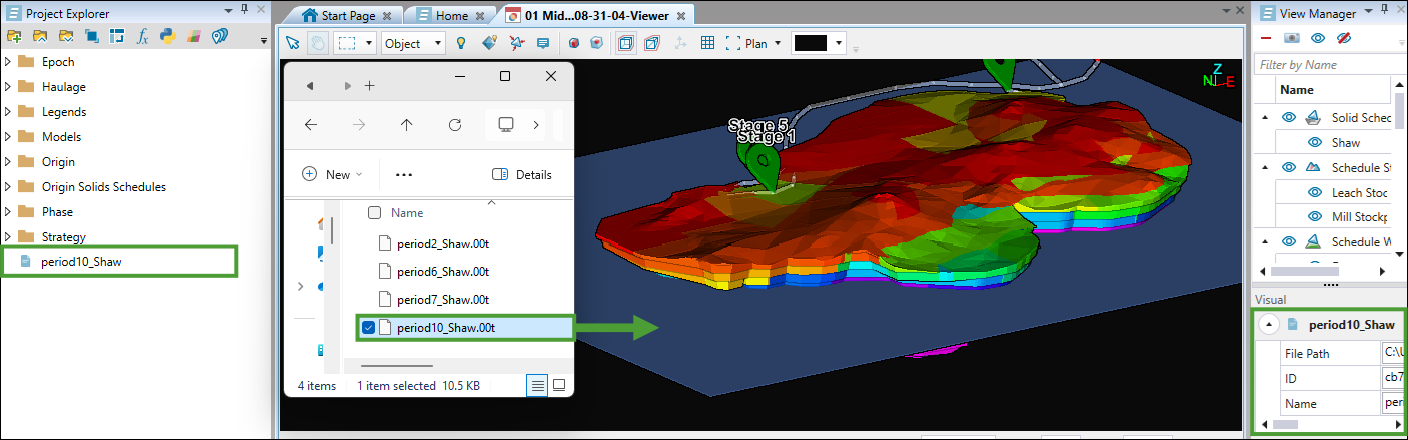
To view these individual triangulation files in your model, follow these steps:
-
Open the file explorer and navigate to the folder that contains your exported pit or waste solid triangulations.
-
Open the required model in the viewer.
-
Drag and drop the required triangulations into the viewer.
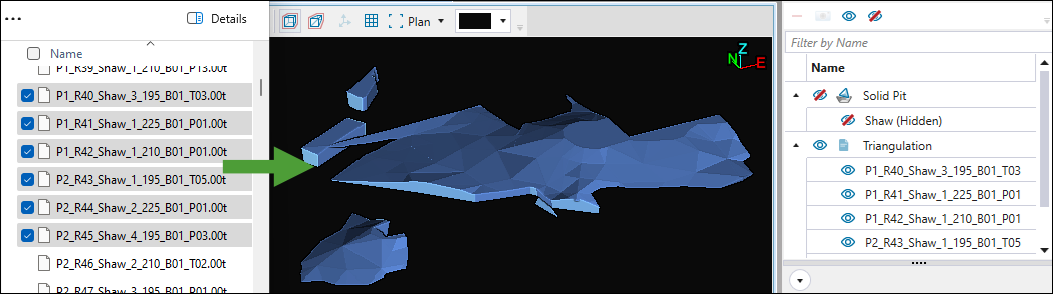
The triangulations will appear in the correct area relative to the model in the viewer.
Export End of Period Solids
Evolution allows you to export end of period solids to create an updated topography in Vulcan.
Follow these steps to export end of period solids:
-
Right-click on the schedule in the project explorer and select
Export End of Period Solids....Alternatively, double-click a schedule in the project explorer to open it in the viewer and click
(Export end of period solids) in the schedule viewer toolbar.
-
In the Select Models panel, select the models for which you want the end-of-period solids to be exported and click Next.
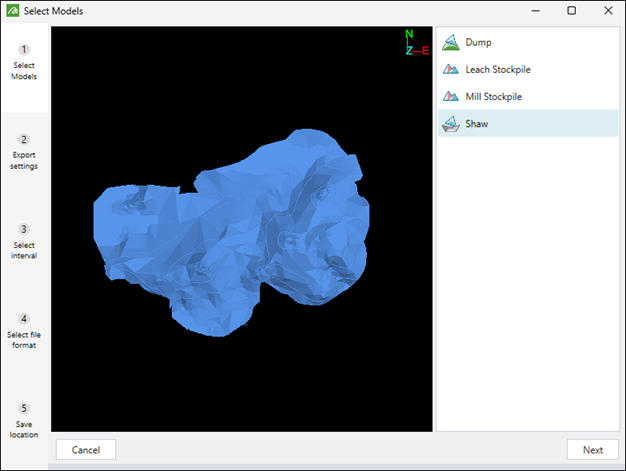
Tip: Press and hold Ctrl to select multiple models.
-
Choose the solids to export by selecting one of the following radio buttons:
-
Completed. Depending on the models you have selected in the previous step, the following solids will be exported:
-
The pit solids that have been completely or partially mined out.
Note: If a pit solid has been partially mined, Evolution will export the mined proportion of that solid.
-
The current proportion of waste utility solids that have been filled.
-
The current proportion of stockpile solids that have been filled.
-
-
Remaining. Depending on the models you have selected in the previous step, the following solids will be exported:
-
The proportion of pit solids that have not been mined out.
-
The current proportion of waste utility solids that are empty.
-
The current proportion of stockpile solids that are empty.
-
-
Per-Period. Depending on the models you have selected in the previous step, the following solids will be exported:
-
The pit solids mined during selected periods.
-
The fill state of waste utility solids at the end of selected periods.
-
The fill state of stockpile solids at the end of selected periods.
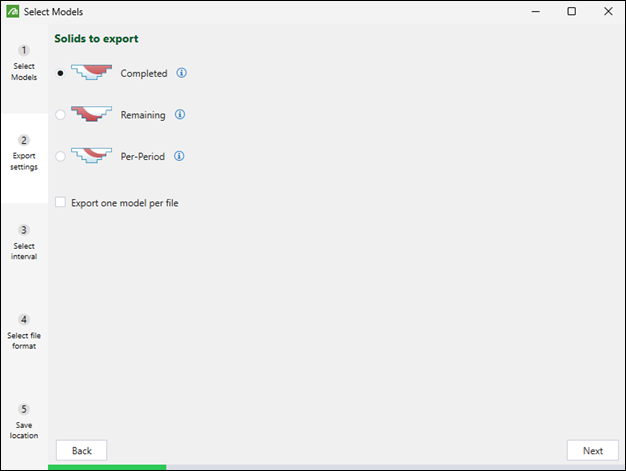
Tip: Optionally, select the Export one model per file checkbox to export a separate file for each selected model. This checkbox will appear only if you have selected more than one model in the previous step.
-
Click Next to move on to the subsequent step.
-
-
Select the time intervals to export. The available options will depend on the solids you have selected to export in the previous step, as follows:
-
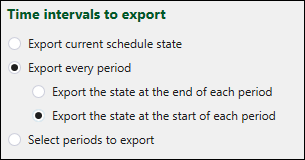
If you have selected the Completed or Remaining solids, specify the time intervals by selecting one of the following buttons:
-
Export current schedule state: Export the current state of solids from your schedule.
Note: This option is only available if you have accessed the Export End of Period Solids workflow from an open schedule. It is not available when you open the workflow by right-clicking on a schedule in the project explorer.
-
Export every period: Include the state of solids from all periods in the export.
Note: When you select this option, you must also specify the point of time for which you want the solids to be exported by selecting either the Export the state at the end of each period or Export the state at the start of each period radio button.
-
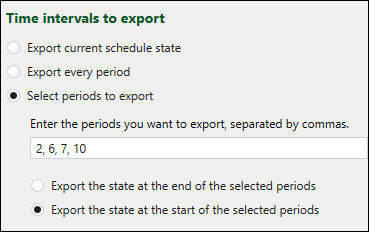
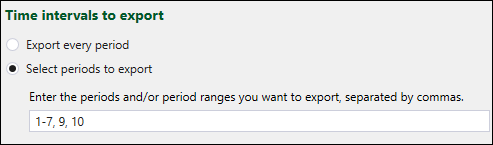
Select periods to export: Specify the periods from which you want to export the solids by entering them in the field, separated by commas.
Note: When you select this option, you need to additionally specify the point of time for which you want the solids to be exported by selecting either the Export the state at the end of the selected periods or Export the state at the start of the selected periods radio button.
-
-
If you have selected the Per-Period export in the previous step, you can select one of the following radio buttons:
-
Export every period. Exports one triangulation file for each period in the schedule, each containing all solids mined during that specific period.
-
Select periods to export. Specify the periods from which you want to export the solids by entering them in the field, separated by commas. You can also specify the period ranges to be exported.
Note: The specified range will be exported as a single solid.
-
Click Next to move on to the subsequent step.
-
-
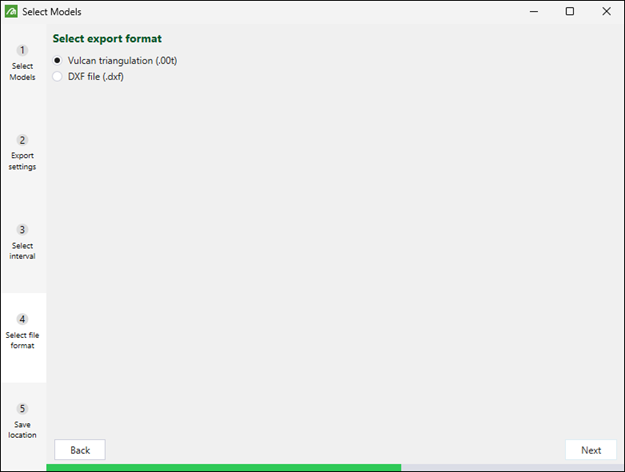
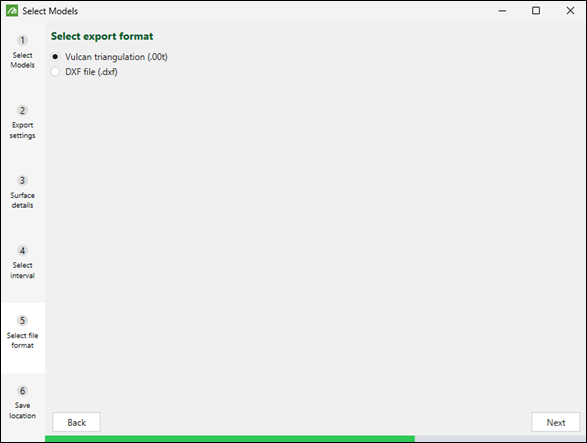
Select the file format in which you want the solids to be exported and click Next.
-
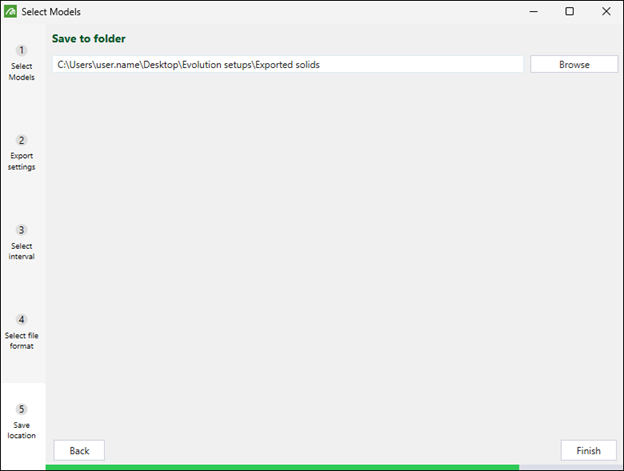
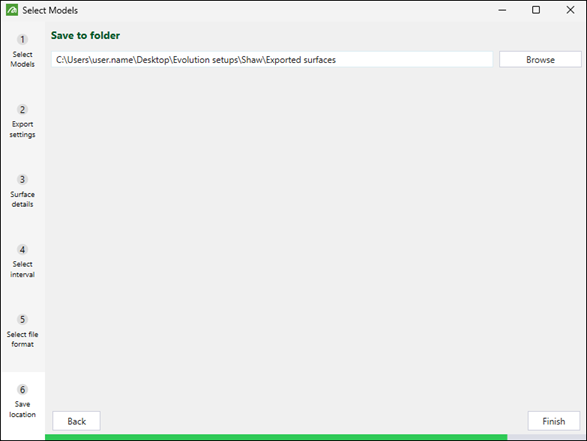
Click Browse to specify the folder in which you want the files to be saved, then click Finish to confirm the export of solids.
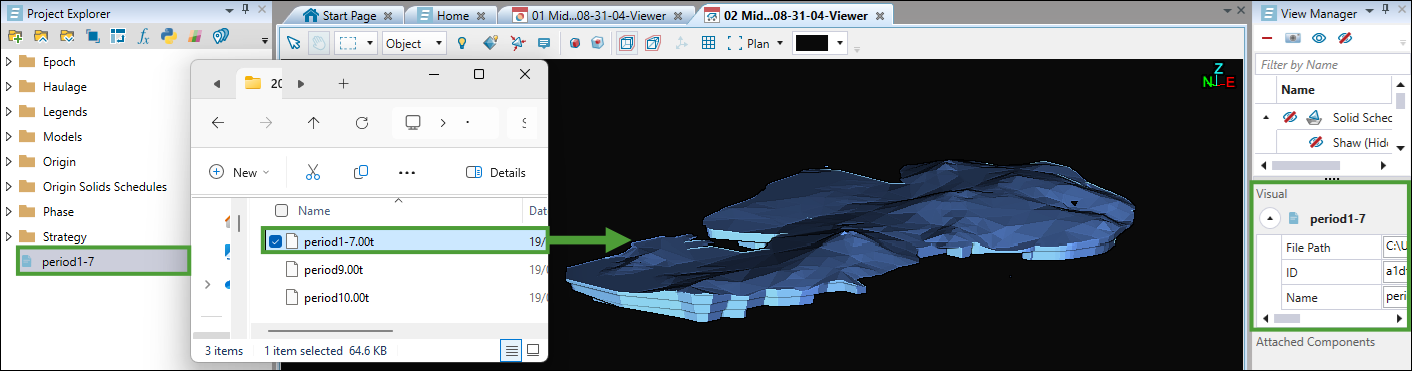
When the export is complete, you can drag the exported solids into the viewer to examine the state of your model in each period.Note: The solids that you apply to the viewer will be added to the project explorer and also to the View Manager.
Export End of Period Surfaces
Evolution allows you to export end of period surfaces to create an updated topography in Vulcan.
To export end-of-period surfaces, follow these steps:
-
Right-click on the schedule in the project explorer and select
 Export End of Period Surfaces....
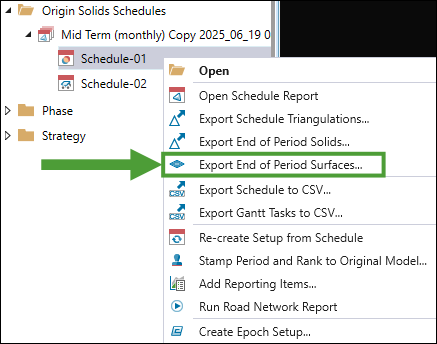
Alternatively, double-click a schedule in the project explorer to open it in the viewer and click
(Export end of period surfaces) in the schedule viewer toolbar.
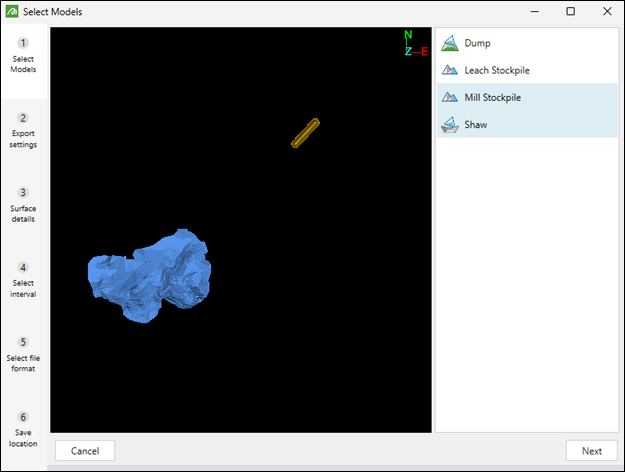
-
Select the models for which you want the end-of-period surfaces to be exported and click Next.
-
Choose the surface type to export by selecting one of the following radio buttons:
-
Custom topography. Use a custom Vulcan triangulation file (
.00t) or an AutoCAD DXF file (.dxf) as the surface topography. -
Flat plane. Select to use a horizontal, rectangular plane as the surface topography.
Tip
Optionally, select the following checkboxes to customise the exported files:Ignore surface undercuts: Enable this option for Evolution to ignore undercuts in surfaces, which will result in faster calculations. Leaving this checkbox unselected will result in more precise calculations, though they will take longer to complete.
Export one model per file: A separate file will be exported for each selected model. This checkbox will appear only if you have selected more than one model in the previous step.
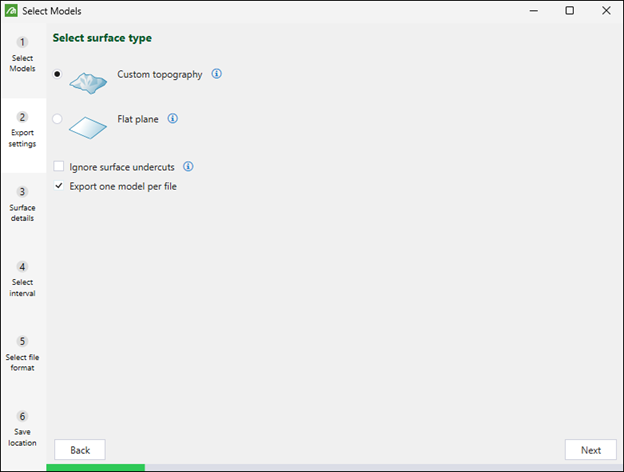
Click Next to move on to the subsequent step.
-
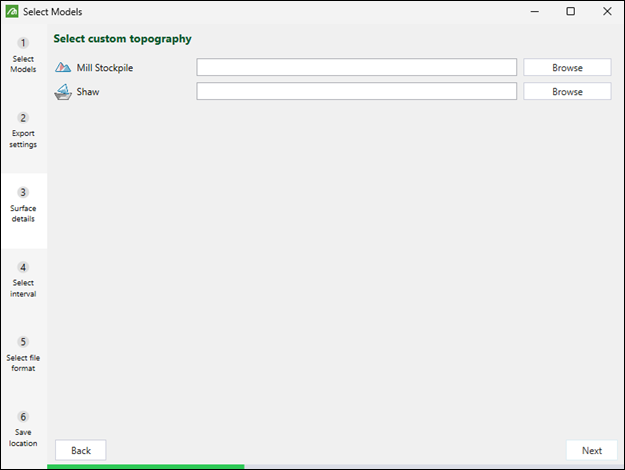
-
Enter the required surface details. The data that you must provide in this step will depend on the surface type you have chosen in the previous step, as follows:
-
If you have chosen Custom topography, browse to select a custom Vulcan triangulation file (
.00t) or an AutoCAD DXF file (.dxf) to be used as the surface topography for each selected model.Note: If you did not choose to export one model per file in the previous step, you will only need to select one surface for the entire export.
-
If you have chosen Flat plane, adjust the height of the surface plane as follows:
-
If you selected to export one model per file in the previous step, drag the slider to adjust the height of the surface plane for each selected model.
-
If you are exporting all models as one surface, drag the slider to set the same height of the surface plane for all selected models.
-
Click Next to move on to the subsequent step.
-
-
Choose the time intervals to export by selecting one of the following radio buttons:
-
Export current schedule state: Export the surfaces using the current state of your schedule.
Note: This option is only available if you have accessed the Export End of Period Surfaces workflow from an open schedule. It is not available when you open the workflow by right-clicking on a schedule in the project explorer.
-
Export every period: Include the state of surfaces from all periods in the export.
Note: When you select this option, you must also specify the point of time for which you want to export the surfaces by selecting either the Export the state at the end of each period or Export the state at the start of each period radio button.
-
Select periods to export: Specify the periods from which you want to export the surfaces by entering them in the field, separated by commas.
Note: When you select this option, you must also specify the point of time for which you want the surfaces to be exported by selecting either the Export the state at the end of the selected periods or Export the state at the start of the selected periods radio button.
Click Next to move on to the subsequent step.
-
-
Select the file format in which you want to export the surfaces and click Next.
-
Click Browse to specify the folder in which you want the files to be saved, then click Finish to confirm the export of the surfaces.
When the export is complete, you can drag the exported surfaces into the viewer to confirm the export of the surfaces.
Note: The surface that you apply to the viewer will be added to the project explorer and also to the View Manager.
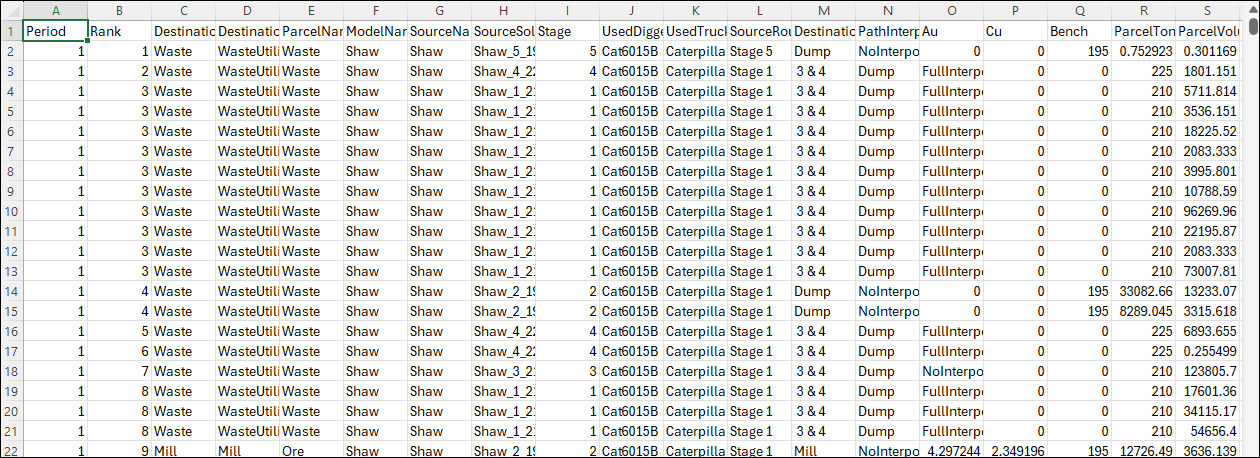
Export Schedule to CSV
Follow these steps to export your schedule to a CSV file:
- Right-click on the schedule report in the project explorer and select
 Export Schedule to CSV... from the context menu.
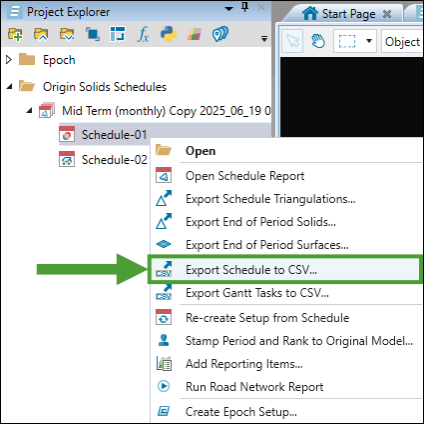
- Choose the location to save the file, specify the file name, and click Save. The file will be saved in the following format:
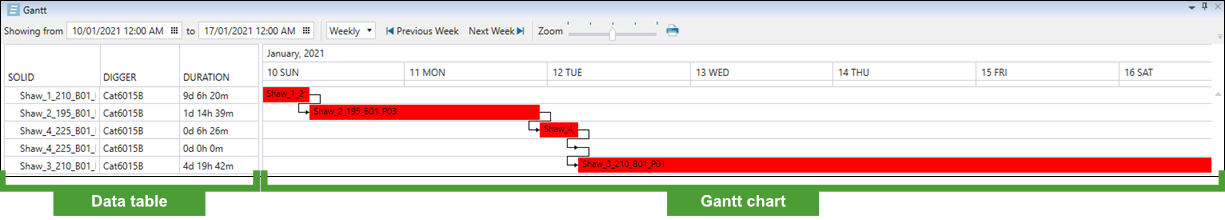
Export Gantt Tasks to CSV
The Gantt view represents data in the form of a table and a Gantt chart. The table details each solid, digger, and how long the related digger has worked on the given solid, while the Gantt chart displays the schedule.
-
Set the specific date and time that you want to include in the Gantt view by selecting them in either the Showing from or To field. Adjacent dates will be displayed based on the time interval that you set.

-
Specify the time interval to limit the amount of the displayed data by selecting Daily, Weekly, Monthly, or Yearly from the drop-down.
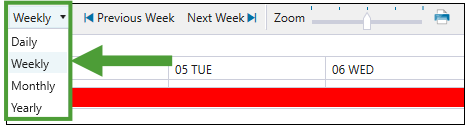
Note: When you specify the time interval, the names of the
 Previous <time interval> and
  Next <time interval> buttons will change accordingly.
 -
Using the Zoom slider, set the size of task tiles displayed in the Gantt chart.
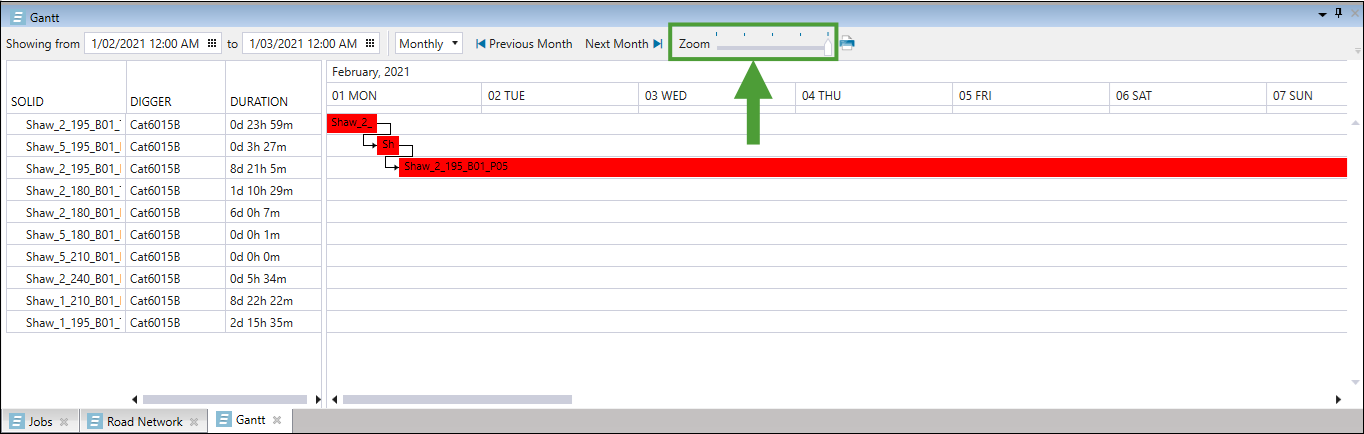 Tip
Tip
Setting a smaller size will help you reduce the number of pages if you choose to print your schedule or save it on your machine. To print or save your schedule report as it is currently displayed in the Gantt tab, click the (Print report) button next to the Zoom slider. Next, select the required page orientation in the Gantt Chart Print Preview screen, click OK, and do either of the following:
Select the required printer from the drop-down and click Print.
Or
Select Print to PDF from the drop-down, click Print, specify the location where you want the report file to be saved and click Save.
Exporting tasks into a Gantt chart allows you to analyse the mining sequence of your schedule based on a chart where each Gantt task represents one solid being mined. You can find the Gantt tab at the bottom of the viewer panel.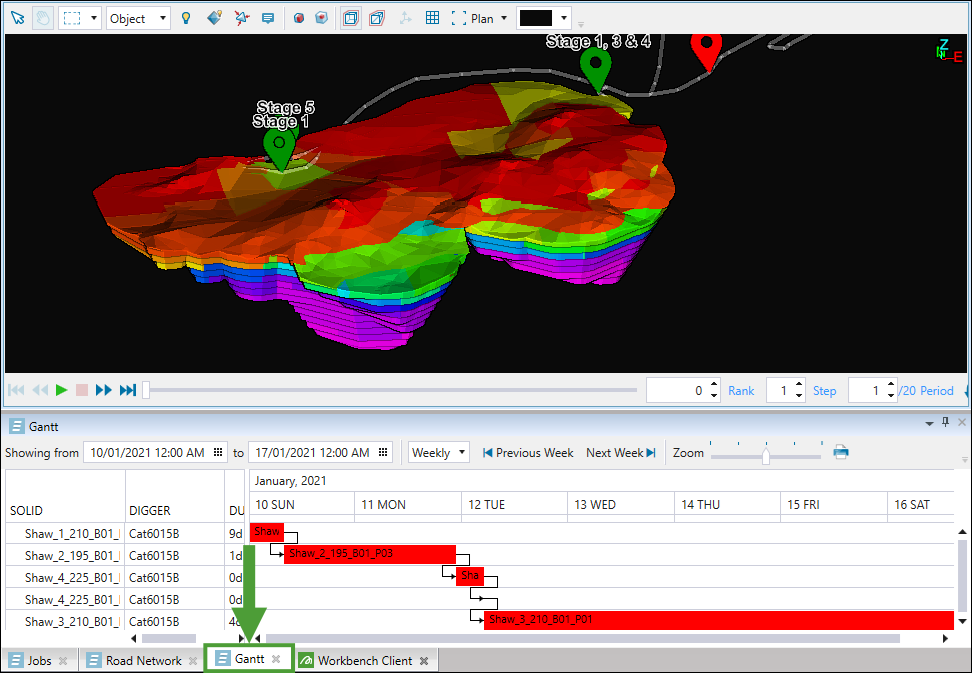
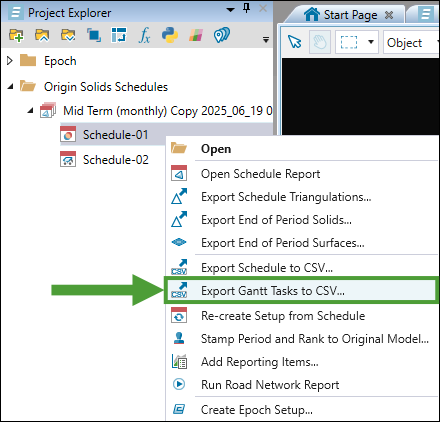
To export Gantt tasks to a CSV file, follow these steps:
- Right-click on the schedule report in the project explorer and select Export Gantt Tasks to CSV... from the context menu.
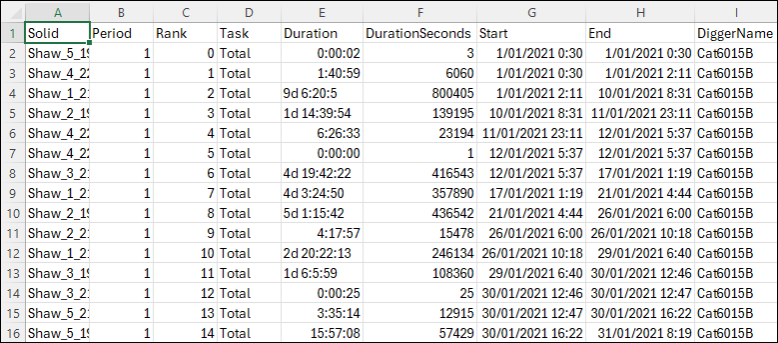
- Choose the location to save the file, specify the file name, and click Save. The file will be saved in the following format:
Run Road Network Report
A road network report summarises the time and distances travelled on each bench in a mined pit.
Note: The road network report can only be generated for Equipment setups.
To generate a road network report, right-click on a schedule in the project explorer and select ![]() Run Road Network Report. The report containing road network summary will appear in your workspace as follows:
Run Road Network Report. The report containing road network summary will appear in your workspace as follows:
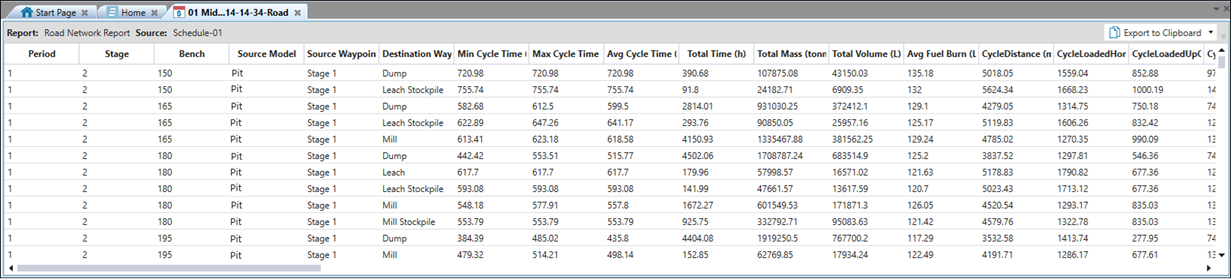
Each row of the report describes all trips required to transport material from every solid that has the following characteristics:
-
Is mined in a certain period.
-
Belongs to a certain pit, stage, and bench.
-
Goes through a certain source waypoint and is delivered to a destination waypoint.
The total distance travelled over a single round trip is referred to as the CycleDistance. The trip is divided into a series of road segments. The total distance travelled to move a solid from a source waypoint to a destination waypoint is called the CycleLoadedDistance.
For each road segment, there is a MeasuredDistance, which is the actual distance the truck has travelled. MeasuredDistances can be categorised as:
-
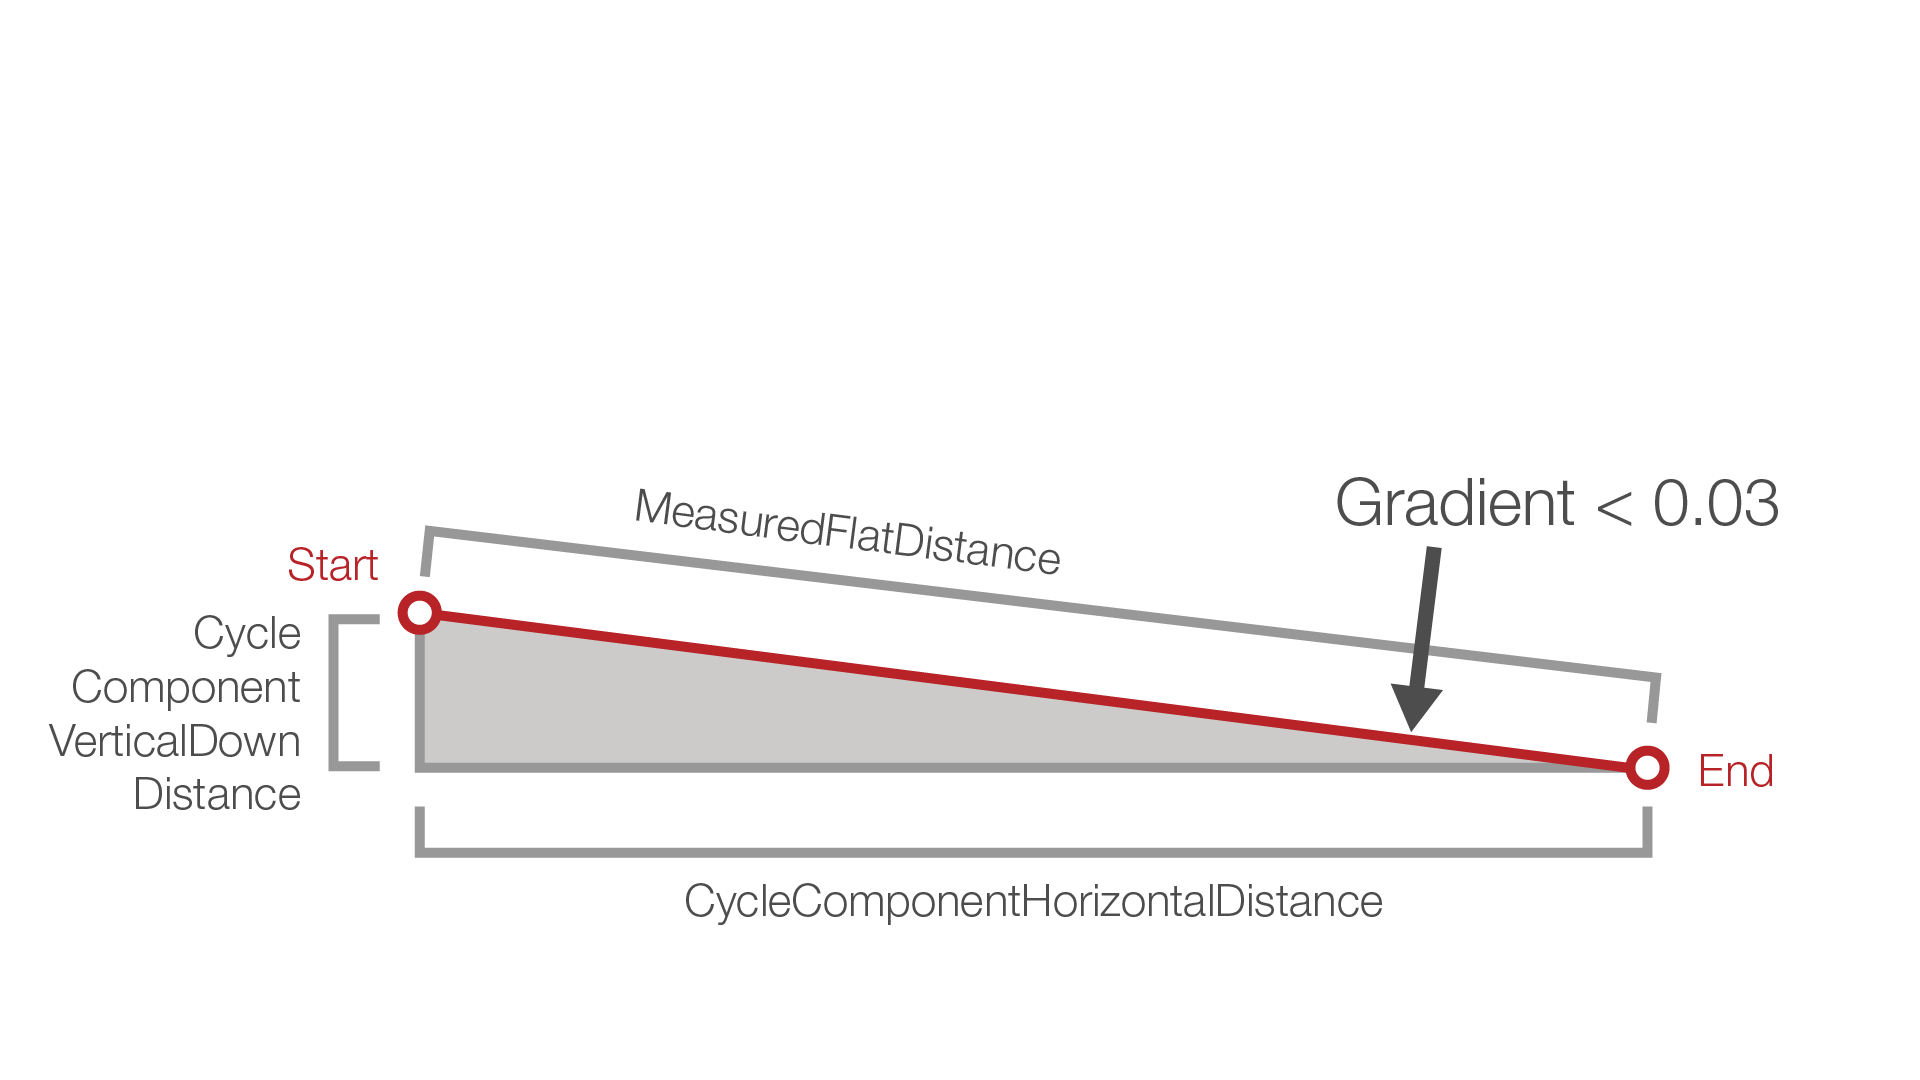
MeasuredFlat: A road is classified as MeasuredFlat if the road segment has a gradient of less than that specified in the
 Equipment tab >
  Advanced Options subtab > Horizontal Gradient (%) field.
 -
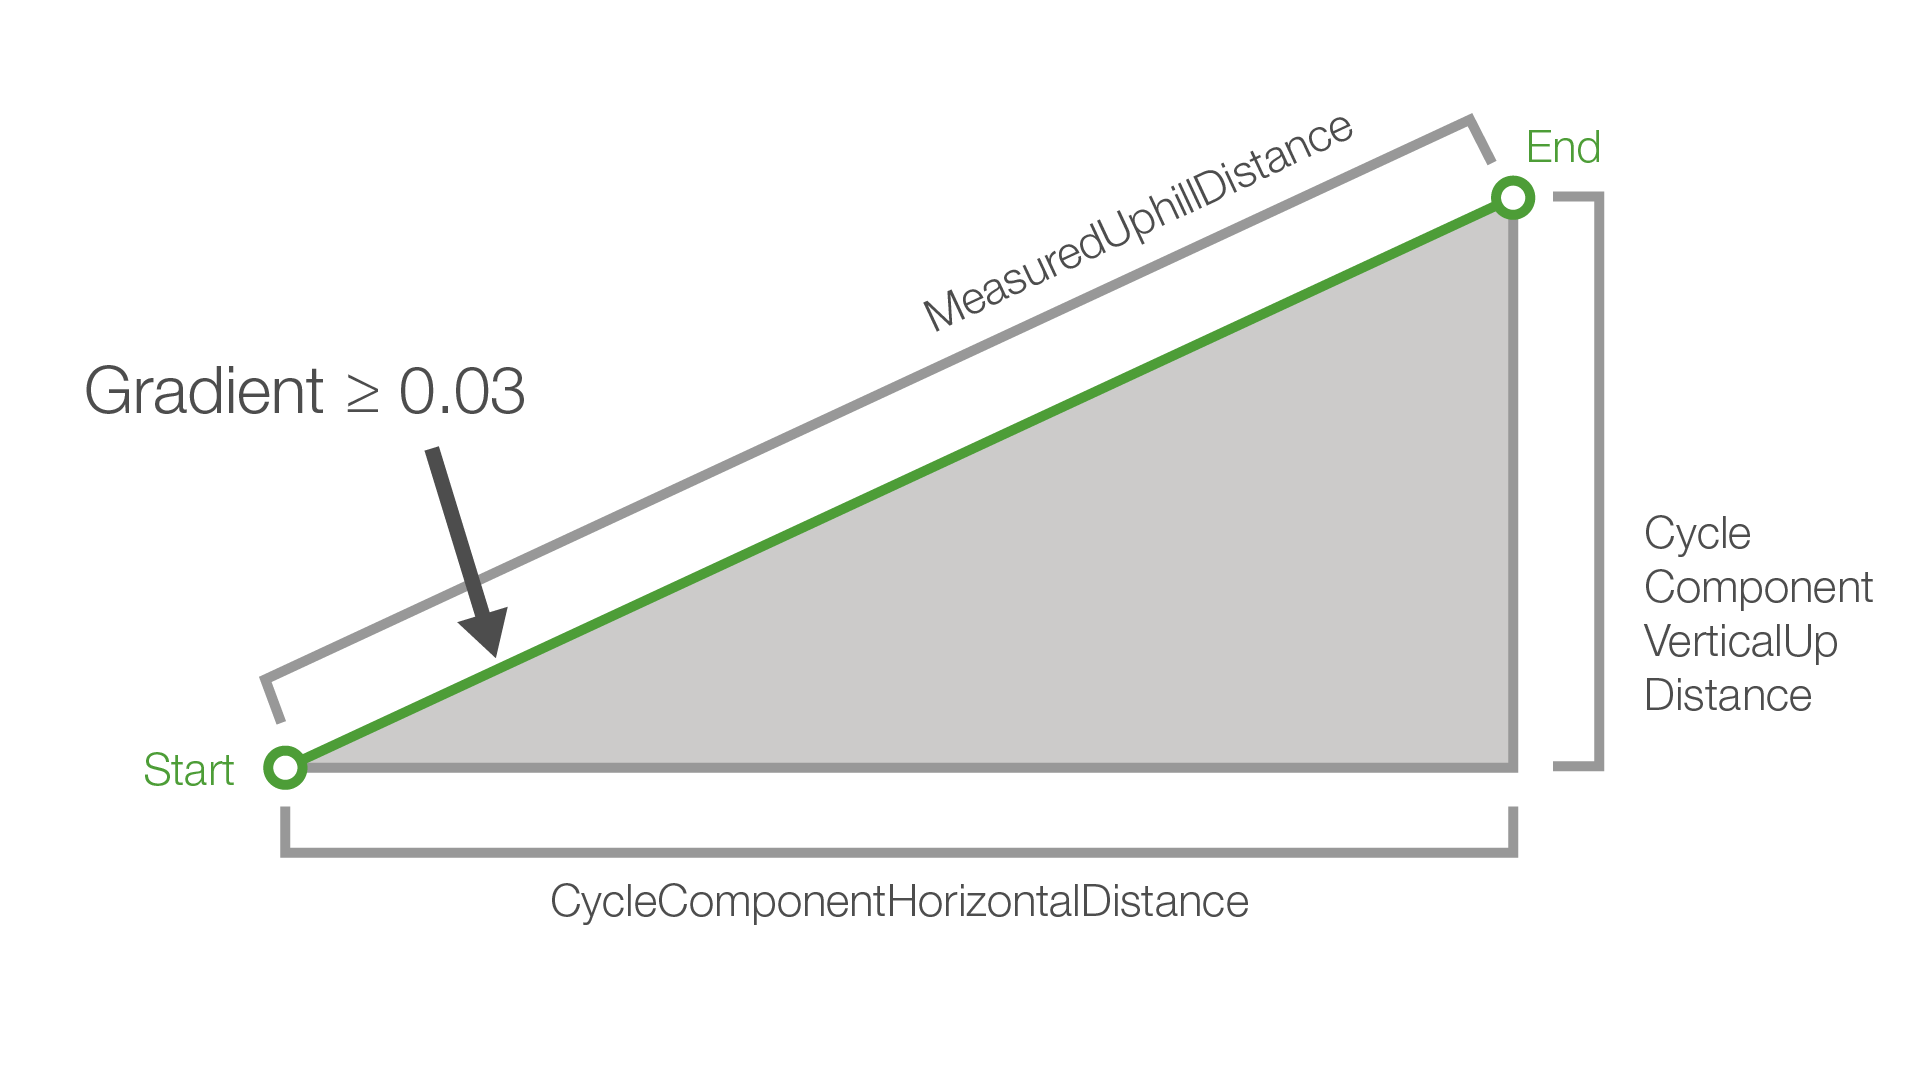
MeasuredUphill: A road is classified as MeasuredUphill if the truck is travelling in an upward direction and the gradient is greater than or equal to the value specified in the
Equipment tab > Advanced Options subtab > Horizontal Gradient (%) field. -
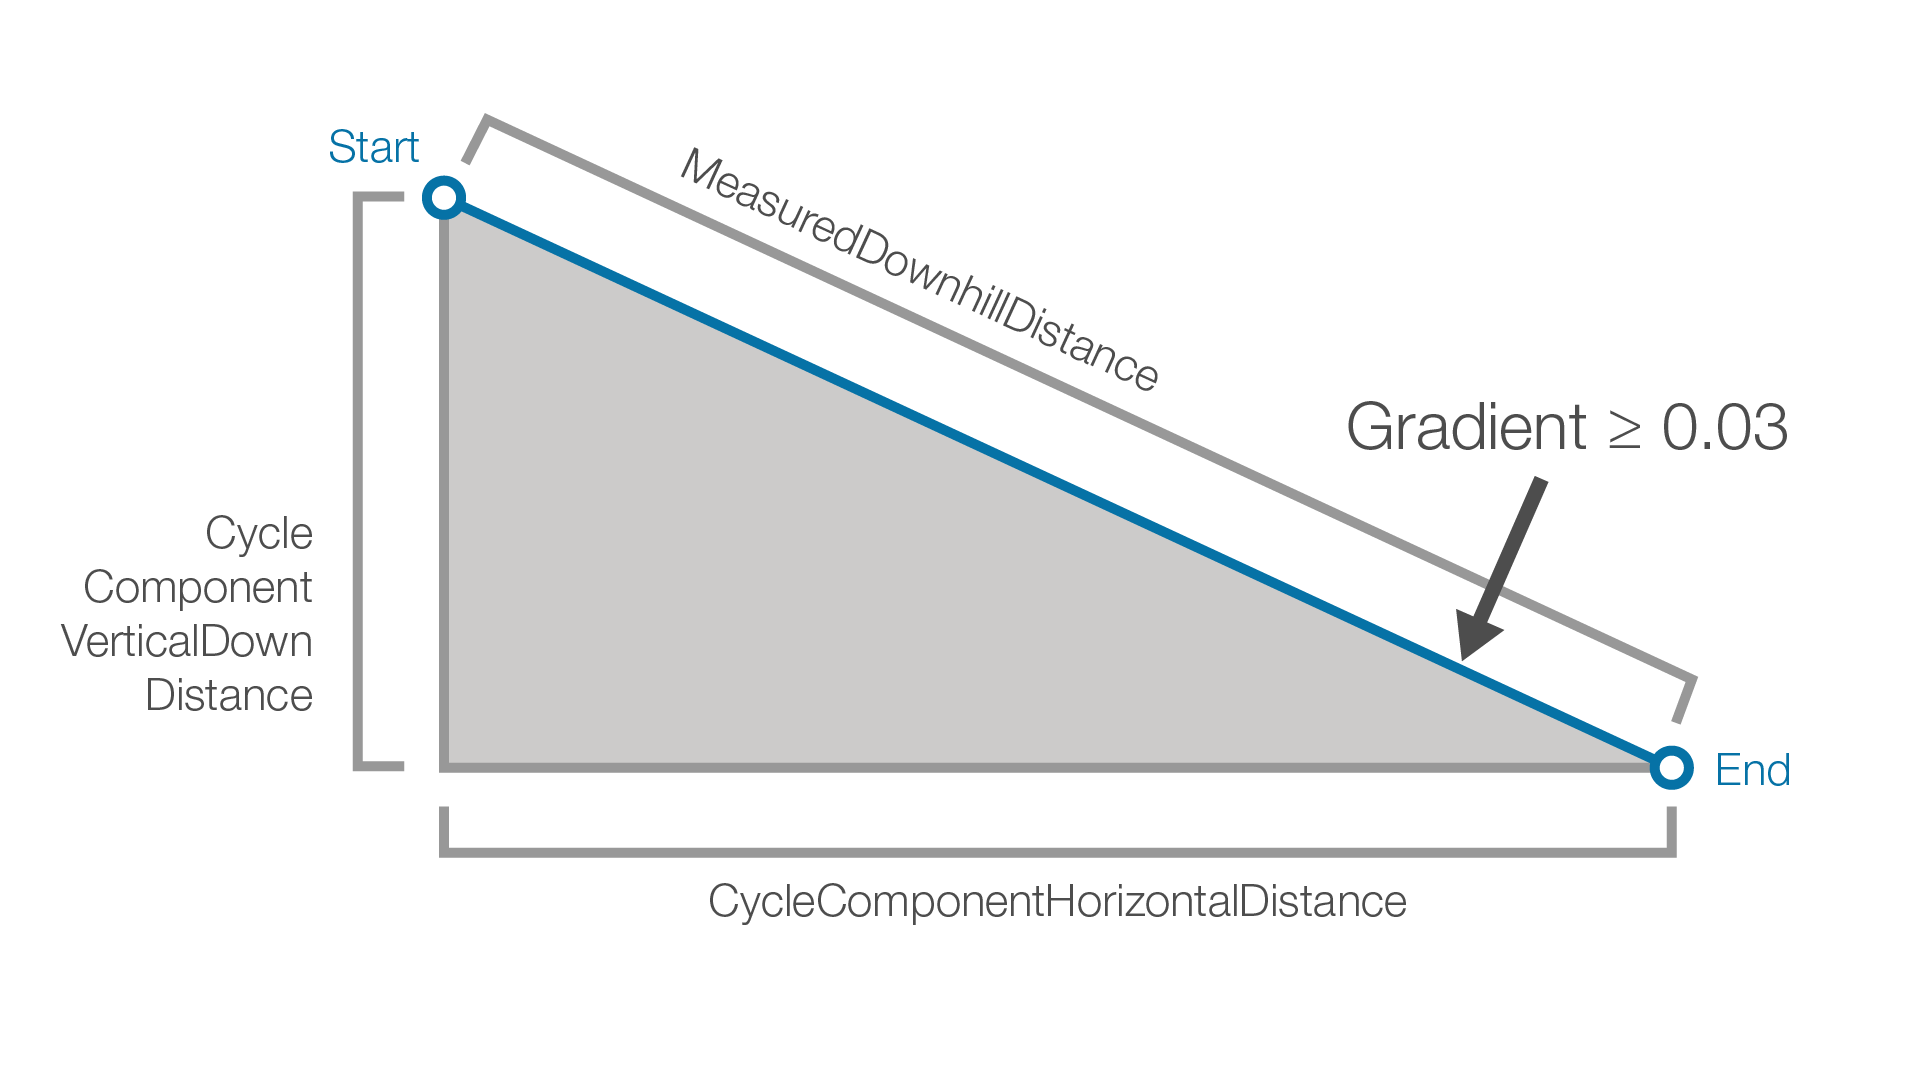
MeasuredDownhill: A road is classified as MeasuredDownhill if the truck is travelling downwards and the gradient is greater than or equal to the value specified in the
Equipment tab > Advanced Options subtab > Horizontal Gradient (%) field. See also: Advanced Options in Equipment setups
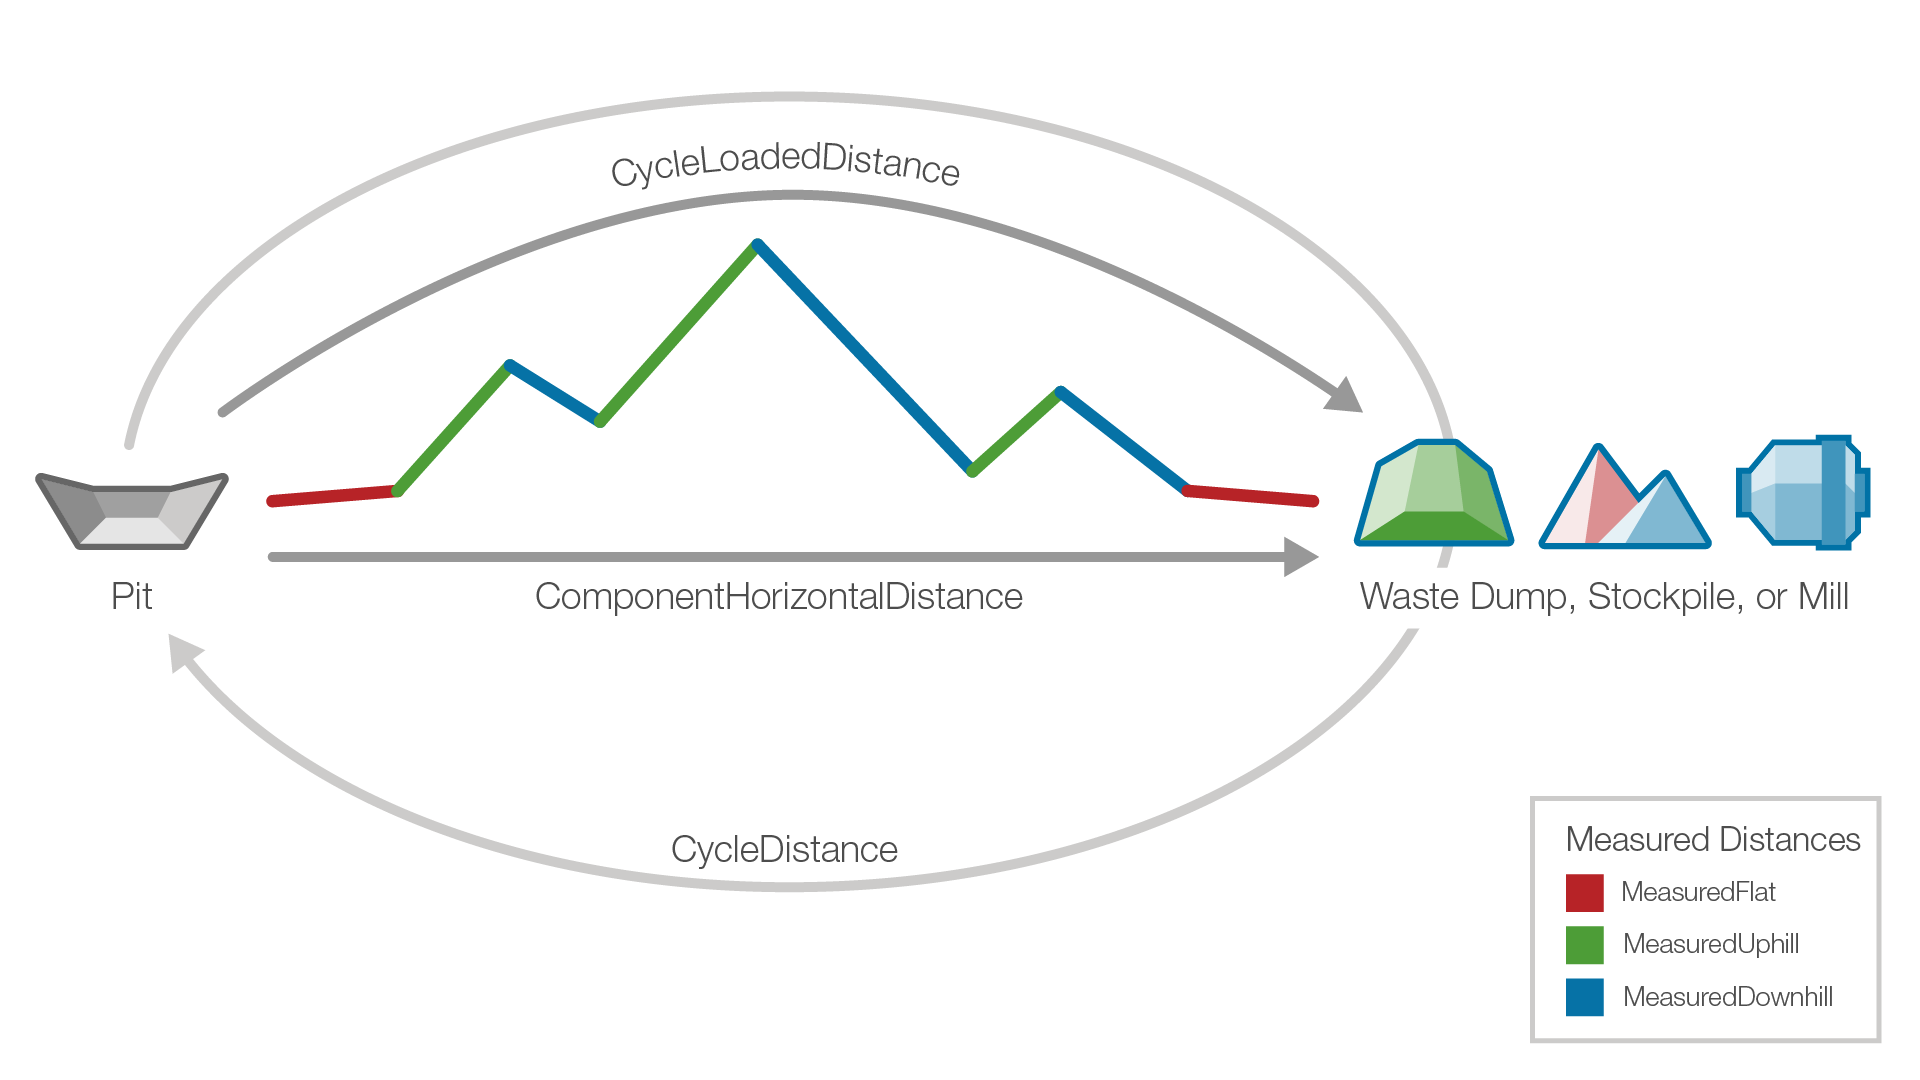
The MeasuredDistance is further broken down into its components; that is ComponentHorizontal and ComponentVerticalUp or ComponentVerticalDown distances. It is similar to a two-dimensional vector having X and Y components.
| Downhill components |
|
| Down-Flat components |
|
| Uphill components |
|
| Up-Flat components |
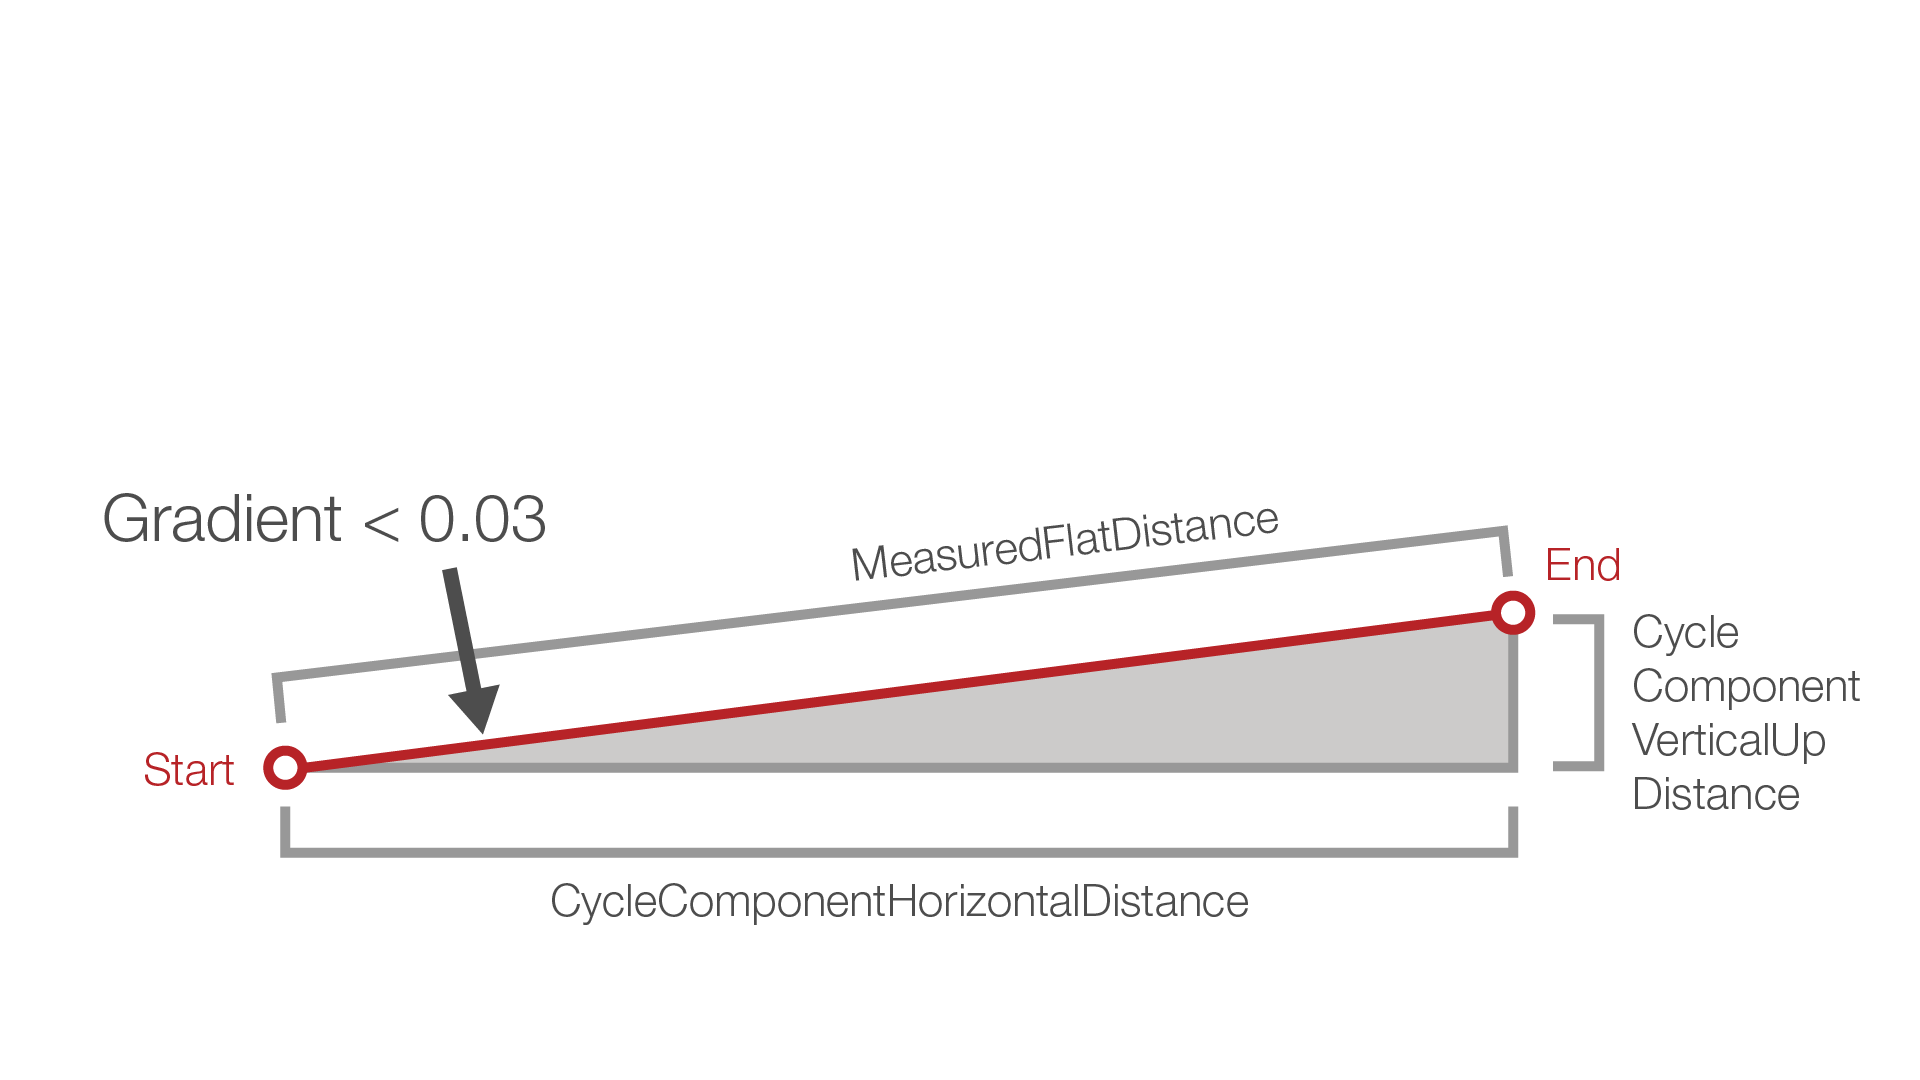
|
In the report, the MeasuredFlat distance is the sum of all MeasuredFlat distances for every road segment for each solid with the defined characteristics. The same applies for the MeasuredUphill and MeasuredDownhill distances, and the ComponentHorizontal, ComponentVerticalUp, and ComponentVerticalDown distances.
Tip: To copy the contents of your road network report, click ![]() Export to Clipboard in the top right corner of the view window. To save the road network report, click
Export to Clipboard in the top right corner of the view window. To save the road network report, click ![]() next to the
next to the ![]() Export to Clipboard, select
Export to Clipboard, select ![]() Export to CSV, and specify the location where you want the file to be saved.
Export to CSV, and specify the location where you want the file to be saved.
