Model Analysis & MIK
The ![]() Model Analysis & MIK subtab allows you to analyse the properties of the material above a given cut-off grade in a given model, stage, or bench by specifying grade tonnage intervals. When you specify grade tonnage intervals, Strategy analyses the actual grades present in the blocks of your model. Therefore, to calculate the material above cut-off grade, Strategy uses all blocks that have grades higher than the specified cut-off.
Model Analysis & MIK subtab allows you to analyse the properties of the material above a given cut-off grade in a given model, stage, or bench by specifying grade tonnage intervals. When you specify grade tonnage intervals, Strategy analyses the actual grades present in the blocks of your model. Therefore, to calculate the material above cut-off grade, Strategy uses all blocks that have grades higher than the specified cut-off.
Important: The current grade tonnage intervals logic has been implemented for the Evolution 2025 release. Up to, and including Evolution 2024.1, this function was called Grade Bins and operated by aggregating blocks into predefined grade ranges, using interpolation for cut-off grade calculations. The logic introduced with the 2025 release eliminated the need for grade interpolation between ranges, which has contributed to improving the material distribution accuracy. Consequently, if you had been using previous versions of Evolution and recently upgraded to 2025, you may notice small differences in your schedules. These differences result from the implemented accuracy improvements rather than fundamental changes in Strategy’s operation. We recommend that you review your schedule results after upgrading Evolution, and encourage you to contact Maptek if you have any questions.
MIK method principles
MIK (Multiple Indicator Kriging) is a geostatistical method used to estimate grade distributions within a block model by assigning proportions of material to grade tonnage intervals. Contrary to the ordinary Kriging method that uses a single grade estimate per block, MIK provides a distribution of grades, allowing for better modelling of skewed or highly variable ore deposits.
In block models, each block model contains multiple grade and proportion variables. The total tonnes (tt) variable represents the total material in the block.
When analysing grade tonnage intervals, Evolution assigns grade values to each interval (for example, 0 g, 1 g, 2 g, 3 g per tonne). Each material has a proportion that represents the fraction of material above the corresponding cut-off grade. Evolution calculates the average grade per interval, which increases as the cut-off grade increases.
Evolution calculates the ore tonnes by using the proportions in each grade tonnage interval and then derives the metal content from ore tonnes and average grades, while computing incremental grades per each tonnage interval.
Important: In non-MIK setups, the settings that you apply in the ![]() Model Analysis & MIK subtab are not taken into account by Evolution when it evaluates your setup. Setting grade tonnage intervals is optional and does not affect the generated schedules. Use it for informational purposes only.
Model Analysis & MIK subtab are not taken into account by Evolution when it evaluates your setup. Setting grade tonnage intervals is optional and does not affect the generated schedules. Use it for informational purposes only.
Note: Enabling MIK for analysing the grade tonnage intervals is optional.
Setting grade tonnage intervals
You can set the grade tonnage intervals for your model the following ways:
-
Generate evenly spaced grade tonnage intervals.
Generate simple intervals by entering three parameters.
-
Generate uniquely spaced grade tonnage intervals.
Generate grade tonnage intervals with custom interval spacing.
Generate evenly spaced grade tonnage intervals
To generate evenly spaced grade tonnage intervals, follow these steps:
-
On the Evolution ribbon, go to the
 Reporting tab >
  Model Analysis & MIK subtab.
 -
Click
 Interval Configuration.
 -
Select
 (Generate grade tonnage intervals). The Generate grade tonnage intervals fields will appear in the window.
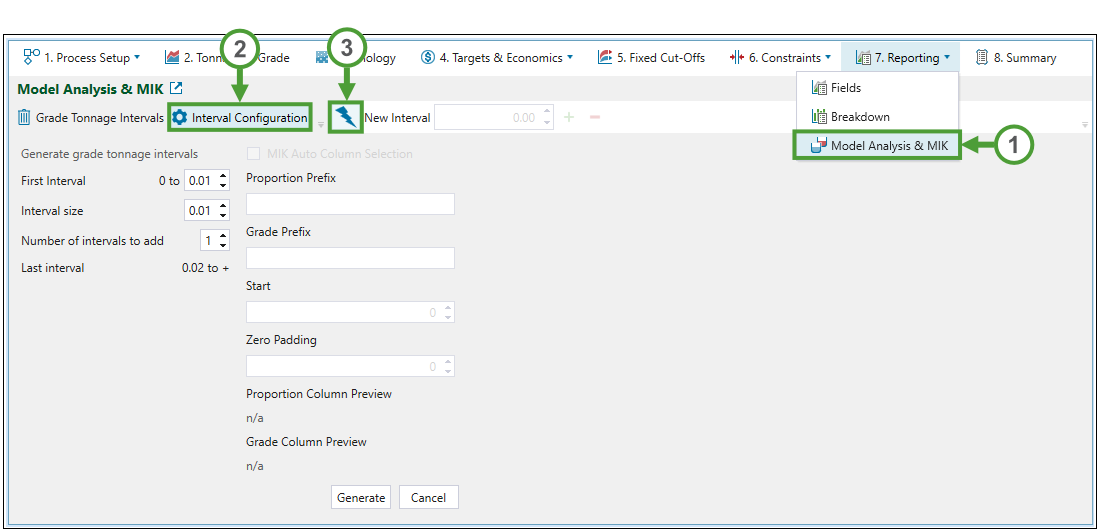
-
Configure the First Interval, Interval Size, and Number of intervals to add fields as required.
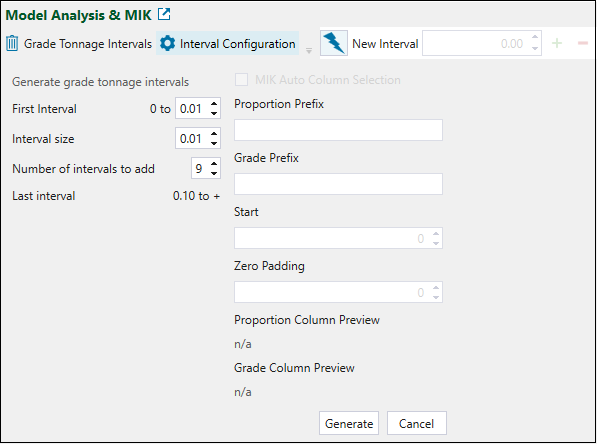
Optionally, select the MIK Auto Column Selection checkbox to autofill the grade tonnage intervals based on the block attributes in your model.
Note: For the MIK Auto Column Selection checkbox to become active, you need to select the Multiple Indicator Kriging Enabled (MIK) checkbox in the
 Tonnage & Grade tab.
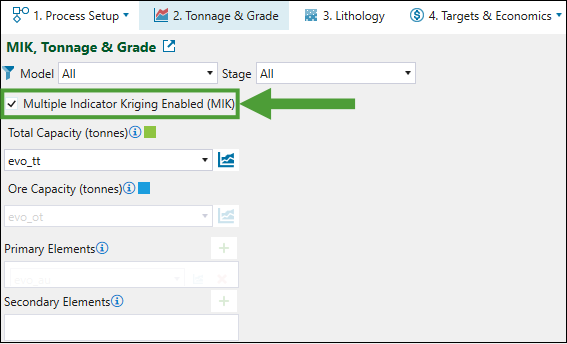
See Tonnage & Grade for more information. Expand for information on filling in the MIK Auto Column Selection fields.
Follow these steps to autofill the grade tonnage intervals based on the block attributes of your model:
-
Select the Multiple Indicator Kriging Enabled (MIK) checkbox in the
Tonnage & Grade tab (see Tonnage & Grade for more information). -
Select the MIK Auto Column Selection checkbox in the
Interval Configuration panel of the Model Analysis & MIK subtab.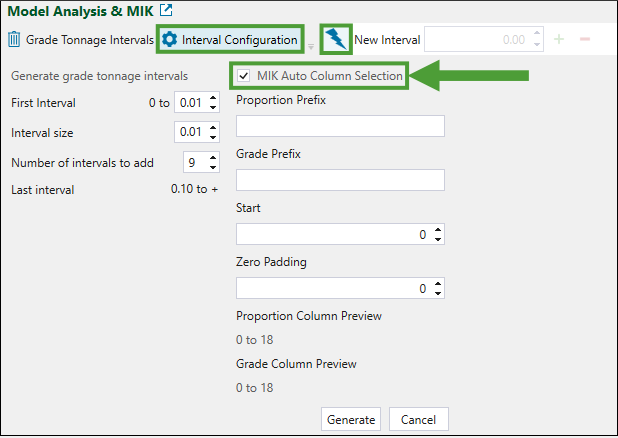
-
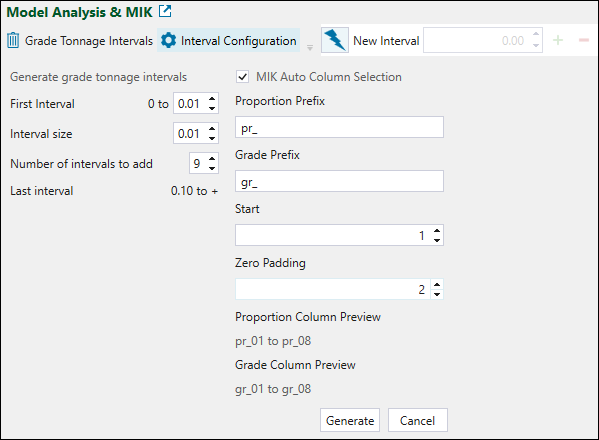
Specify the following:
-
Proportion Prefix. Enter the prefix that corresponds to the proportion of the block that is considered to be ore in that range.
-
Grade Prefix. Enter the prefix that corresponds to the actual grade of the ore specified in the Proportion Prefix field.
-
Start. Set the first block model attribute to import (for example, the Grade Prefix (entered as
gr_) with the Start field specified as3, will start importing from gr_3 and up). -
Zero Padding. Enter the number of digits that should follow the specified prefix.
Example
-
-
-
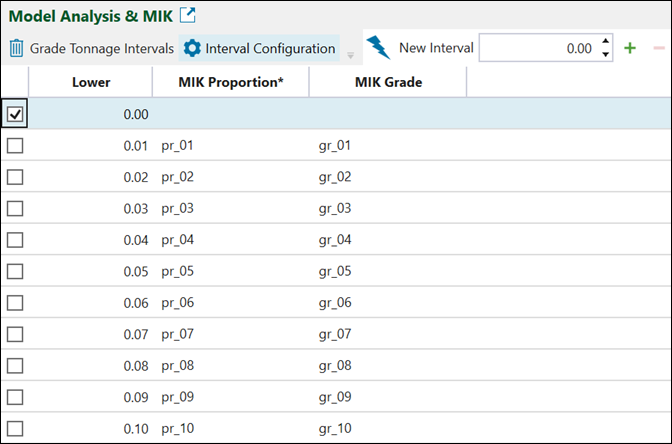
Click Generate. Evolution will generate evenly spaced intervals and open them in the
Model Analysis & MIK subtab.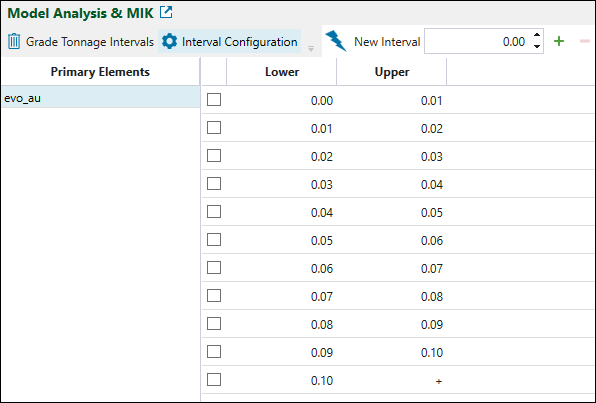
Note: If you have enabled MIK in your grade tonnage interval generation, Evolution will include the MIK proportion and MIK grade in the interval distribution.
-
To insert a new interval, enter the value that Evolution will use as the upper boundary of one interval and as the lower boundary of the adjacent interval, then click
 (Add new interval).Example

-
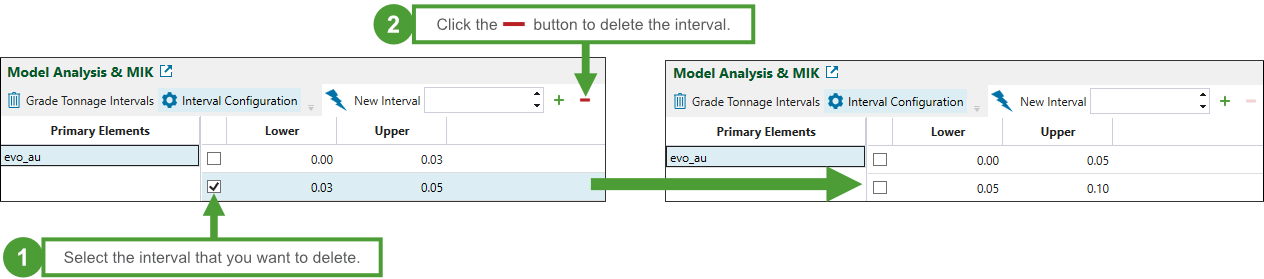
To remove an interval from the table, select the checkbox corresponding to the interval you no longer require and click
 (Delete selected interval).Example
-
Generate uniquely spaced grade tonnage intervals
Follow these steps to generate uniquely spaced grade tonnage intervals:
-
On the Evolution ribbon, go to the
Reporting tab > Model Analysis & MIK subtab. -
Click
Interval Configuration.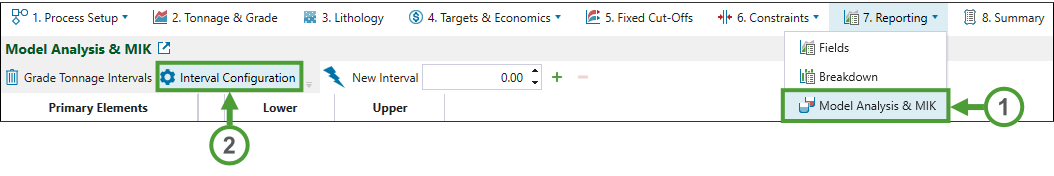
-
In the New Interval field, enter an upper boundary for your first grade tonnage interval and click
(Add new interval). Strategy will add the interval to the table.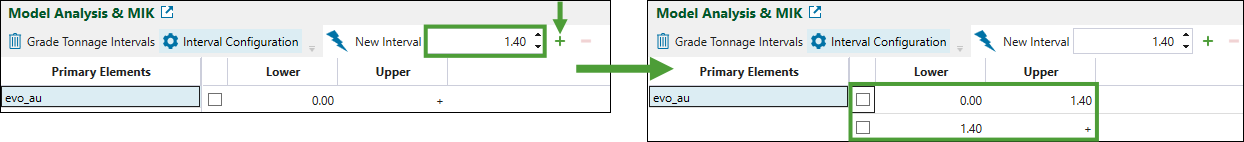
Repeat this step to add the required grade tonnage intervals.
Viewing grade tonnage intervals
After generating grade tonnage intervals, you can analyse the interval properties in the following views:
-
Tabular view
-
Chart view
-
Pie chart view
These views display the amount of material calculated per interval for each primary element that has been added to the setup.
 Tabular view
You can filter displaying the data by Element, Model, Lithology, Stage, and Bench by selecting the required attributes and items from the corresponding drop-downs.
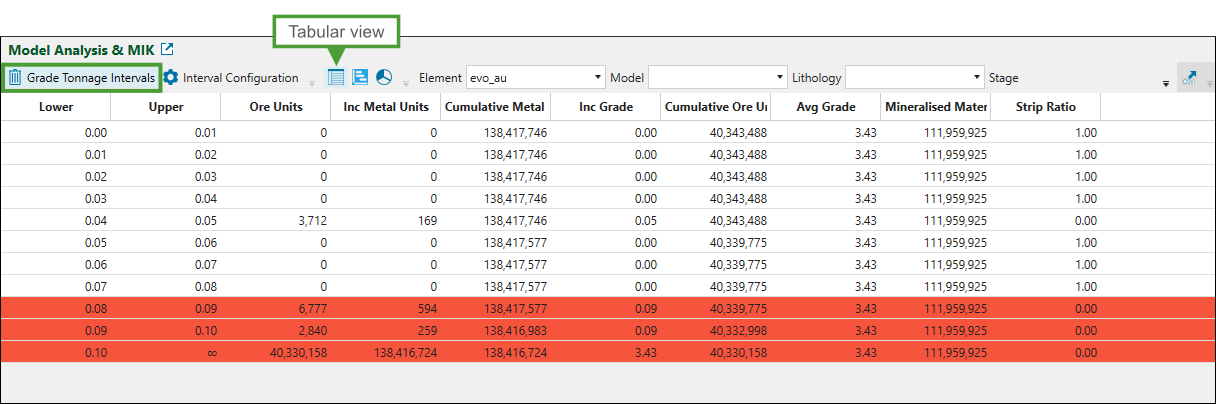
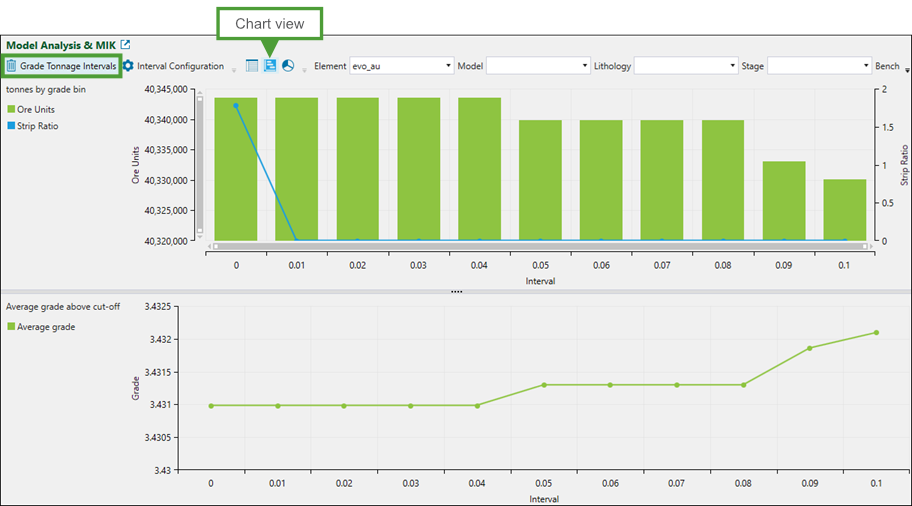
 Chart view
As with tabular view, you can filter the displayed data by Element, Model, Lithology, Stage, and Bench.
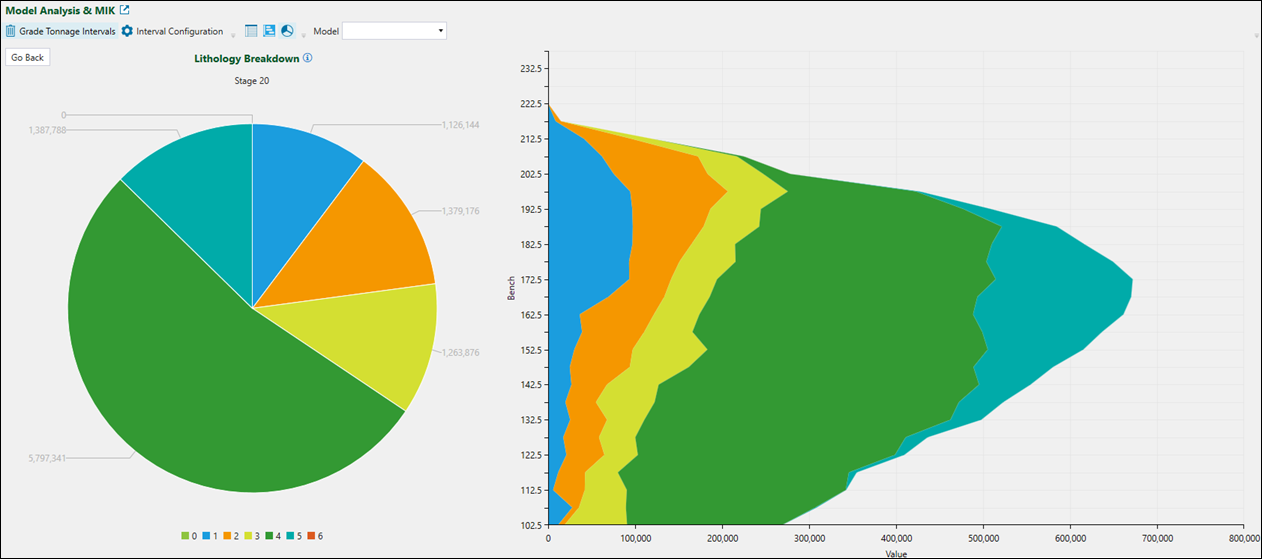
 Pie chart view
Pie chart view displays the overall lithology breakdown, as well as the detailed lithology breakdown by each stage.
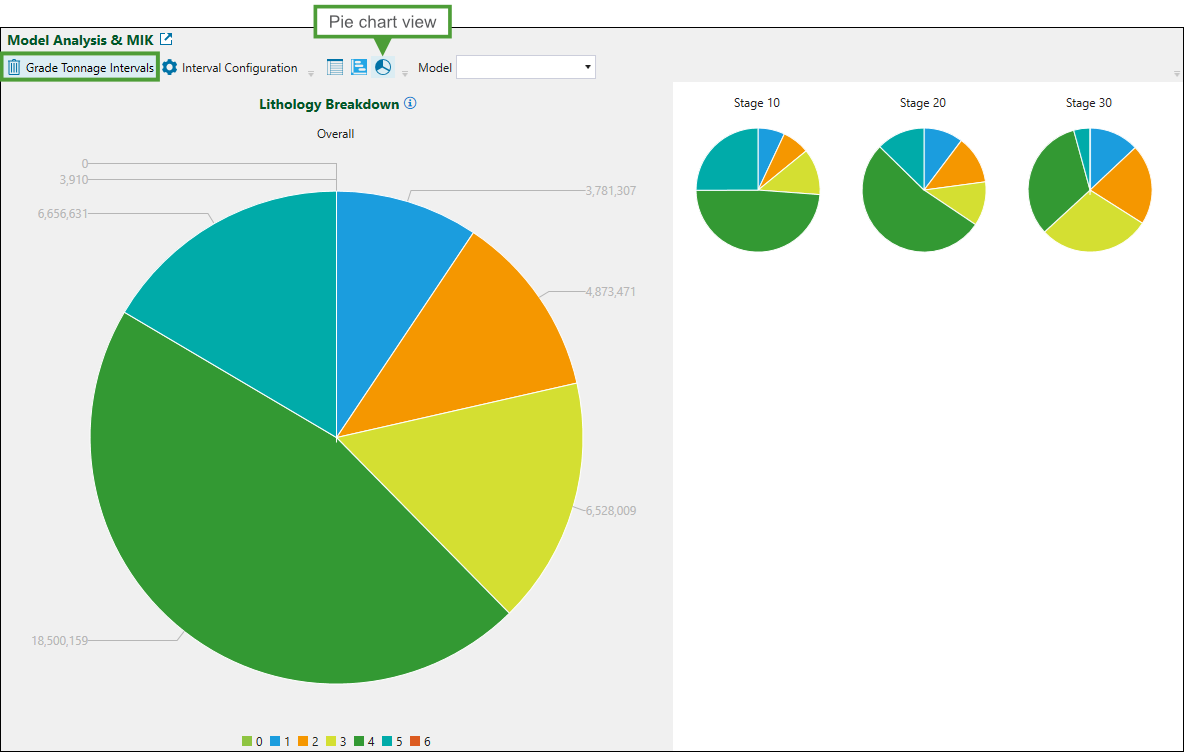
To view the detailed data from a particular stage, select the required stage on the right side of the screen.