Analyse
The following table describes the tools in the Analyse section of the Geotechnical tab.
| Tool | Description |
| Spacing | Looks at the spacing between repeating occurrences of discontinuities. |
| Create Solid | Aids in constructing a suitable polygon fitting a discontinuity hole. |
| Query Waviness | Ascertains waviness characteristics of a discontinuity surface |
| Rose Diagram | Plots the frequency of data versus the direction of the data. |
Spacing
The Discontinuity spacing tool helps to build a simple map of spacings between discontinuities. The tool allows you to specify the size to use for comparing overlaps of discontinuities, then examine the spacings between discontinuities with reference to an average orientation or a specific orientation of interest. The graphical results are stored in the geotechnical container. A summary is also produced in the Report window of statistics for individual discontinuity sets as well as a final grouping of all discontinuities.
A text file listing the spacings can also be saved.
-
Start with discontinuities that you've investigated using Extract discontinuities, Query dip and strike, or saved previously. Multiple sets of discontinuities can be assessed at once. Results will be given for each set as well as for all discontinuities combined.
-
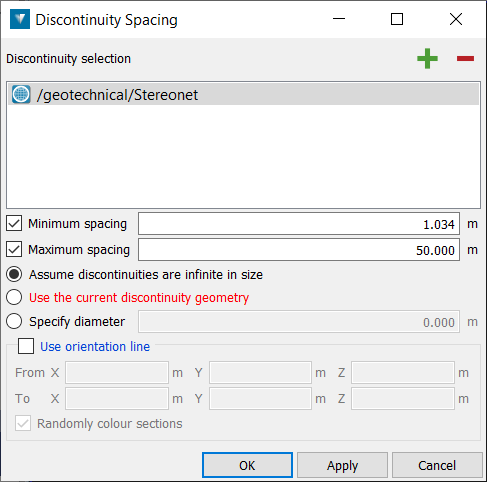
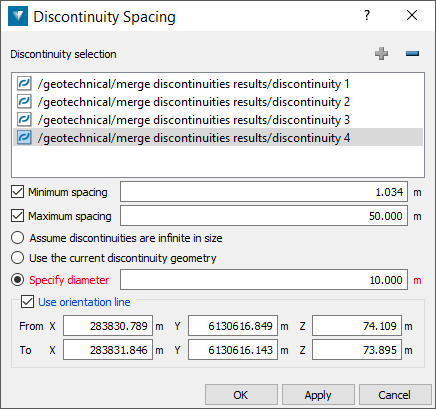
Go to Geotechnical > Analyse > Spacing. This will open a new panel. Add existing discontinuity sets and/or individual discontinuities to the Discontinuity selection list by selecting and clicking the plus symbol or middle click and drag into the box. Remove an entry by selecting and clicking the minus symbol.
-
Adjust settings to refine your analysis. The following are available for helping define the theoretical size of discontinuities or excluding certain spacings.
These are optional:
-
Minimum spacing — Spacing less than this will be ignored.
-
Maximum spacing — Spacing greater than this will be ignored.
Choose one of the following methods to define the size of the discontinuities for the purpose of the analysis:
-
Assume discontinuities are infinite in size — If this is selected then discontinuities will be treated as infinite planes.
-
Use the current discontinuity geometry — If this is selected, then only discontinuities which exactly intersect the orientation line will be counted.
-
Specify diameter — If this is selected, then discontinuities will be treated as circular discs of the specified diameter located at their current centroids.
Choose whether to use an orientation line and specify its location.
-
Use orientation line — If an orientation line is specified then spacing will be calculated as the distance between discontinuities at the location they intersect the orientation line. Without an orientation line, spacing will be calculated based on the mean discontinuity orientation. Enter coordinates directly into the fields on the panel or select the field(s) and click in the view window where you want to define the orientation line.
-
-
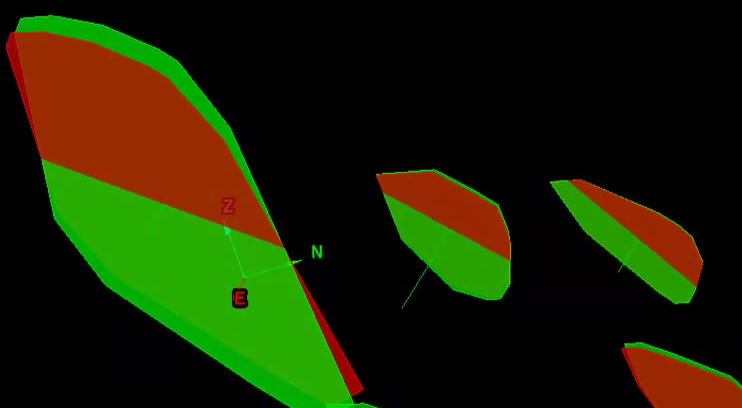
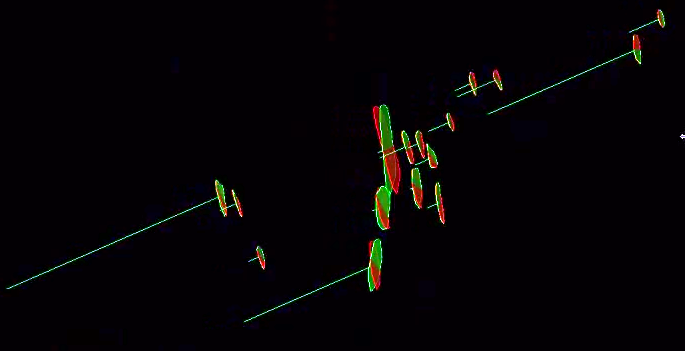
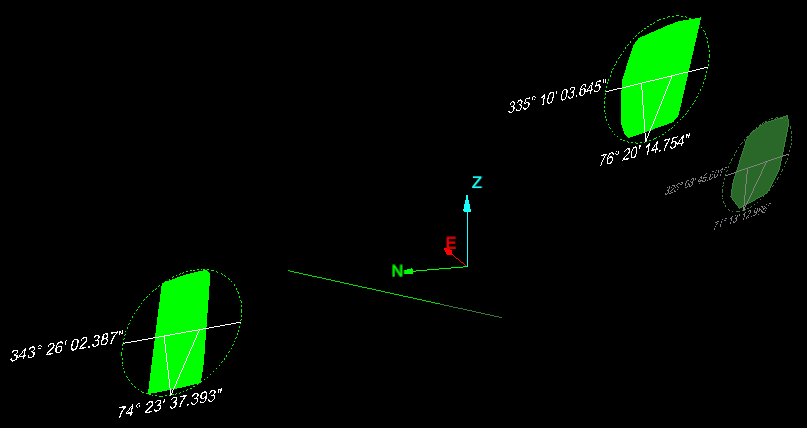
Click OK or Apply to carry out the procedure. New sets of discontinuities will be created at the location of the input discontinuities, but oriented at the mean direction for the discontinuity set. Lines are created that represent the spacings between the nearest discontinuities according to the criteria entered. Right click on a discontinuity and chose View front on or View side on to see these angles accurately (ensure you are in orthographic projection mode , not perspective).
Note: Spacings (represented by lines) can be deleted by manually selecting and removing them in the View window.
Note: Pressing Ctrl-I twice will cause the properties to be updated, without the need to select Geotechnical > Analyse > Spacing. This may be useful after cleaning up data and deleting incorrect lines. Delete all incorrect lines, select the remaining lines, press Ctrl-I twice and properties will be re-calculated.
|
|
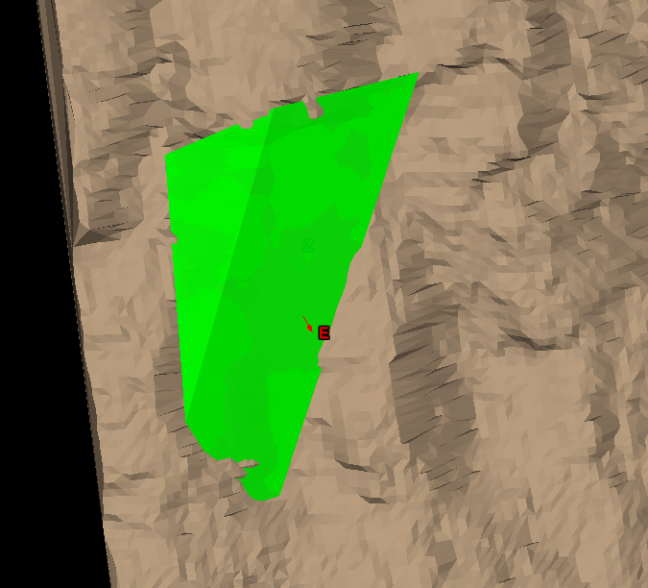
| Original discontinuities (green) displayed overlapping their mean-orientation equivalents (red). The green (perpendicular) lines represent the spacings between discontinuities. | |
|
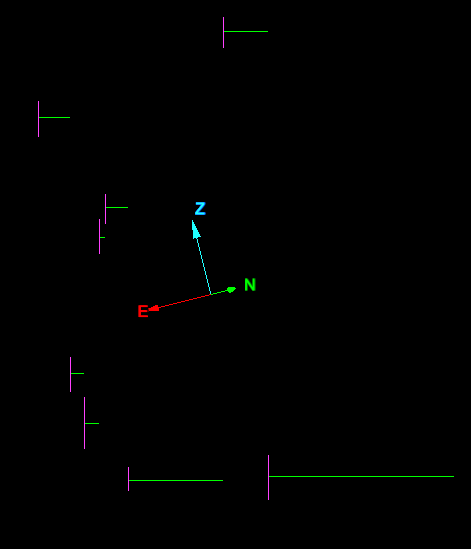
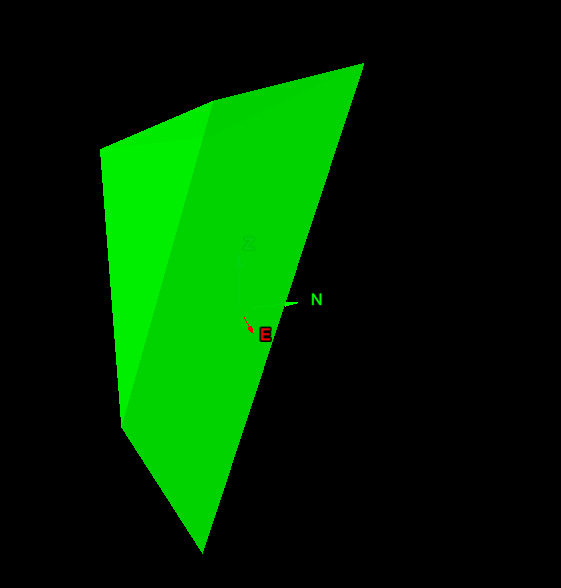
| View side on of the mean-orientation equivalents of the discontinuities. |
|
| View front on of the average-orientation equivalents of the discontinuities. |
The summary of statistics for individual discontinuity sets (if present) as well as a final grouping of all discontinuities will be populated in the report window.
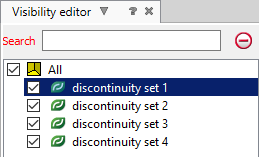
Use the Visibility editor to help differentiate elements to display.
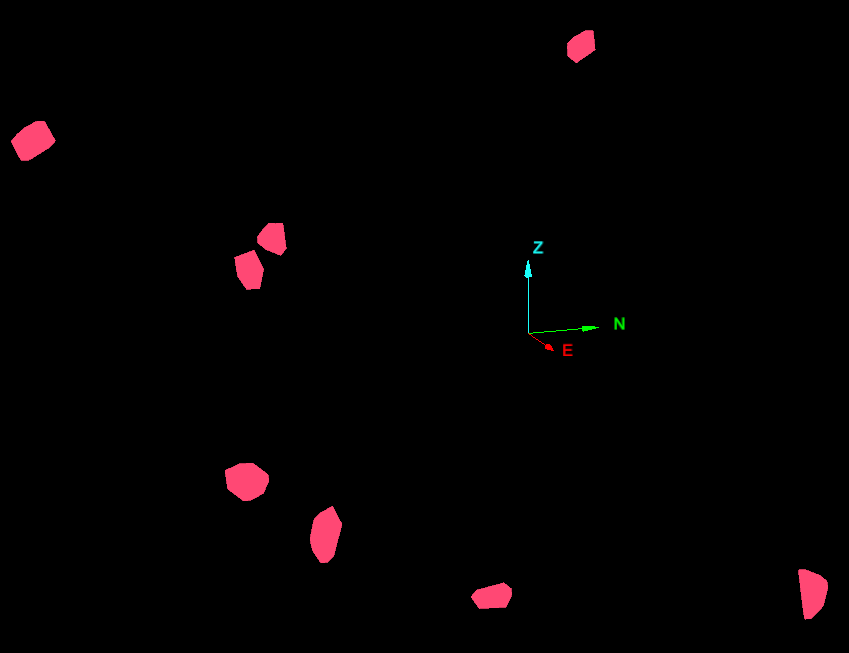
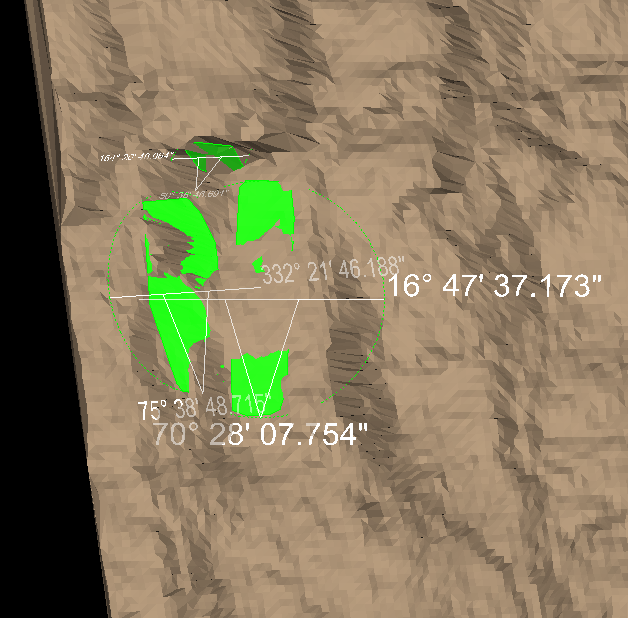
An example analysis using an orientation line and specifying a diameter for the discontinuities. This resulted in only three of the total discontinuities overlapping along the orientation line and two spacings between them.
Create Solid
The Discontinuity Solid tool allows you to construct a solid using discontinuity planes and other planes you describe using three points per plane.
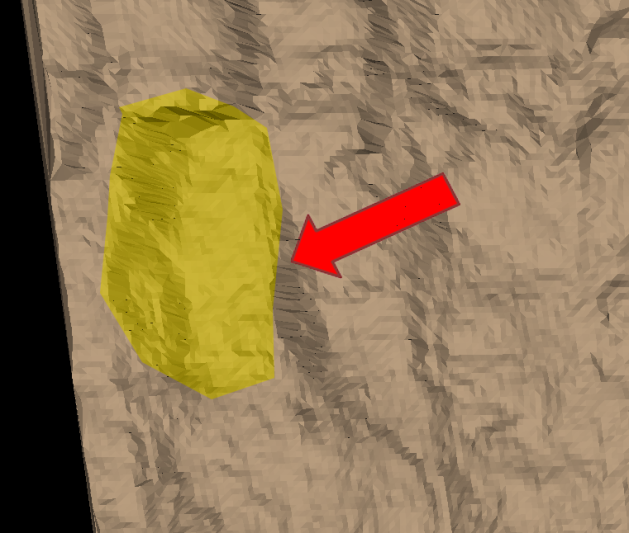
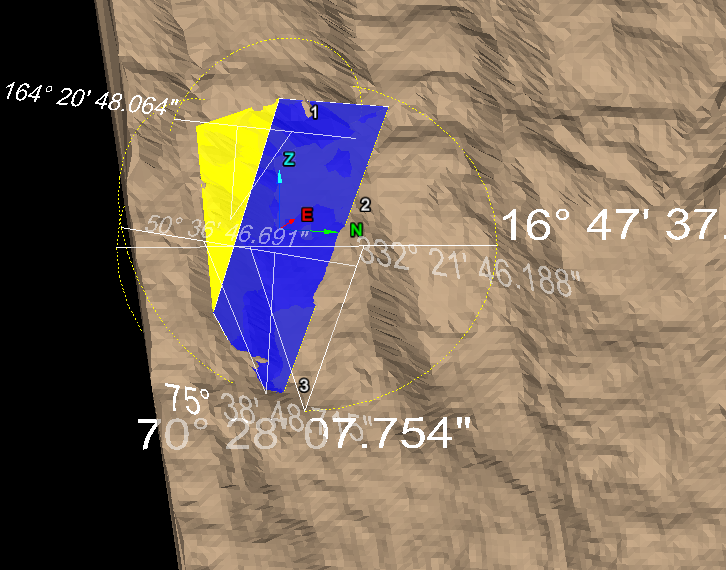
This allows you to construct a solid representing a broken wedge of rock or similar, that has fallen away from a rock wall.
The basic process consists of choosing discontinuities which represent the sides of the solid you wish to construct. Generally, this will define only part of the solid. Next, finish off the solid by defining the remaining sides clicking on three points as close to the plane you want to create. You can continue to build up a more detailed solid by defining more planes at relevant corners etc. The function will automatically extend and trim the planes to create the solid desired. You can use the Visibility editor to hide and view elements (including the rock wall) as you build up the solid.
-
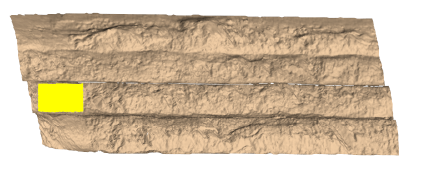
Select the area where you wish to build the Discontinuity solid.
-
Use existing discontinuities or create new discontinuities that represent the sides of the solid in contact with the rock wall surface. Use Query dip and strike and/or Extract discontinuities.
-
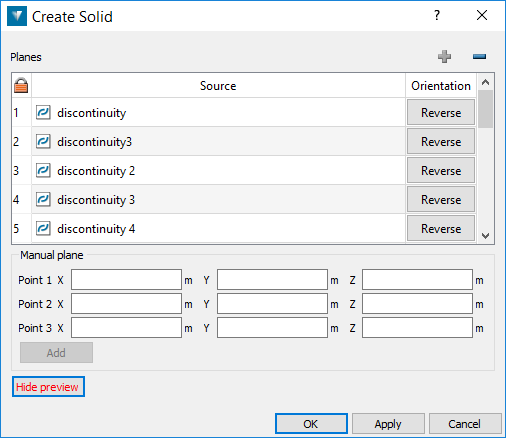
Go to Geotechnical > Analyse > Create Solid. This will open a new panel. Add the discontinuities representing the sides of the solid to the Source list by selecting and clicking the plus symbol or middle click and drag into the box. Remove an entry by selecting and clicking the minus symbol. Click Reverse if the solid needs to use the other side of the discontinuity plane as a reference.
-
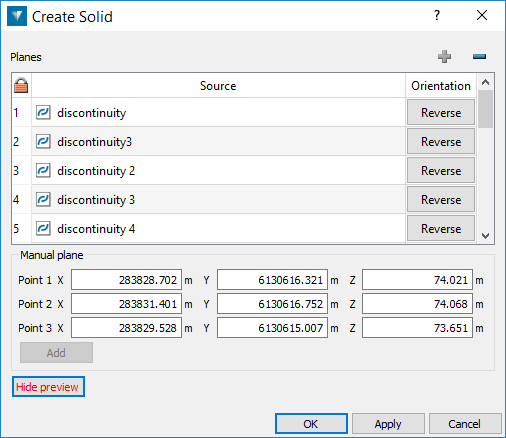
Define Manual planes by clicking in the data field for a point then selecting points around the rock wall where external planes of the solid intersect. You can also manually input numerical values for the coordinates of the points. Click Add to add the plane to the Source list for the solid. A preview visualisation of the solid will be updated.
Continue refining the shape if necessary by defining more manual planes around the edges of the solid. The tool will automatically extend and trim the planes where appropriate.
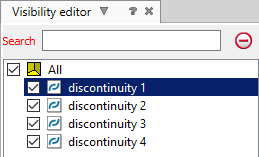
Click Hide preview and Show preview to hide or show a visualisation of the solid. Use the Visibility editor to hide and show other elements around the solid.
-
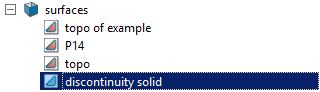
Click OK or Apply to save the solid. The result is a solid object saved in the surfaces container.
Query Waviness
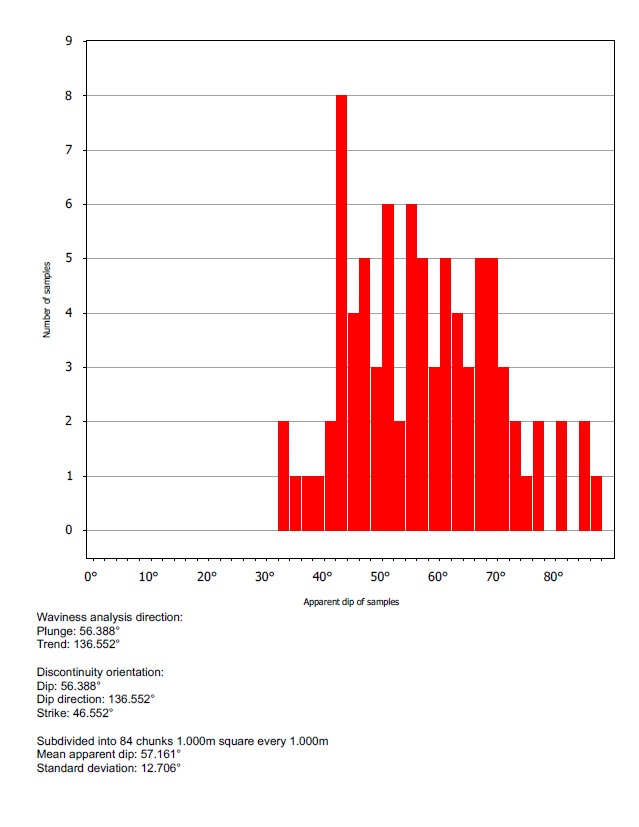
Waviness in discontinuity analyses is concerned with repeating features of flat and steeper areas perpendicular to the slope in the dip direction (forming a wavy pattern), and effectively providing greater resistance to sliding than a totally flat, steep face. The Query Waviness tool provides a means of examining and quantifying the roughness of a section of discontinuity, particularly with respect to the waviness of the roughness. The process involves subdividing the section into nominated sized patches or cells for a statistical analysis of waviness plunge and trend, as well as overall discontinuity dip, dip direction and strike. A series of cross sections through the region help to visualise and identify any wave-like patterns. The results can be saved in a PDF document.
-
Select an area (using any suitable primitive) on a rock face surface for analysis.
-
Open the Geotechnical > Analyse > Query Waviness panel. Check and adjust the settings you want to use.
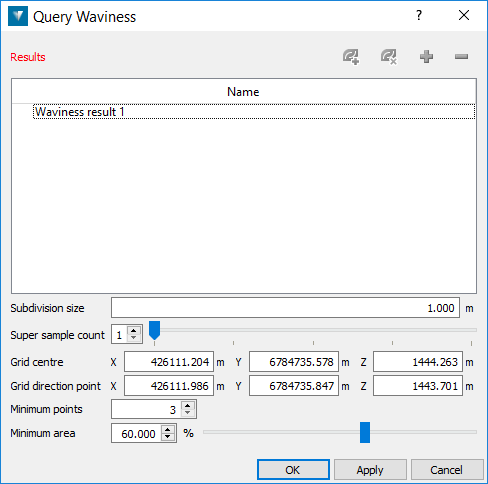
The following settings help to define the size and sensitivity of cells used to examine the variation of slope within the area of interest.
-
Subdivision size — Nominate an appropriate size to divide the area into suitable cells for analysis. The smaller the size, the more sensitive the analysis.
-
Super sample count — A method to further refine analyses over the area. Extra subdivision cells are offset between the initial patches providing extra data.
-
Grid centre and Grid direction point — These identify the direction of slip and are generally auto-populated for a standard planar sliding case. For a wedge case, you can manipulate the line to coincide with the wedge centre line - which represents the direction of probable slip for a wedge block.
-
Minimum points — This figure specifies the minimum number of points required to make the individual plane in the cell. Otherwise the cell is ignored.
-
Minimum area — This figure specifies the minimum percentage of area required to make the individual (discontinuity) plane in the cell. Otherwise, if the resultant cell is smaller than this percentage, it is ignored.
-
-
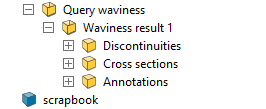
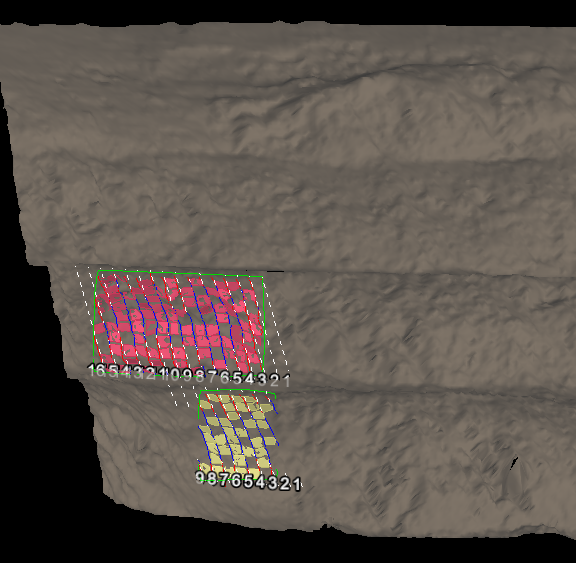
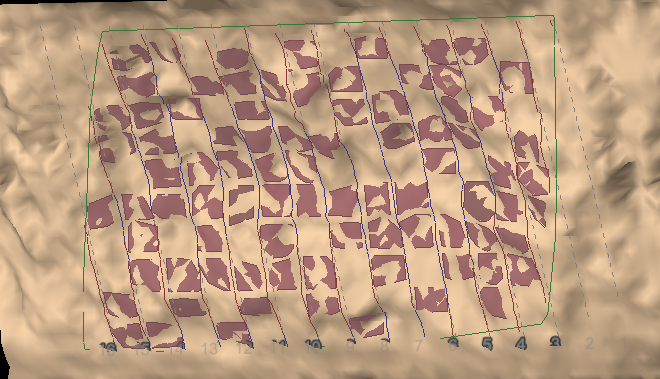
Click the plus symbol to add any selected areas to the Name list. As you add the area of interest, the tool will generate images and display a message. You can continue to add more areas, if desired. Use the minus symbol to remove entries. The remaining two symbols can be used for grouping areas into discontinuity sets, or ungrouping them. Reports are produced for each area showing a histogram and cross sections. These make up the content for saving to PDF files if you choose. At this stage you can view the cells arranged on the surface of the areas under investigation, in more detail. All objects and elements making up the cell analyses are saved in the Geotechnical container.
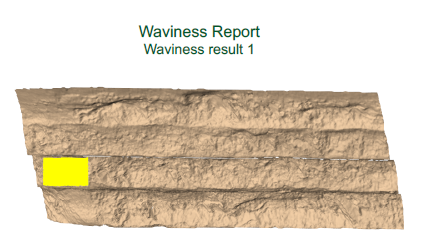
Waviness report
The first page of each Waviness Report identifies the area on the rock face under investigation. The image is a screenshot of the current view when you press the plus symbol, but with a white background.
The second page presents a histogram of the apparent dip of the individual sampling cells used to break down the rock face under investigation. There is also a summary of statistical data drawn from the analysis.
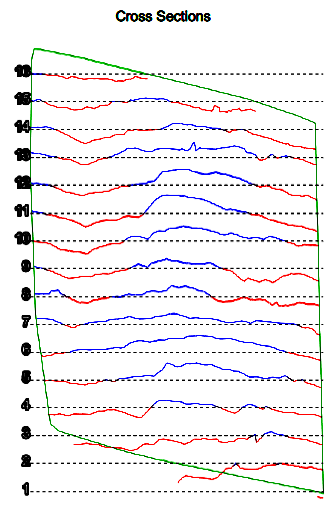
The third page displays cross sections which are taken vertically through the face and rotated left 90 degrees on paper, then displayed above and below each other in sequence from the original right to left (= top to bottom). The spacing of the cross sections is related to the subdivision size. The colour of the cross section line helps to identify whether the line is above (blue = further out) or below (red = closer in) the mean for that section.
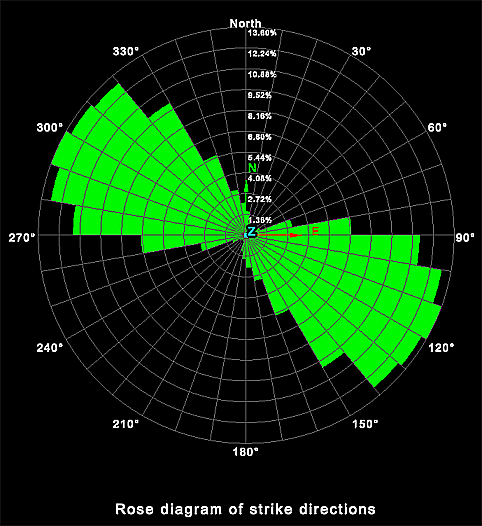
Rose Diagram
The rose diagram plots the frequency of data versus the direction of the data. It can be used to identify directional trends in the data.
Data preparation
Before creating a rose diagram, suitable data must be prepared.
-
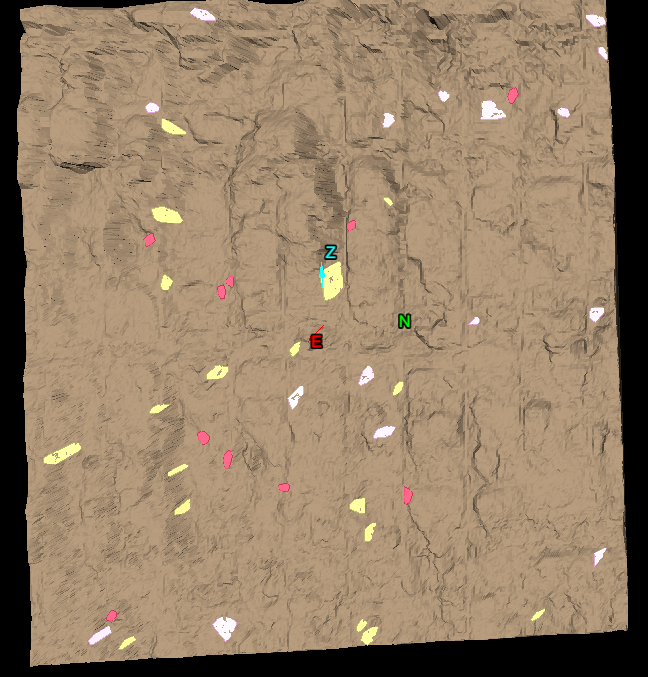
Select a triangulation created using spherical, scan triangulation or a fusion surface. Topographic triangulations are not suitable for geotechnical analysis as they are created in a top-down manner that does not provide sufficient detail on rock slopes.
-
Go to Geotechnical > Colour > Colour Dip and Strike to highlight the areas to be analysed.
-
Select point selection mode.
-
Select some points on a structure of interest.
-
Go to Query and Filter > Search and Select > Smart Select to expand the selection across the structure.
-
Select Geotechnical > Dip and Strike > Query.
-
Repeat this process for all structures of interest. Discontinuity objects are saved in the geotechnical container for each query.
-
Add the resulting discontinuity objects to the View window.
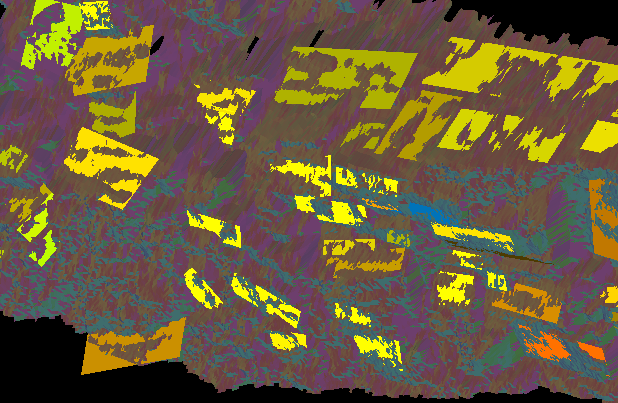
Diagram creation
- Highlight all the created discontinuities in the Explorer window.
- Select Geotechnical >Analyse > Rose diagram.
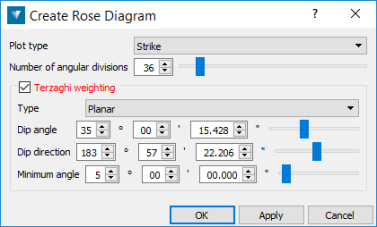
- Select the Plot type from the drop-down list:
- Strike: Plots the strike direction of the planes.
- Dip direction: Plots the dip direction of the planes.
- Trend: Plots the trend direction of the planes.
- Specify the Number ofangular divisions required in the diagram (range 2-360).
- Check
Terzaghi weighting if desired.
Terzaghi weighting uses the
measurement orientation to counteract the sampling bias.
- The Linear type weighting gives higher weights to discontinuities less likely to intersect the specified line.
- The Planar type weighting gives higher weights to discontinuities less likely to intersect the specified plane.
- The Minimum angle is the lowest angle between the measurement orientation and the discontinuity that will be used for weighting.
The rose diagram is saved in the geotechnical container.
The direction of the data is displayed around the outside of the diagram and the frequency of the data is displayed in the centre.