Analysis
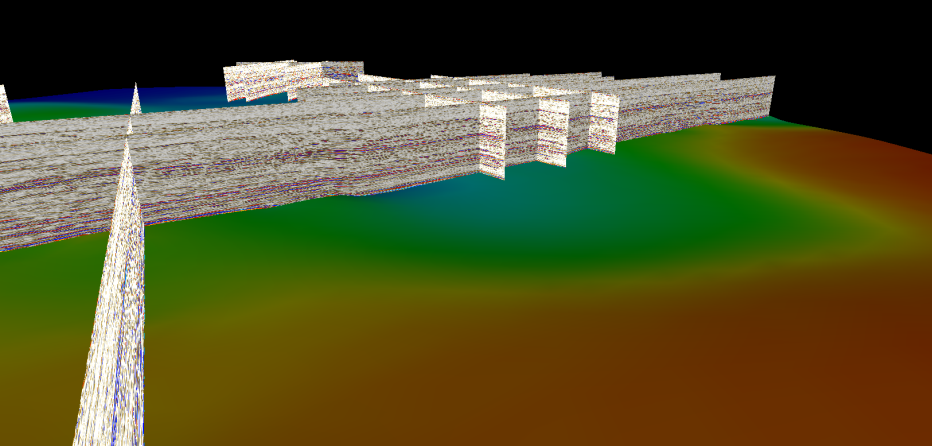
The following table describes the tools in the Analysis section of the Seismic tab.
| Tool | Description |
| Interpretation | Allows the interpretation of horizons and faults of interest, by providing smart tracking along these features. |
| Peaks and Troughs | Quickly interpret large quantities of seismic data by exporting amplitudes above or below a threshold to a point set. |
Interpretation
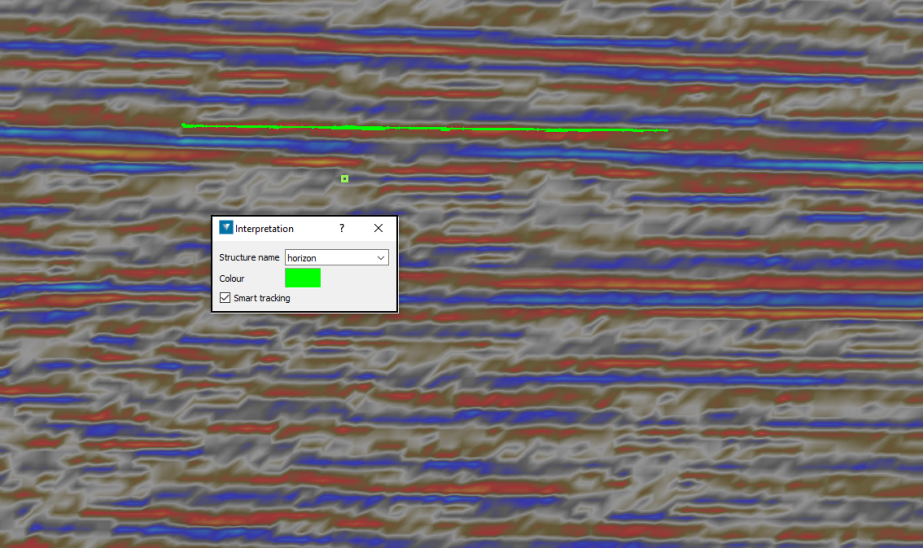
The Interpretation tool is used to allow the interpretation of horizons and faults found in seismic data, providing smart tracking along these features. The created lines can be included as part of surface modelling.
This tool is a variant of the Smart line tool, specialised for seismic data.
-
Display the seismic data in a View window.
-
Select Seismic > Analysis > Interpretation.
-
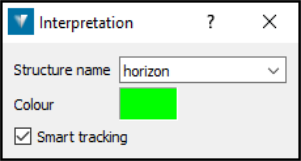
Select a Structure name from the list or enter a new name. This is used to name the container the interpretations will be placed into and group interpretation lines of a single structure together. Previously entered names are available in the drop-down list.
-
Select the desired Colour for the line. Double-click to display the advanced colour panel.
-
Deselect the Smart tracking check-box to disable the smart line.
-
Click the location for the first point in the View window.
-
Enter more points as required. Pick points that are sufficiently close together to ensure the tracking covers all of the points. Note: Each line portion can be undone using the undo command (Ctrl+Z).
-
Click Complete in the Status bar at the base of the screen. The interpretation lines are saved in the container named according to the Structure name field, within the interpretations container.
Note: The lines retain the one way time values (the time taken for the seismic signal to reach the horizon). These can be viewed using point attributes.
Peaks and Troughs
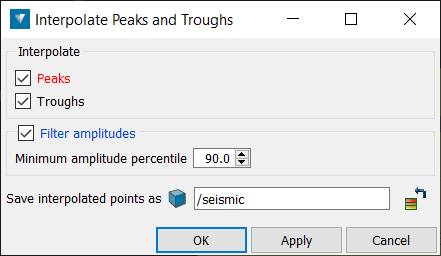
The Peaks and troughs tool can be used to quickly interpret large quantities of seismic data by exporting amplitudes above or below a threshold to a point set. The two-way time attribute stored in the seismic is retained.
-
Select the seismic data to be used.
-
Select Seismic > Analysis > Peaks and troughs.
-
Under Interpolate, select Peaks (cyan) and/or Troughs (yellow) to define how the selection should be made.
-
Under Filter amplitudes, select a Minimum amplitude percentile to define a cut off. With a cut off of 99%, the top 1% of points will be saved.
-
Select a destination container for the points from the Save interpolated points as menu. By default, points are exported to the seismic interpolation container.
-
When complete, click OK or Apply to create the points.
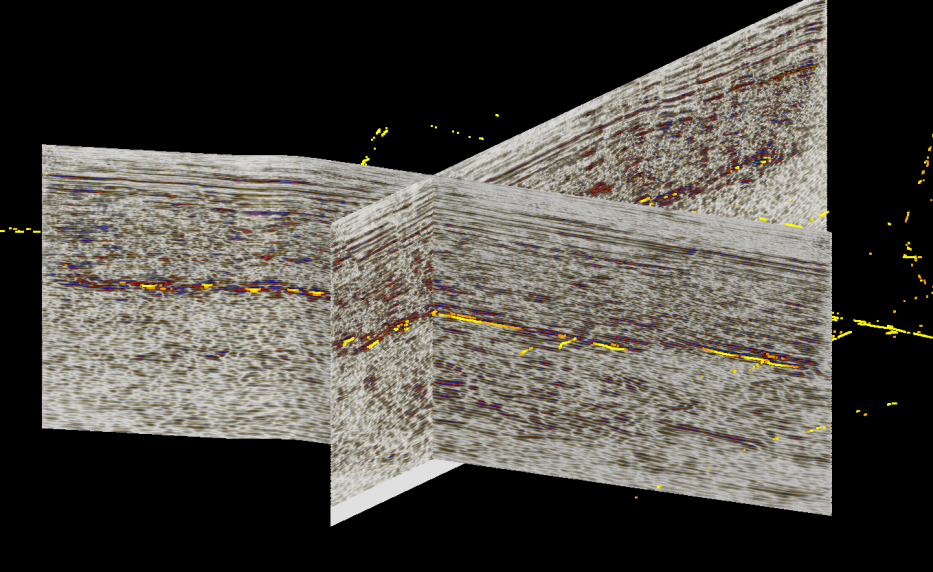
Grid models can be created from the resulting data to generate quick formation surfaces.
