Surface Modelling
The following table describes the tools in the Surface Modelling section of the Stratigraphic tab.
| Tool | Description |
| Stratigraphic Model | Creates a set of stratigraphic grids from selected drillholes. |
Stratigraphic Model
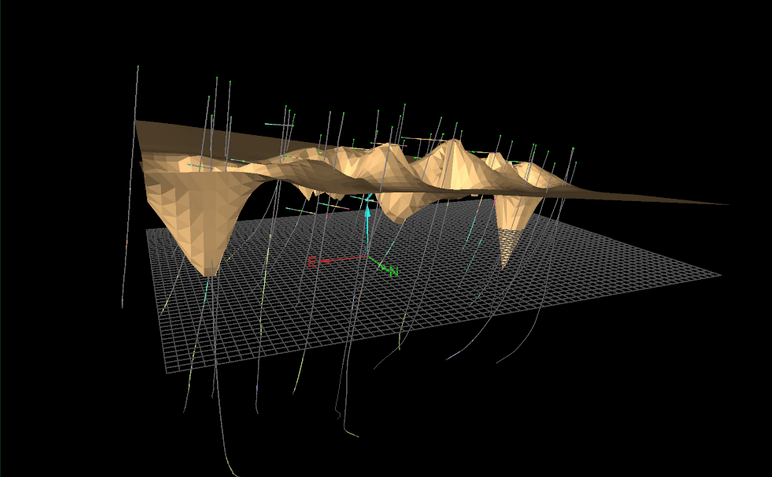
Create Stratigraphic Model can create a set of stratigraphic surfaces from drillholes in a single operation.
Grids are two-dimensional surfaces which can be created from any data containing points. Grid meshes are useful, especially when irregularly spaced and/or sparse data sets occur. They have a distinct advantage that they can be calculated very quickly, and store multiple attributes allowing data trends and residuals to be coloured and viewed easily.
Open the tool by navigating to Stratigraphic > Surface Modelling > Stratigraphic Model.
A panel will open with two input tabs — Select drillholes interval and Model surfaces.
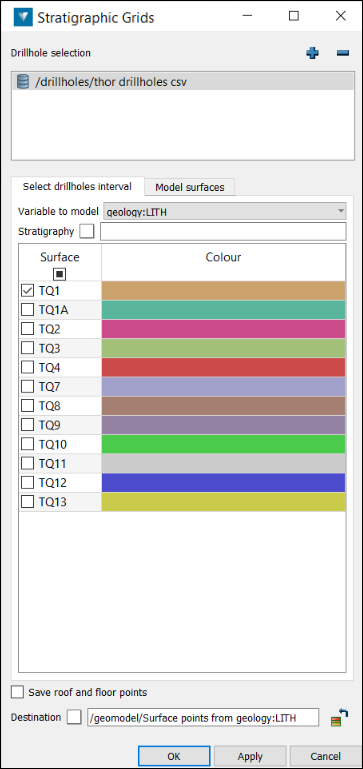
Select drillholes interval
Intervals defined by text can be selected using a stratigraphy.
It is possible to select drillhole collars, the point at the top or bottom of an interval, or the interval itself. The collar, top and bottom selections are point objects. The interval selection is an edge object . If point objects are selected, these may be used to create a grid of the horizon. A grid of an interval selection will model the horizon thickness.
The top, bottom and interval options require a stratigraphy to be created containing the required horizon.
Horizons defined as being non-stratigraphic surfaces in the stratigraphy, will appear in the bottom table under Surface.
-
Add drillholes or drillhole database containing the required data to the Drillhole selection field. Use '+' and '-' buttons to add or remove data respectively.
-
Select Variable to model.
-
Select the stratigraphy layer(s) to model or surface(s) to model.
-
If required, drag and drop the required stratigraphy into the field using the middle mouse button. If no stratigraphy is provided, an on-the-fly stratigraphy will be used.
-
Tick the intervals to be used in the selection (unless collar is specified).
Model surfaces
-
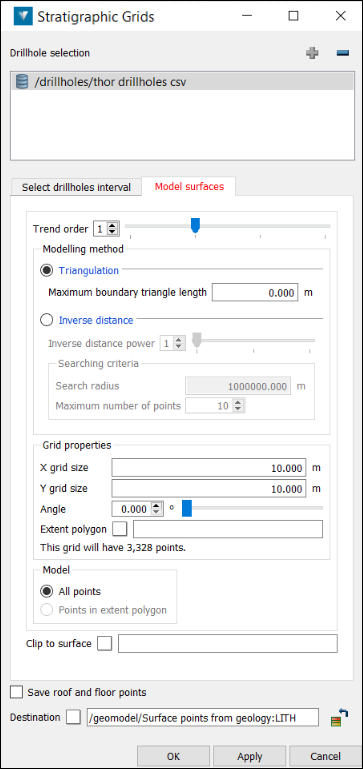
Enter or select a Trend order to model by.
|
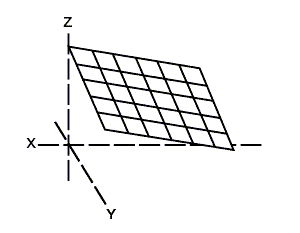
Trend order: 0 |
Trend order: 1 |
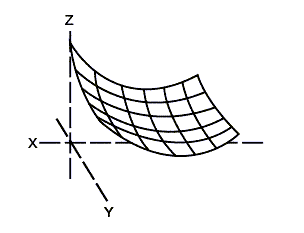
Trend order: 2 |
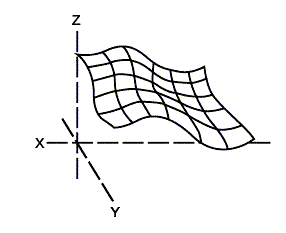
Trend order: 3 |
|---|---|---|---|
|
|
|
|
|
|
Plane at a mean Z value. |
1st order - a planar fit (an inclined horizon) |
2nd order - a simple paraboloid shape of a dome or trough (anticlinal or synclinal) |
3rd order - a combination of dome and trough |
-
Select the required Modelling method. Triangulation is used for modelling physical properties, Inverse distance is used for modelling chemical properties.
-
If the Triangulation modelling method is selected, enter the Maximum boundary triangle length. Any boundary triangles larger than the entered maximum will be removed.
Note: A length of zero means that no triangles will be removed.
Break lines can be used to model faults by including the lines in the selected objects, forcing the model to adhere to edges. The Z value of the break lines is included in the modelling.
-
If the Inverse distance modelling method is selected:
-
Inverse distance power is used to vary the gradient of the results. (Higher values produce a steeper decline around data points.)
-
Search radius is the distance from each grid intersection within which data points will affect the resultant model.
-
Maximum number of points defines the number of points within the search radius that will be used to generate the results.
-
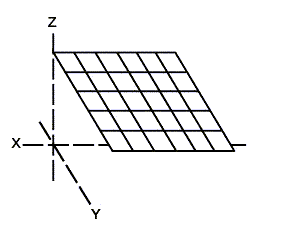
Enter the required X and Y grid size.
-
Select the Angle at which to generate the grid.
-
Provide an Extent polygon to define surface extents - a rectangular extent will be created.
(The number of points forming the grid will be displayed)
-
Select All points to model the entire object, or Points in extent polygon to model only within the selected Extent polygon.
-
Select the location to save the grid.