Finished Jobs
Once a job is finished, it appears in the job list with the Finished status. You can perform the following operations on a finished job:
-
View details
View details about the job including total compute time and DomainMCF machine statistics. Job details appear in the right-hand pane when you highlight a job in the job list by clicking on it. See Viewing DomainMCF machine statistics on this page for detailed information about statistics.
-
Download
You can choose to download the output block model as either a block model file (.bmf) or comma-separated values file (.csv). Alternatively, you can download the trained DomainMCF machine. See Downloading a job on this page for detailed information.
-
Delete
Select one or more jobs in the job list and click
 to delete them.
Note: Deleted jobs still appear in the job list and you can inspect their details, but all other data associated with the job is permanently removed.
Viewing DomainMCF machine statistics
DomainMCF machine statistics provide a way of evaluating the performance of the trained domain model.
-
To view DomainMCF machine statistics, highlight a finished job in the job list, then click
 View Statistics in the DomainMCF machine section of the job details pane.
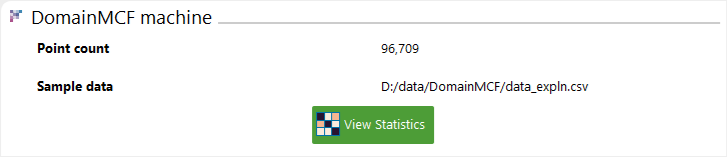
The panel that opens shows the following information:
-
A confusion matrix of domain codes
-
Overall accuracy scores
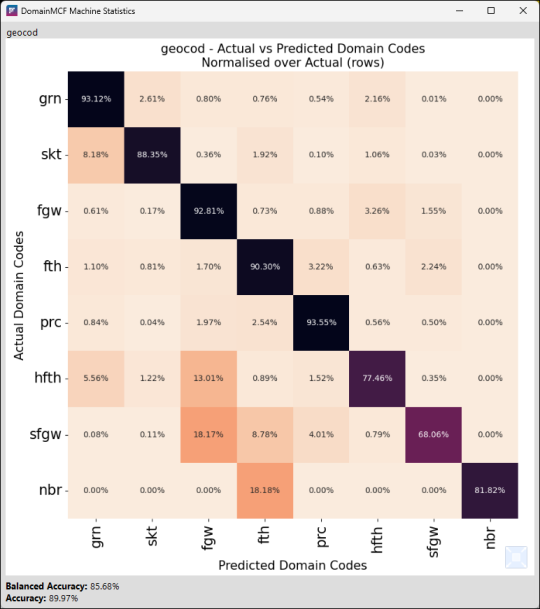
Confusion matrix
The confusion matrix shows for each actual domain code the percentage of sample points that were predicted as a given domain code. Any given cell can be thought of as answering the question “For samples assigned Y domain code in the input data, what percentage were predicted as X domain code by the model?”. These values are normalised over the actual values, indicating that the percentages in each row will sum to 100%. The order of appearance of domains on the Y axis matches that on the X axis, meaning there will usually be a strong diagonal trend from the top left to the bottom right for a well fitted model.
Accuracy scores
Two accuracy scores are provided at the bottom of the panel, defined as follows:
|
Balanced accuracy |
Balanced accuracy is defined as the sum of each individual accuracy score for each domain code, divided by the total number of domain codes. This means that each individual accuracy for each domain code contributes equally to the overall balanced accuracy, irrespective of how represented it is in the data. This is useful for seeing how well the model honours the data used to train it, compensating for bias due to imbalances in the distributions of the provided sample data. |
|
Accuracy |
Accuracy is the proportion of sample points which are correctly predicted. This is useful for seeing how often the neural network honours the data used to train it, without caring about the distribution. |
Interpretation guide
Since these statistics only apply to the data that was used to train the model, they make no strong claims about how well they will predict on unseen data. The value of these statistics is in how well the models fit the known data. This is mostly useful for understanding how the data distribution affects the generated model.
The following are some examples of some insights that can be derived from the provided statistics information:
-
If a domain code is part of the input data, but is never predicted, its corresponding column will be 0% in every cell. If a domain code is never being predicted, it may not be well represented in the data, or it’s being pushed out by surrounding values.
-
If a domain code is often predicted as another domain code, they may be correlated in some way. One possibility is that the two codes may actually be the same but with different names. One may also be underrepresented compared to the other, whilst often being in close proximity to the other.
-
If the difference between the balanced accuracy and the accuracy is significant, then the data is likely imbalanced. This could be due to one domain comprising most of the data, and predicting correctly most of the time, whilst the others are underrepresented and are predicted poorly.
A good way to improve a model is to use these insights to modify the data. This could mean merging similar domain codes, removing underrepresented domain codes, or possibly even adding additional domain codes for finer distinctions (if that makes sense for your use case).
Downloading a job
After a job has finished, you can download the results.
To download a job, select its checkbox in the job list and click the ![]() button. A file dialog will appear, prompting you for a file location in which to save the downloaded results.
button. A file dialog will appear, prompting you for a file location in which to save the downloaded results.
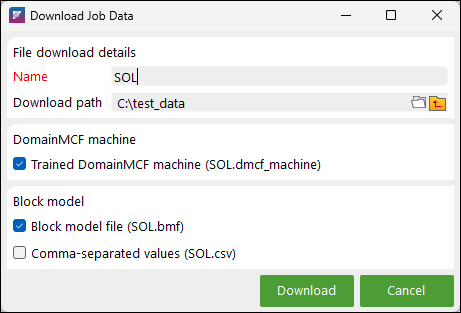
-
Enter a file name for the downloaded file.
-
In the Path to download file(s) field, specify the path to the folder you would like to download the files to.
-
Select the checkboxes next to items you would like to download:
-
Trained DomainMCF machine
-
Block model file
-
Comma-separated values
-
Note: You can only download results from a job in the finished state.
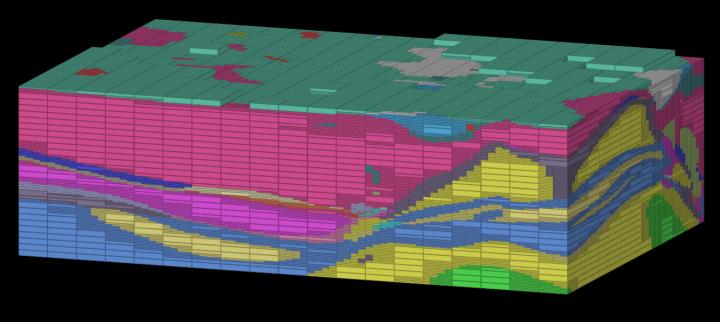
Block model output
The output block model will consist of blocks containing the following attributes:
-
The predicted domain for the block. This attribute will have the same name as originally specified in the input sample data.
-
A domain boundary confidence value. Confidence values are in the range 0–100, where 100 means DomainMCF is 100% certain the domain prediction is correct. Higher confidence values will naturally tend to appear in blocks closer to the original sample data. The domain boundary confidence attribute is named after the original domain attribute, suffixed with _boundary_confidence. For example, if you have a domain attribute named geocod in the input sample data, the domain boundary confidence attribute in the output will be named geocod_boundary_confidence.
-
Grade trends. For each grade attribute specified in the input sample data, a trend value for that grade is computed. Grade trends are named after the original grade attributes, suffixed with _trend. For example, if you have a grade attribute named fe in the input sample data, the grade trend attribute in the output will be named fe_trend.
-
Sample point distance (if generated). This is the distance from the block centroid to the closest point in the sample data. This attribute is named sample_point_distance. This attribute is only included if the Report distance from block centroid to nearest sample point checkbox was selected in the block model output parameters for the job.