GridSurface
GridSurface is an alternative to Surface for representing objects with a surface area. Rather than triangular facets, a grid surface is constructed from a grid of quadrilateral points called cells.
Unlike a Surface, a GridSurface cannot contain holes and cannot have any disconnected components. This restricts what a GridSurface can represent, however they are more compact and simpler which can make it easier to avoid defects.
The points in a GridSurface are arranged into a grid with major_dimension_count rows and minor_dimension_count columns. When creating and editing GridSurfaces, you should be careful to ensure that the points are within the grid.
GridSurface properties
The following is a list of properties and methods that are specific to GridSurface:
GridSurface examples
Constructing a grid surface
The GridSurface constructor requires the following arguments:
-
major_dimension_count— The number of points in each major dimension of the grid. -
minor_dimension_count— The number of points in each minor dimension of the grid.
The major and minor dimension counts determine the size of the grid. Given a major dimension count of X and a minor dimension count of Y, the grid surface will contain an X ✕ Y grid of points defining a (X - 1) ✕ (Y - 1) grid of cells. Once you have created a GridSurface, you cannot change its major and minor dimension counts. This means that its point and cell counts will remain the same.
You can pass the following additional optional arguments to a GridSurface constructor:
-
x_step— The distance between adjacent points in the x direction of the GridSurface. -
y_step— The distance between adjacent points in the y direction of the GridSurface. -
start— The start point to generate the grid of points. The default is the origin ([0, 0, 0]). -
column_major— A boolean value indicating whether the grid is a column major or row major.If
column_majoris set toTrue(column major), the x corresponds to columns and y corresponds to rows. Ifcolumn_majoris set toFalse, the x corresponds to rows and y corresponds to columns. If you omit this property from the constructor, it will automatically be set to false, indicating a row major grid.
Passing the x_step, y_step and start parameters to the GridSurface constructor populates the x and y coordinates of the points of a regular grid with the specified step values.
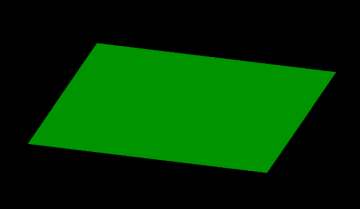
In the example below, we construct a simple, flat GridSurface.
from mapteksdk.project import Project
from mapteksdk.data import GridSurface

project = Project()

with project.new("surfaces/grid", GridSurface(
    major_dimension_count=360,
    minor_dimension_count=360,
    x_step=1, y_step=1, start=[0, 0, 0])) as grid:
    grid
If you run the above code, you should generate an object that looks like this:
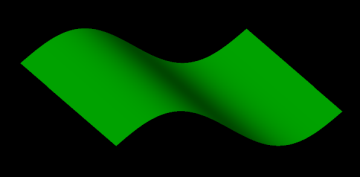
Creating a grid surface with z-coordinates
After you create a GridSurface, you can adjust its elevation by setting the z-coordinates of each point. Keeping the function of setting the z-coordinate separate from setting the point’s x and y coordinates is useful because it saves the script writer the effort of regenerating the x and y coordinates. It is also useful for creating three dimensional representations of equations where the z coordinate is calculated based on the x and y coordinates.
In the example below, we:
-
Copy the
GridSurfacecreated in the previous section. -
Modify the z-coordinate of the copied GridSurface where
z = 40 * sin(x + y). The x and y coordinates are interpreted as the angles in degrees.
from mapteksdk.project import Project
from mapteksdk.data import GridSurface
import numpy

project = Project()

input_path = "/surfaces/grid"
output_path = "/surfaces/sine_grid"

copy = project.copy_object(input_path, output_path)

with project.edit(output_path) as sine_grid:
    theta = numpy.deg2rad(sine_grid.points[:, 1])
    phi = numpy.deg2rad(sine_grid.points[:, 2])
    sine_grid.point_z = numpy.sin(theta + phi)
    # Multiply the z by forty to make it easier to see.
    sine_grid.point_z *= 40
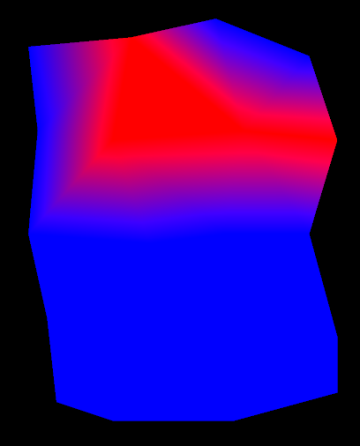
If you run the above code, you should generate an object that looks like this:
Creating irregular grids
The GridSurface class is not limited to storing regular grids. You can use GridSurfaces to represent irregular grids. An irregular grid is a grid where cells are unevenly spaced.
Note: When constructing this type of grid, the x_step, y_step and start parameters should be omitted from the constructor.
The following example demonstrates how to create an irregular grid surface with 5 rows and 4 columns.
from mapteksdk.project import Project
from mapteksdk.data import GridSurface
import numpy

project = Project()

points = numpy.array([
  (0, 4.9, 4.9), (1, 5.1, 4.4), (1.9, 5.1, 3.4), (3, 5, 3),
  (0.1, 4.1, 3.9), (0.9, 4.1, 4.1), (2.1, 4, 2.9), (3.1, 4.1, 2.5),
  (0.1, 3.1, 3.4), (1, 3.1, 3.4), (2, 3, 2.4), (3.1, 3, 2.1),
  (0.1, 1.9, 2.5), (0.9, 2, 2.6), (2, 2.1, 1.9), (3.1, 1.9, 1.4),
  (-0.1, 1, 1.9), (0.9, 0.9, 1.5), (2, 1.1, 1), (3.1, 1.1, 0.9)
])

with project.new("surfaces/irregular_grid", GridSurface(
    major_dimension_count=5,
    minor_dimension_count=4)) as irregular_grid_surface:
  irregular_grid_surface.points = points
If you run the above code, you should generate an object that looks like this:
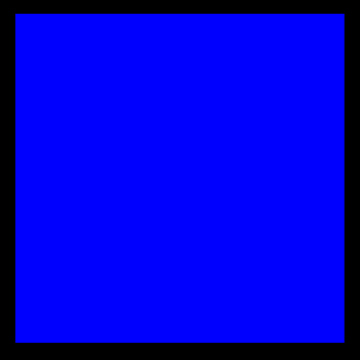
Colouring the points of a GridSurface
You can colour the points of a GridSurface using the point_colours property. The following example demonstrates how to colour the points of a GridSurface by setting all points to a single colour.
from mapteksdk.project import Project
from mapteksdk.data import GridSurface

project = Project()


with project.new("surfaces/grid_single_colour", GridSurface(
    major_dimension_count=5, minor_dimension_count=5,
    x_step=0.5, y_step=0.5
    )) as grid:
    grid.point_colours = [[0,0,255]]
If you run the above code, you will generate an object that looks like this:
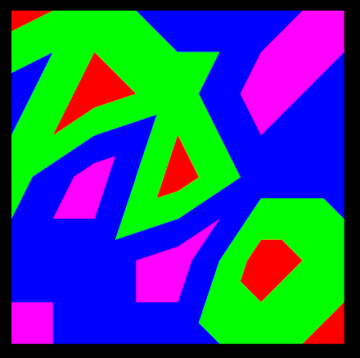
Colouring a GridSurface with a colour map
The easiest way to colour a GridSurface is to use a colour map. The following example shows how to create and apply a colour map to a GridSurface.
from mapteksdk.project import Project
from mapteksdk.data import GridSurface, NumericColourMap

project = Project()

with project.new("legends/numeric_grid_map", NumericColourMap) as colour_map:
  colour_map.interpolated = False
  colour_map.ranges = [-0.5, 0.5, 1.5, 2.5, 3.5]
  colour_map.colours = [[255, 0, 0, 255], [0, 255, 0, 255],
                        [0, 0, 255, 255], [255, 0, 255, 255],
                        [255, 255, 0, 255]]
  colour_map.lower_cutoff = [0, 0, 0, 120]
  colour_map.upper_cutoff = [0, 0, 0, 120]

with project.new("surfaces/grid_numeric_colour_map", GridSurface(
    major_dimension_count=5, minor_dimension_count=5,
    x_step=0.5, y_step=0.5
    )) as grid:
  grid.point_attributes["value"] = [3, 2, 2, 1, 0,
                                    2, 2, 3, 0, 1,
                                    1, 3, 0, 2, 2,
                                    2, 0, 1, 3, 2,
                                    0, 1, 2, 2, 3]
  grid.point_attributes.set_colour_map("value", colour_map)
If you run the above code, you should generate an object that looks like this:
Setting cell visibility
You can set make cells in a GridSurface visible or invisible. The following example demonstrates how to manipulate the visibility of cells in a GridSurface.
from mapteksdk.project import Project
from mapteksdk.data import GridSurface

project = Project()

visibility = [True, True, False, True,
              False, False, True, True,
              True, True, True, False,
              True, False, True, False]

# The negative y step flips the cell network such that the
# 0th row is at the top and the last row is at the bottom.
with project.new("surfaces/grid_cell_visibility", GridSurface(
    major_dimension_count=5, minor_dimension_count=5,
    x_step=1, y_step=-1
    )) as grid:
  grid.cell_visibility = visibility
If your run the above code, you should generate an object that looks like this:
Setting point visibility
You can use the point_visibility property to make the points in a GridSurface visible or invisible. A cell that contains points that are invisible will not appear in the view. We demonstrate this in the example below:
from mapteksdk.project import Project
from mapteksdk.data import GridSurface

project = Project()

visibility = [True, True, False, True, True,
              False, True, True, True, True,
              True, True, True, False, False,
              True, False, True, True, False,
              False, True, True, True, True]

with project.new("surfaces/grid_point_visibility", GridSurface(
    major_dimension_count=5, minor_dimension_count=5,
    x_step=1, y_step=1
    )) as grid:
  grid.point_visibility = visibility
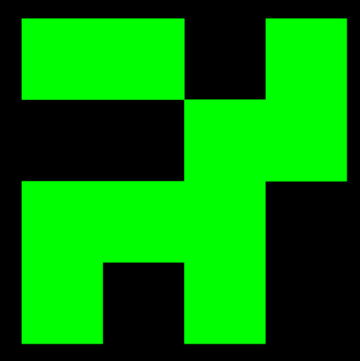
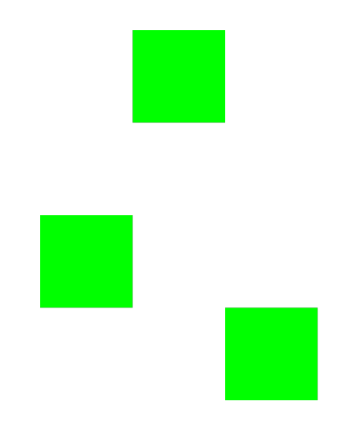
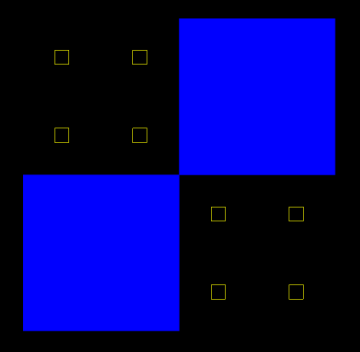
If you run the above code, you will generate an object that looks like this:
If you view the object in points mode (and overlay the above image), it will look like this:
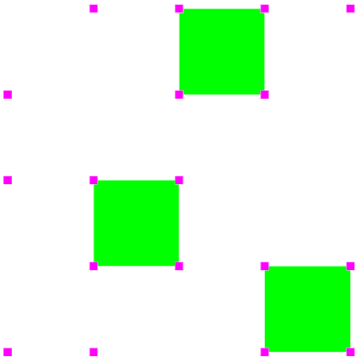
As you can see, every cell that is visible contains four visible corners.
Colouring points using point selection
GridSurfaces support point selection identically to other point-based objects. This allows for scripts to operate on a selection of points of a GridSurface rather than the entire surface. This is demonstrated in the example below where selected points are coloured a single colour.
from mapteksdk.project import Project
from mapteksdk.data import GridSurface
from mapteksdk.pointstudio.operations import object_pick

project = Project()

oid = object_pick(label="Pick a grid surface to colour selected points")

if not oid.is_a(GridSurface):
  raise ValueError("You must pick a GridSurface.")

with project.edit(oid) as grid:
  grid: GridSurface
  grid.point_colours[grid.point_selection] = [221, 160, 221, 255]
Here is an example of the type of object you can generate using the above code:
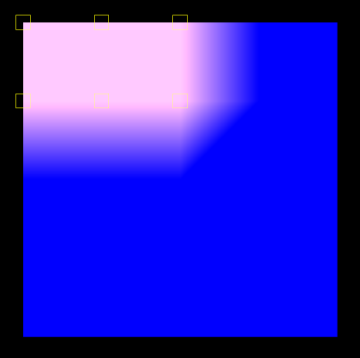
Compare this with the original object selected which was created in the section Colouring the Points of a GridSurface:
Colouring points using cell selection
You can apply operations to a selected number of cells in a GridSurface. In the example below, the selected cells are made invisible.
from mapteksdk.project import Project
from mapteksdk.data import GridSurface
from mapteksdk.pointstudio.operations import object_pick

project = Project()

oid = object_pick(label="Pick a grid surface to hide selected cells")

if not oid.is_a(GridSurface):
  raise ValueError("You must pick a GridSurface.")

with project.edit(oid) as grid:
  grid: GridSurface
  grid.cell_visibility[grid.cell_selection] = False
Here is an example of the type of object you can generate using the above code:
Compare this with the original object selected which was created in the section Colouring the Points of a GridSurface:
Adding cell attributes to a GridSurface
You can create attributes at a cellular level. These are called cell attributes. Every cell shares the same cell attributes. The example below demonstrates:
-
Three different ways to generate cell attributes
-
How to colour the points of the GridSurface based on the cell attributes
import numpy
from mapteksdk.project import Project
from mapteksdk.data import GridSurface

points = numpy.array([
  [[-0.1, 4.9, -0.1], [1, 5, 0.2], [1.9, 5.2, 0], [2.9, 4.8, 0.2]],
  [[0, 4, -0.1], [0.8, 3.9, 0], [2.2, 4, 0.1], [3.2, 3.9, -0.2]],
  [[-0.1, 2.9, 0], [1.2, 2.8, 0], [2, 2.9, 0], [2.9, 2.9, 0.1]],
  [[0.1, 2, 0.1], [1.2, 1.9, 0.2], [2, 1.9, -0.1], [3.2, 1.8, 0]],
  [[0.2, 1.1, -0.2], [0.8, 0.9, 0.1], [2.1, 0.9, -0.2], [3.2, 1.2, 0]]
])

depth = [13.74216711, 6.26654481, 11.17255728, 10.50674182,
         7.96397555, 8.89378882, 12.19867618, 8.01683923,
         5.25515135, 6.55541477, 12.89572386, 12.29907013]

project = Project()

with project.new("surfaces/grid_with_cell_attribute", GridSurface(
    major_dimension_count=points.shape[0],
    minor_dimension_count=points.shape[1])) as grid_surface:
  grid_surface: GridSurface
  grid_surface.cell_points[:] = points

  # Calculate the area of all cells.
  cell_areas = numpy.empty((grid_surface.cell_count), numpy.float64)
  for i, cell in enumerate(grid_surface.cells):
    p0, p1, p2, p3 = grid_surface.points[cell]
    # Assuming the cell is not degenerate the points are like this:
    # p3 o---------o p2
    #    |         |
    #    |         |
    #    |         |
    # p0 o---------o p1

    area = 0

    # The squared length of the diagonals.
    diagonal_1 = numpy.sum(numpy.square(p0 - p2))
    diagonal_2 = numpy.sum(numpy.square(p1 - p3))

    # Calculate the area using the shorter diagonal.
    # This ensures correct results for concave cells.
    # This still gives incorrect values for degenerate cells.
    if diagonal_1 < diagonal_2:
      area += numpy.linalg.norm(numpy.cross(p1 - p0, p2 - p0))
      area += numpy.linalg.norm(numpy.cross(p2 - p0, p3 - p0))
    else:
      area += numpy.linalg.norm(numpy.cross(p0 - p1, p3 - p1))
      area += numpy.linalg.norm(numpy.cross(p2 - p1, p3 - p1))
    area /= 2
    cell_areas[i] = area

  # The depth attribute values are hard-coded into the script.
  grid_surface.cell_attributes["depth"] = depth
  # The area attribute values are calculated based on the geometry.
  grid_surface.cell_attributes["area"] = cell_areas
  # The volume attribute values are calculated based on other attributes.
  grid_surface.cell_attributes["volume"] = (
    grid_surface.cell_attributes["area"]
    * grid_surface.cell_attributes["depth"])

# Colour grid surface points based on cell  attributes
  for i, cell in enumerate(grid_surface.cells):
    a, b, c, d = cell
    cell_volume =  grid_surface.cell_attributes["volume"][i]
    if cell_volume > 7 and cell_volume < 10:
      grid_surface.point_colours[a] = [255,0,0,255]
      grid_surface.point_colours[b] = [255,0,0,255]
      grid_surface.point_colours[c] = [255,0,0,255]
      grid_surface.point_colours[d] = [255,0,0,255]
    else:
      grid_surface.point_colours[a] = [0,0,255,255]
      grid_surface.point_colours[b] = [0,0,255,255]
      grid_surface.point_colours[c] = [0,0,255,255]
      grid_surface.point_colours[d] = [0,0,255,255]
If you run the above code, you will generate an object that looks like this:
The resulting GridSurface from the above code has three cell attributes:
-
Depth where the values are provided by the script.
-
Area where the values are calculated based on the topology of the grid surface.
-
Volume which is calculated based on the other cell attributes — it is the depth multiplied by the area.
Note: The volume is calculated at run-time and not dynamically. This means that if you make a change to the depth or the area cell attributes, the volume will not be updated.
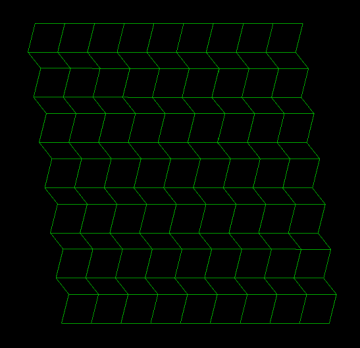
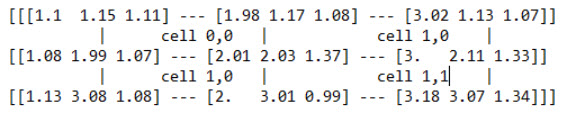
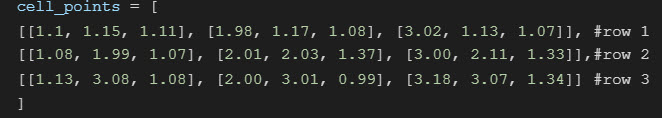
Comparing points and cell points of a GridSurface
You can manipulate a GridSurface by either setting its points or cell points.
Below are two scripts — one that creates a GridSurface using points and one that creates a GridSurface using cell points. Using cell points is the preferred method as it preserves the structure of the GridSurface.
from mapteksdk.project import Project
from mapteksdk.data import GridSurface

project = Project()

with project.new("surfaces/stepped_points", GridSurface(
    major_dimension_count=14, minor_dimension_count=10,
    x_step=1
    )) as grid:
  row_width = grid.minor_dimension_count
  height = 0
  y = 0
  for i, start in enumerate(range(0, grid.point_count, row_width)):
    grid.points[start:start + row_width, 2] = height
    grid.points[start:start + row_width, 1] = y
    if i % 2 == 1:
      height += 1
    else:
      y += 1
from mapteksdk.project import Project
from mapteksdk.data import GridSurface

project = Project()

with project.new("surfaces/stepped_cell_points", GridSurface(
    major_dimension_count=14, minor_dimension_count=10,
    x_step=1
    )) as grid:
  height = 0
  y = 0
  for i, row in enumerate(grid.cell_points):
    row[:, 2] = height
    row[:, 1] = y
    if i % 2 == 1:
      height += 1
    else:
      y += 1
Running one of the above scripts in this section will generate an object that looks like this: