Ellipsoids
Ellipsoids are objects used to control the implicit modeller functionality in Vulcan GeologyCore, though they have other potential uses. The Python SDK allows for creating and editing them programmatically, which is useful for creating many ellipsoids at once.
Basic geometry
The basic geometry of an ellipsoid is defined by its Ellipsoid.centre and Ellipsoid.size properties.
The Ellipsoid.centre property is a single point [X, Y, Z], which defines where the centre of the ellipsoid is located.
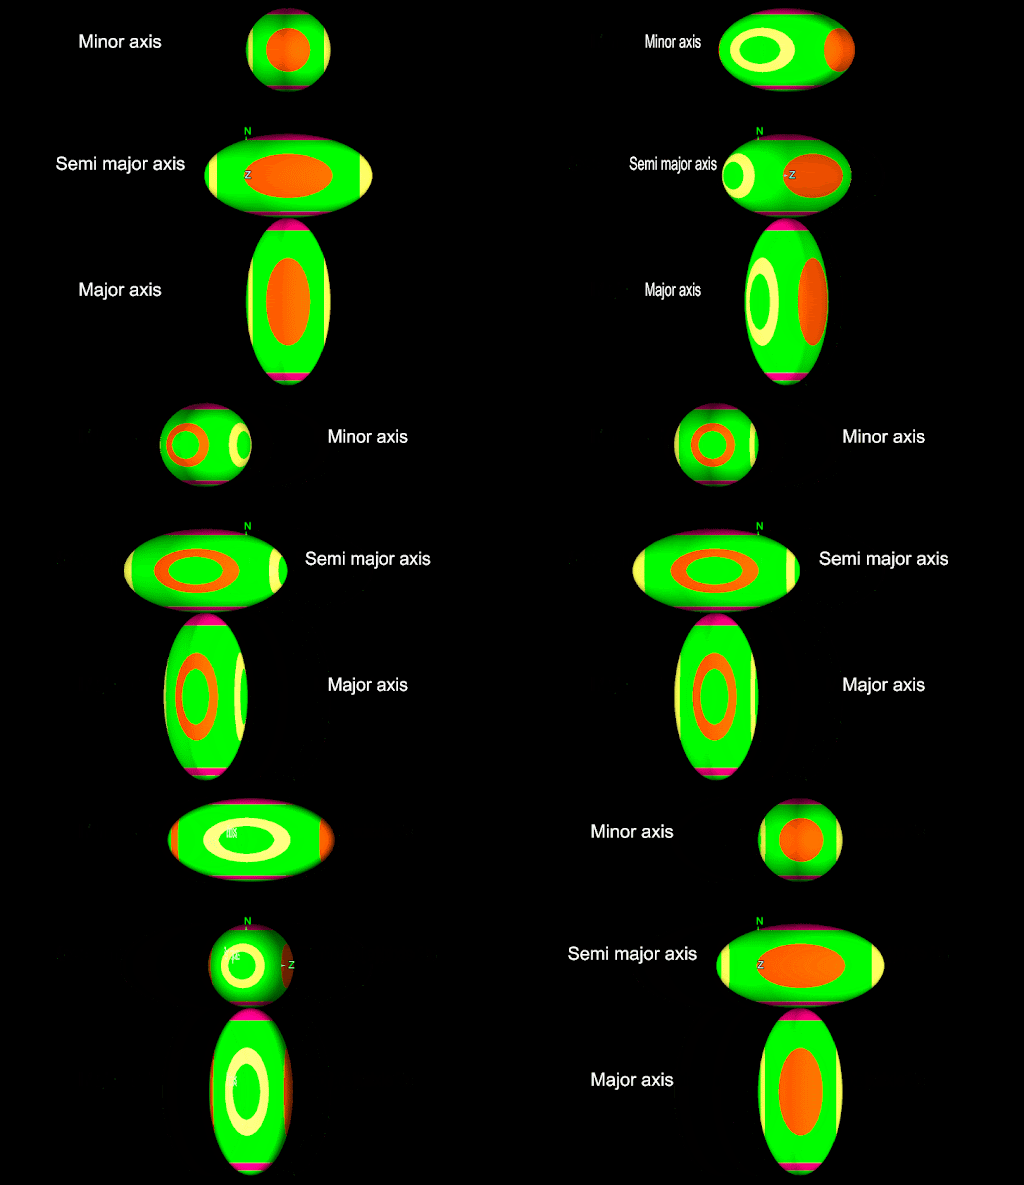
The Ellipsoid.size property defines the shape of the ellipsoid. This is a tuple containing three floating point numbers: the size in the semi-major axis, the size in the major axis, and the size in the minor axis. The following script demonstrates this by creating three ellipsoids each of which is longer in a specific axis:
from __future__ import annotations

from mapteksdk.project import Project
from mapteksdk.data import Ellipsoid, Text3D, HorizontalAlignment
from mapteksdk.operations import open_new_view

if __name__ == "__main__":
    with Project() as project:
        # Dictionary of the name of the axis to the size value
        # required to create an ellipsoid that is twice the
        # size in that axis.
        axes_to_size: dict[str, tuple[float, float, float]] = {
            "major" : (1.0, 2.0, 1.0),
            "semi_major" : (2.0, 1.0, 1.0),
            "minor" : (1.0, 1.0, 2.0)
        }

        items_to_view: list[Ellipsoid | Text3D] = []
        for i, (axis, size) in enumerate(axes_to_size.items()):
            with project.new(f"geotechnical/example/{axis}", Ellipsoid) as ellipsoid:
                ellipsoid.size = size
                ellipsoid.centre = [0, i * 3, 0]

            with project.new(f"geotechnical/example/{axis}_label", Text3D) as label:
                label.text = f"{axis} axis"
                label.location = [-4, i * 3, 0]
                label.size = 0.5
                label.horizontal_alignment = HorizontalAlignment.CENTRED

            items_to_view.append(ellipsoid)
            items_to_view.append(label)

        open_new_view(items_to_view)
 \
\
Ellipsoids by default have the following alignments:
-
The major axis is aligned with the y-axis (north).
-
The semi-major axis is aligned with the x-axis (east).
-
The minor axis is aligned with the z-axis.
If the ellipsoid is rotated (see the next section), the major, semi-major and minor axes may not line up with those (or any) axes.
-
If the size of an ellipsoid is the same in every axis, it will be a sphere.
-
More complicated ellipsoid shapes are possible by having different relative sizes in the three axes.
-
The size in each axis must be greater than zero.
Orientation
The final property that defines the geometry of an ellipsoid is its orientation. Typically this is defined using dip, plunge and bearing. These are defined as follows:
-
Bearing: The rotation about the z-axis. This is between 0 and 2π radians.
-
Plunge: The rotation about the x-axis (east) after the bearing rotation has been applied. This is between -π/2 and π/2 radians.
-
Dip: The rotation about the y-axis (north) after the bearing and plunge rotations have been applied. This is between -π/2 and π/2 radians.
This is demonstrated in the following script, which is very similar to the script in the previous section:
from __future__ import annotations

import math

from mapteksdk.project import Project
from mapteksdk.data import Ellipsoid, Text3D, HorizontalAlignment
from mapteksdk.operations import open_new_view

if __name__ == "__main__":
    with Project() as project:
        # Dictionary of the name of the axis to the size value
        # required to create an ellipsoid that is twice the
        # size in that axis.
        rotations: dict[str, tuple[float, float, float]] = {
            "dip" : (math.pi / 2, 0.0, 0.0),
            "bearing" : (0.0, 0.0, math.pi / 2),
            "plunge" : (0.0, math.pi / 2, 0.0),
        }

        items_to_view: list[Ellipsoid | Text3D] = []
        for i, (name, (dip, plunge, bearing)) in enumerate(rotations.items()):
            with project.new(f"geotechnical/rotation/{name}", Ellipsoid) as ellipsoid:
                ellipsoid.size = (1.0, 2.0, 1.0)
                ellipsoid.set_orientation(dip, plunge, bearing)
                ellipsoid.centre = [0, i * 3, 0]

            with project.new(f"geotechnical/rotation/{name}_label", Text3D) as label:
                label.text = f"{name}=pi/2"
                label.location = [-4, i * 3, 0]
                label.size = 0.5
                label.horizontal_alignment = HorizontalAlignment.CENTRED

            items_to_view.append(ellipsoid)
            items_to_view.append(label)

        open_new_view(items_to_view)
The ellipsoids created by this script are shown in the following animation (which switches from “View from above” to “View from below”).

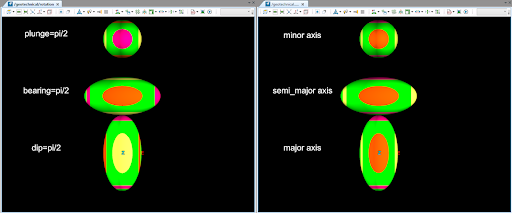
These ellipsoids look very similar to those created by the example in the previous section. However, unlike in the previous section all of the ellipsoids shown in the animation above have the same shape—it is their rotation that differs. This can be seen easily when the two sets of ellipsoids are viewed side by side as shown in the below screenshot.

Notice that the coloured dots allow you to distinguish how the ellipsoid is rotated:
-
In the right-hand image, the orange dot is always facing towards the camera. This indicates that each of those three ellipsoids have the same rotation.
-
In the left hand image, a different dot is facing the camera for each ellipsoid. This shows that each ellipsoid has a different rotation.
-
The pink ring and dot are aligned with the major axis of the ellipsoid.
-
The yellow ring and dot are aligned with the semi major axis of the ellipsoid.
-
The orange ring and dot are aligned with the minor axis of the ellipsoid.
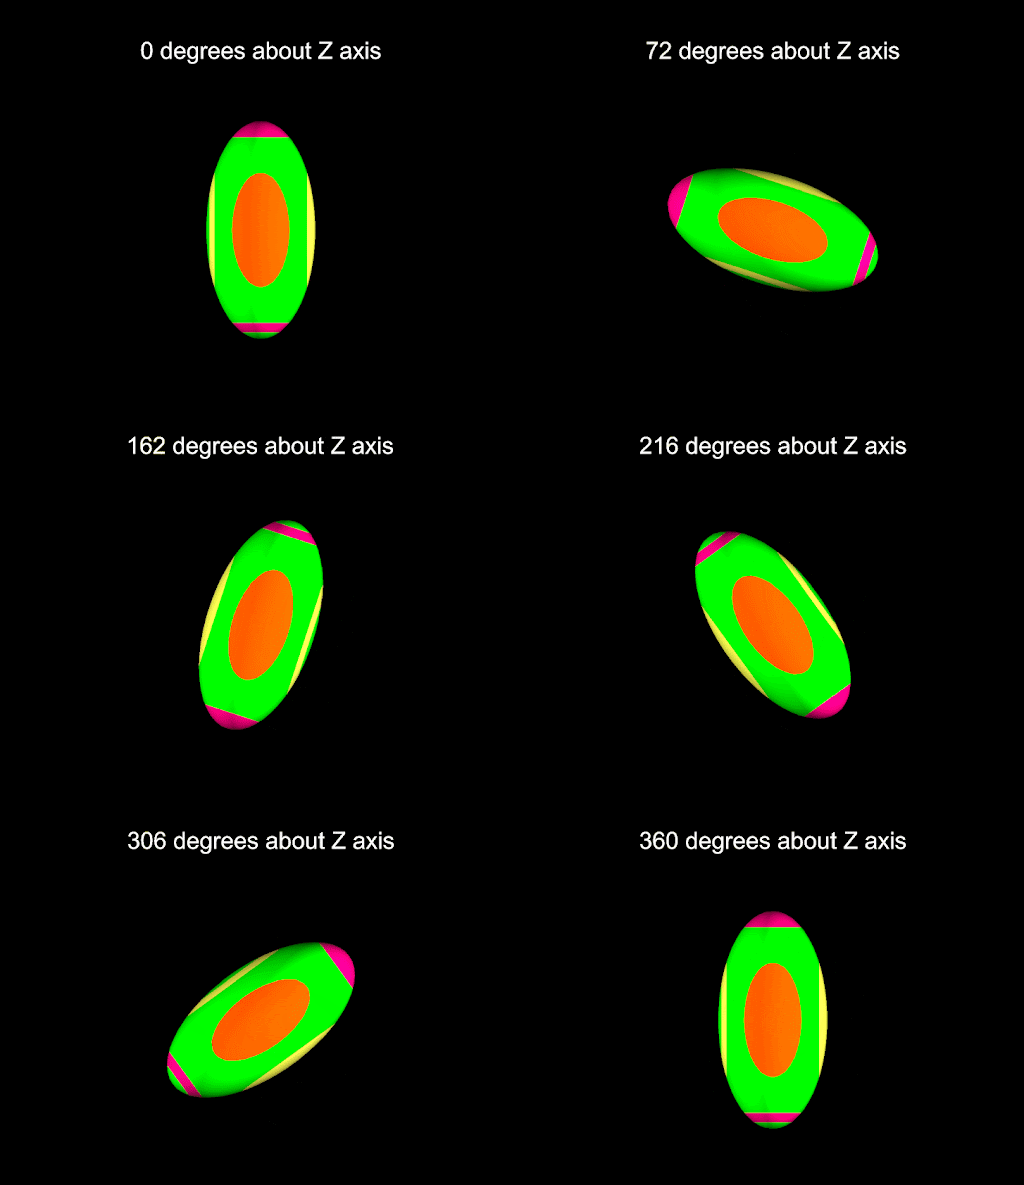
It is also possible to rotate the ellipsoid about specific axes using the rotate functions. For example, the following script rotates an ellipsoid a full 360 degrees around the z-axis using the Ellipsoid.rotate_2d() function:
import math
import time

from mapteksdk.project import Project
from mapteksdk.data import Ellipsoid, Text3D, HorizontalAlignment
from mapteksdk.operations import open_new_view, coordinate_pick

if __name__ == "__main__":
    with Project() as project:
        # The number of steps in the animation.
        steps = 20

        # The size of the step of each animation.
        step_size = 360 // steps

        with project.new("geotechnical/rotate/example", Ellipsoid) as new_ellipsoid:
            new_ellipsoid.centre = [0, 0, 0]
            new_ellipsoid.size = (1.0, 2.0, 1.0)

        with project.new("geotechnical/rotate/label", Text3D) as new_text:
            new_text.text = "0 degrees about Z axis"
            new_text.location = [0, 3, 0]
            new_text.size = 0.5
            new_text.horizontal_alignment = HorizontalAlignment.CENTRED

        open_new_view([new_ellipsoid, new_text])
        # Wait for the user to click to start the animation.
        coordinate_pick(label="Pick anywhere to continue...")

        for i in range(steps):
            with project.edit(new_text.id) as edit_text:
                edit_text.text = f"{(i + 1) * step_size} degrees about Z axis"

            # Rotate the ellipsoid by step_size degrees about the Z axis
            # every step.
            with project.edit(new_ellipsoid.id) as edit_ellipsoid:
                edit_ellipsoid.rotate_2d(math.radians(step_size))

            time.sleep(0.5)
This script is shown in the following animation:

-
The Ellipsoid.rotate() function can be used to rotate the ellipsoid about the x- and y-axes.
-
The Ellipsoid.set_rotation() function can be used to set the ellipsoid’s rotation to a specific angle about the x-, y-, or z-axis.
-
The rotate functions can be useful for adjusting the rotation of an existing ellipsoid.
Colours
The colour of an ellipsoid can be set via the Ellipsoid.colour property. This allows for ellipsoids to be quickly visually distinguished from each other. Ellipsoids only support a single colour, which is used to colour the body of the ellipsoid. The orange, yellow, and red dots and rings used to distinguish the rotation of an ellipsoid cannot be coloured. The following script demonstrates colouring ellipsoids with varying colours:
import itertools

from mapteksdk.project import Project
from mapteksdk.data import Ellipsoid
from mapteksdk.operations import open_new_view

if __name__ == "__main__":
    with Project() as project:
        values = (0, 61, 122, 183, 255)
        ellipsoids = []
        for red, green, blue in itertools.product(values, values, values):
            path = f"geotechnical/colours/{red},{green},{blue}"
            with project.new(path, Ellipsoid) as ellipsoid:
                ellipsoid.centre = [red / 255, green / 255, blue / 255]
                ellipsoid.size = (0.12, 0.12, 0.12)
                ellipsoid.colour = [red, green, blue, 255]
            ellipsoids.append(ellipsoid)
        open_new_view(ellipsoids)
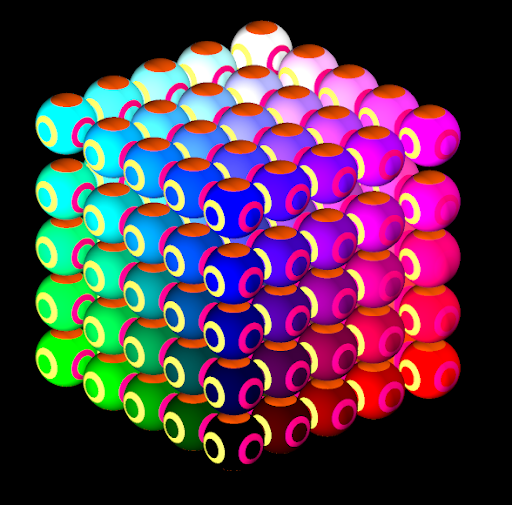
The ellipsoids created by this script are shown in the following screenshot:

In the screenshot, the ellipsoids:
-
Become more red the greater the x value.
-
Become more green the greater the y value.
-
Become more blue the greater the z value.
The ellipsoids created by this script have the same size in every axis, so they appear as spheres.
