Point Sets
A point set is an arbitrary collection of points or 3D coordinates with no connections between them. Most examples on this page relate to point primitives, meaning several of the concepts can also be used on other objects with point primitives like Polyline, Polygon, EdgeNetwork and Surface.
Arbitrary attributes may be applied to the point primitives also, that can be used for analysis, filtering or colouring purposes while using the SDK.
Note: For these examples you will need to download and extract Maptek_PythonSDK_Sample_IO_Files_20200108.zip into a folder.
Some examples in this page use libraries not installed by default.
Libraries referenced:
You may need to install these libraries into your Python environment. To do this, use: python.exe -m pip install library_name
PointSet examples
Creating a point set
from mapteksdk.project import Project
from mapteksdk.data import PointSet
proj = Project() # Connect to default project

with proj.new("scrapbook/my_points", PointSet, overwrite=True) as points:
    points.points = [[0, 1, 0], [0.5, 1, 0.5], [1, 1, 0],
    [0, 0.5, 0.5], [0.5, 0.5, 1], [1, 0.5, 0.5],
    [0, 0, 0], [0.5, 0, 0.5], [1, 0, 0]]
Modifying an existing point set
This example will take a simplified approach to adjusting the point colours from above based on their height. Iterating over each point as shown in the example is easier to understand but will suffer performance issues on large point clouds:
from mapteksdk.project import Project
proj = Project() # Connect to default project

point_path = "scrapbook/my_points"

with proj.edit(point_path) as points:
    # Change colour of each point based on heights 0 = Red, 0.5 = Green, 1 = Blue
    # This is not the most efficient way, but easiest to understand
    for i in range(points.point_count):
        point = points.points[i] # [x, y, z] -> x = 0, y = 1, z = 2
        if point[2] < 0.5:
            # Z is less than 0.5, colour the point Red
            points.point_colours[i] = [255, 0, 0, 255]
        elif point[2] > 0.5:
            # Z is more than 0.5, colour the point Blue
            points.point_colours[i] = [0, 0, 255, 255]
        else:
            # Z is 0.5, colour the point Green
            points.point_colours[i] = [0, 255, 0, 255]

Colouring a point set with a single colour
from mapteksdk.project import Project
proj = Project() # Connect to default project

point_path = "scrapbook/my_points"

with proj.edit(point_path) as points:
    # Could the PointSet a single colour
    # With colour and boolean arrays in the SDK, you can use
    # a single value to assign to all (e.g. array = [255, 255, 255, (Alpha=255)] or array = [False] )
    points.point_colours = [255, 0, 0]
Note: Several examples from here on will use imported data, found in the archive linked at the top of this page.
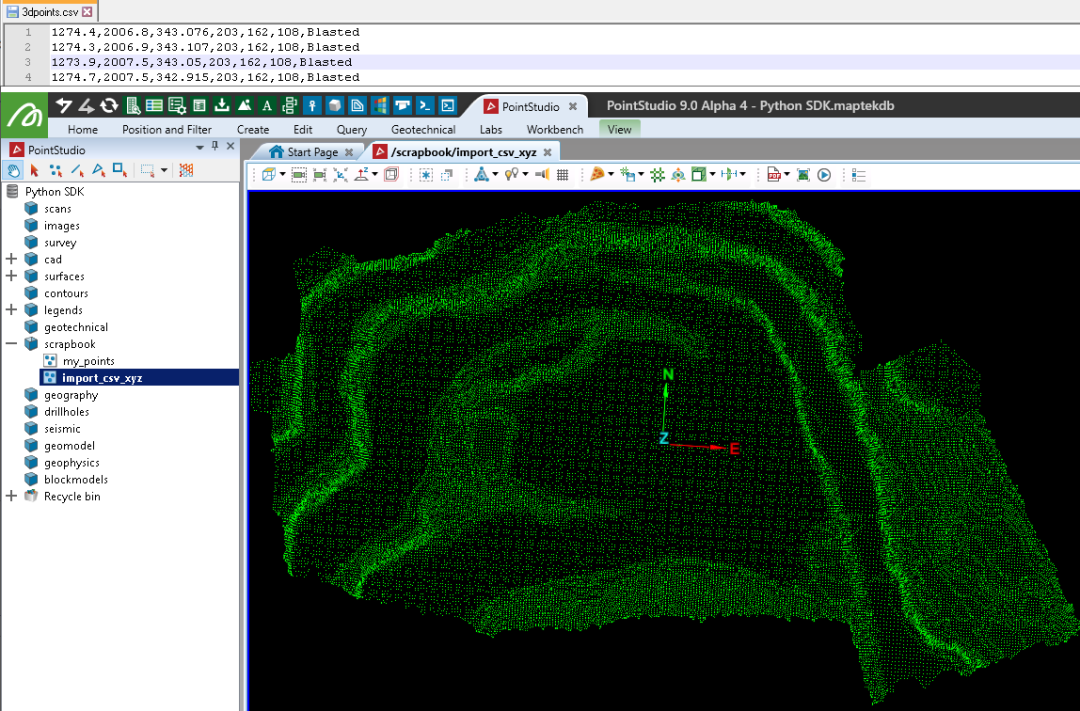
Creating a point set from a CSV file
This example demonstrates importing a CSV (3dpoints.csv from sample data) to a PointSet object. The CSV file contains columns x,y,z,r,g,b,attribute. Only the x,y,z portions of the CSV file will be imported in this example:
from mapteksdk.project import Project
from mapteksdk.data import PointSet
from numpy import genfromtxt

proj = Project() # Connect to default project
# Path to where you've saved the sample data:
csv_path = "F:/Python SDK Help/data/3dpoints.csv"
point_path = "scrapbook/import_csv_xyz"

with proj.new(point_path, PointSet, overwrite=True) as points:
    # Use numpy.getfromtxt to read the csv
    csv_data = genfromtxt(csv_path, delimiter=',')
    # Extract columns x,y,z=0,1,2 (0:3) from csv_data and assign to points:
    points.points = csv_data[0:, 0:3]
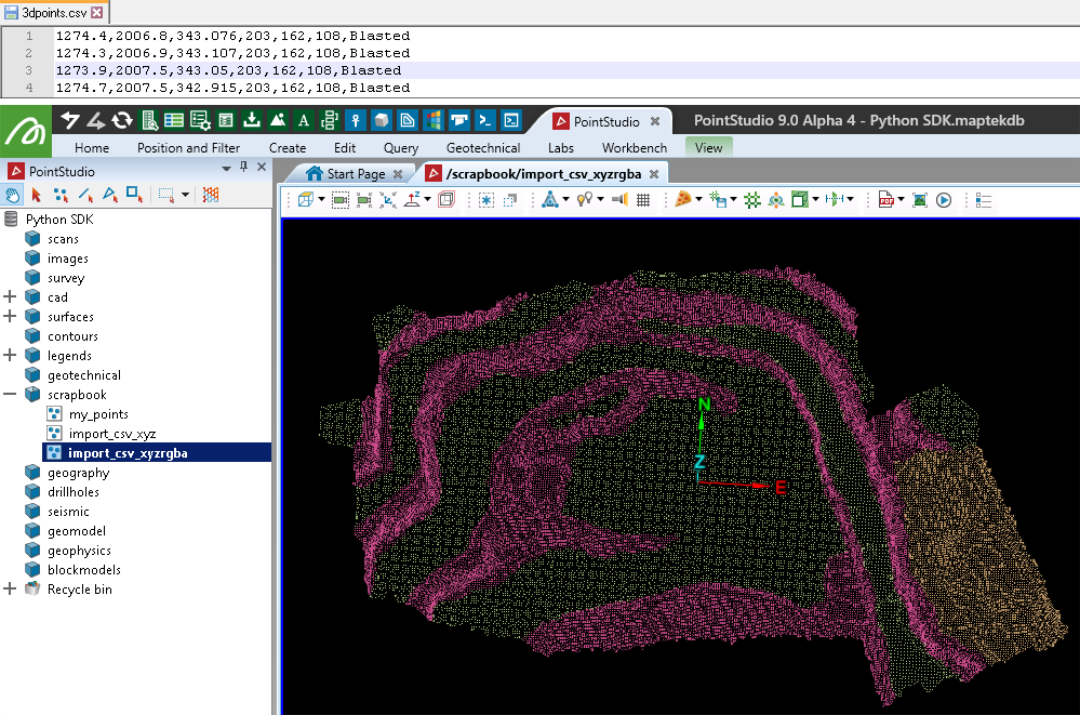
Creating a point set from a CSV file with points and colours
This builds on the previous example by also importing RGB (red, green, blue) values from the same CSV file to colour the points:
from mapteksdk.project import Project
from mapteksdk.data import PointSet
import numpy as np
from numpy import genfromtxt

proj = Project() # Connect to default project
# Path to where you've saved the sample data:
csv_path = "F:/Python SDK Help/data/3dpoints.csv"
point_path = "scrapbook/import_csv_xyzrgba"

with proj.new(point_path, PointSet, overwrite=True) as points:
    # Use numpy.getfromtxt to read the csv
    csv_data = genfromtxt(csv_path, delimiter=',')
    # Extract columns x,y,z=0,1,2 (0:3) from csv_data and assign to points:
    points.points = csv_data[0:, 0:3]
    # Extract columns r,g,b=3,4,5 (3:6) from csv_data and assign to point_colours:
    points.point_colours = csv_data[0:, 3:6]
    # Note: Colour arrays support input of both [[R,G,B],] or [[R,G,B,A],]
Creating a point set from a CSV file with points, colours, and attributes
This builds on the last example by importing the final CSV column containing a string attribute for each point.
Due to non-numeric data requirements, this example will use pandas for reading the CSV file instead of NumPy in the previous examples.
Note: The primitive attributes demonstrated here are not usable with software user tools like Filter > Attributes. However they can be used for Python work and generally used with colour maps (legends) and 'custom text' file exports from within the software.
from mapteksdk.project import Project
from mapteksdk.data import PointSet
import pandas as pd
import numpy as np

proj = Project() # Connect to default project
# Path to where you've saved the sample data:
csv_path = "F:/Python SDK Help/data/3dpoints.csv"
point_path = "scrapbook/import_csv_xyzrgba_attribute"

with proj.new(point_path, PointSet, overwrite=True) as points:
    # Use numpy.getfromtxt to read the csv
    csv_data = pd.read_csv(csv_path,
                           delimiter=',',
                           # No headers have been provided in the csv:
                           names=["X","Y","Z","R","G","B","Description"])

    # Extract columns X, Y, Z from csv_data and assign to points:
    points.points = csv_data[['X', 'Y', 'Z']]

    # Insert an alpha column and fill it ready for creating R,G,B,A arrays:
    csv_data["A"] = 255 # 0 = transparent >> 255 = opaque
    # Extract columns R, G, B, A from csv_data and assign to point_colours:
    points.point_colours = csv_data[['R', 'G', 'B', 'A']]

    ############################################################################
    # Assign Attributes
    ############################################################################
    # NOTE: The points and point_colours arrays are not committed to the backend
    #       until exiting the with scope. Attributes are stored directly
    #       to the backend (needing points/primitives to exist before doing so),
    #       so we need to either exit the .new() scope and enter a .edit() scope
    #       before assigning attributes, or run .save() to commit changes.
    ############################################################################
    points.save() # Commit changes above to backend before assigning attributes

    ############################################################################
    # Attribute style: Array of string values with Attribute name 'Description'
    # E.g. Attribute 'Description' = 'Blasted' or 'Ground' or 'Wall'

    string_array = np.array(csv_data["Description"], dtype=str)
    points.save_point_attribute("Description", string_array)

    ############################################################################
    # Attribute style: Array of booleans with Attribute name of the value
    # E.g. Attribute 'Blasted' = True/False, 'Ground' = True/False, 'Wall' = True/False

    # The csv contains 3 unique values 'Blasted', 'Ground', 'Wall'
    unique_values = csv_data["Description"].unique()
    for value in unique_values:
        # Create a column called 'Blasted', 'Ground', 'Wall' of booleans
        # True representing where they existed in the Description column
        csv_data[value] = csv_data["Description"] == value
        points.save_point_attribute(value, np.array(csv_data[value], dtype=bool))
    print("Wrote attributes for: {}".format(points.point_attributes.names))
Colouring a point set by points above height
Building on previous examples, this example assumes the point set scrapbook/import_csv_xyzrgba_attribute exists.
from mapteksdk.project import Project
import numpy as np

proj = Project() # Connect to default project
point_path = "scrapbook/import_csv_xyzrgba_attribute"
colour_above_height = 329.0 # Colour points above Z 239.0
colour_to_use = [200, 200, 200]

with proj.edit(point_path) as points:
    # Slow version, suitable for small point counts:
    for i in range(points.point_count):
        if points.points[i][2] > colour_above_height:
            points.point_colours[i] = colour_to_use

    # Faster version, suitable for large point counts:
    # Get indices of all points with z above height
    over_height = np.where(points.points[:, 2] > colour_above_height)
    # Colour selected indices
    points.point_colours[over_height] = colour_to_use
Editing a point set as a pandas dataframe
The PointSet class includes functions for representing the point set as a dataframe, including properties for X, Y, Z, R, G, B, A, Visible, Selected. Object representation as a pandas dataframe provides for confident prototyping and experimentation.
This example assumes the point set scrapbook/import_csv_xyz exists and will recolour all points read, within a height range.
from mapteksdk.project import Project
proj = Project() # Connect to default project

point_path = "scrapbook/import_csv_xyz"
min_height = 320
max_height = 330

with proj.edit(point_path) as points:
    # Get a pandas dataframe representation of the PointSet
    with points.dataframe(save_changes=True) as df:
        # Columns provided: X, Y, Z, R, G, B, A, Selected, Visible
        # Colour all points Red that are between min_heigh and max_height
        indices_to_colour = df.loc[(df['Z'] < max_height) & (df['Z'] > min_height)].index
        df['R'][indices_to_colour] = 255
        df['G'][indices_to_colour] = 0
        df['B'][indices_to_colour] = 0
Snapping a point set to a grid using pandas
This example assumes the point set scrapbook/import_csv_xyz exists. It makes a copy of that object then snaps all points to the nearest 3 m XY grid.
import numpy as np
from mapteksdk.project import Project
proj = Project() # Connect to default project

point_path = "scrapbook/import_csv_xyz"
copy = proj.copy_object(point_path, "{}_grid_snap".format(point_path), overwrite=True)
cell_size = 3 # snap to 3m grid

with proj.edit(copy) as points:
    # Get a pandas dataframe representation of the PointSet
    with points.dataframe(save_changes=True) as df:
        # Columns provided: X, Y, Z, R, G, B, A, Selected, Visible
        df["X"] = np.round(df['X']/cell_size)*cell_size
        df["Y"] = np.round(df['Y']/cell_size)*cell_size
        # Remove duplicate points snapped to same horizontal position
        df.drop_duplicates(subset=('X','Y'), inplace=True)
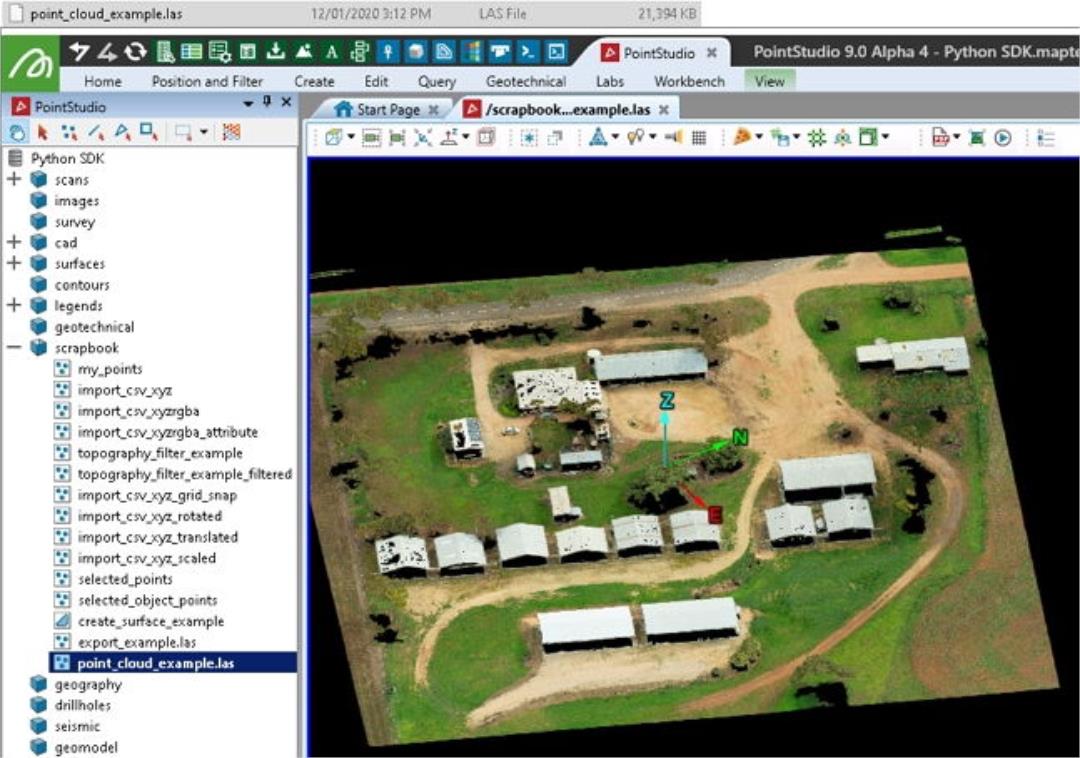
Creating a point set from a LAS file
The following example demonstrates reading a LAS file with colour and creating a point set with its data. The file referred to (point_cloud_example.las) is included with the same data linked at the top of the page.
Important: This makes use of the laspy library, which is not included by default with Python. You may need to install it before trying the script.
import os
import numpy as np
import laspy
from mapteksdk.project import Project
from mapteksdk.data import PointSet
from mapteksdk.data.points import PointProperties

proj = Project() # Connect to default project
las_file = r"F:\Python SDK Help\data\point_cloud_example.las"

# Import las format:
with laspy.file.File(las_file, mode="r") as lasfile:
    # Setup valid arrays for storing in a PointSet
    las_points = np.column_stack((lasfile.x, lasfile.y, lasfile.z))

    # Read colour data and prepare it for storing:
    # If the colours have been stored in 16 bit, we'll need to get the first 8 bits for a proper value
    colours_are_16bit = np.max(lasfile.red) > 255
    red = np.right_shift(lasfile.red, 8).astype(np.uint8) if colours_are_16bit else lasfile.red
    green = np.right_shift(lasfile.green, 8).astype(np.uint8) if colours_are_16bit else lasfile.green
    blue = np.right_shift(lasfile.blue, 8).astype(np.uint8) if colours_are_16bit else lasfile.blue
    # Create rgba array
    las_colours = np.column_stack((red, green, blue))

    # Create PointSet object and populate data
    import_as = "scrapbook/{}".format(os.path.basename(las_file))

    with proj.new(import_as, PointSet, overwrite=True) as points:
        points.points, points.point_colours = (las_points, las_colours)
Exporting a point set to a LAS file
The following example demonstrates combining points from one or more objects (that have point primitives) and exporting them to a LAS file.
Important: This makes use of the laspy library, which is not included by default with Python. You may need to install it before trying the script.
import os
import numpy as np
import laspy
from mapteksdk.project import Project
from mapteksdk.data import Surface
proj = Project() # Connect to default project

save_as = os.path.abspath("export_example.las")

# Temporarily store points and colours in these arrays
all_points = np.empty([0,3], dtype=np.float64)
all_colours = np.empty([0,4], dtype=np.uint8)

for item in proj.get_selected():
    with proj.read(item) as obj:
        if hasattr(obj, 'points'):
            # Append visible points from obj to buffer object
            # Use .point_selection to get indices for all True values from the selection array
            all_points =  np.vstack((all_points, obj.points[obj.point_visibility]))
            all_colours = np.vstack((all_colours, obj.point_colours[obj.point_visibility]))

if len(all_points) > 0:
    print("Writing {} points to {}".format(len(all_points), save_as))
    if os.path.exists(save_as):
        os.remove(save_as)
    # https://laspy.readthedocs.io/en/latest/tut_background.html
    header = laspy.header.Header(point_format=2, format = 1.3)
    with laspy.file.File(save_as, mode="w", header=header) as lasfile:
        lasfile.header.format = 1.3
        lasfile.header.point_format = 2
        lasfile.header.scale = [1.0,1.0,1.0]
        lasfile.header.offset = [0.0, 0.0, 0.0]
        lasfile.header.max = np.max(all_points,axis=0).ravel() # [max x, max y, max z]
        lasfile.header.min = np.min(all_points,axis=0).ravel() # [min x, min y, min z]
        lasfile.x, lasfile.y, lasfile.z = (all_points[:, 0], all_points[:, 1], all_points[:, 2])
        lasfile.red, lasfile.green, lasfile.blue = (all_colours[:, 0], all_colours[:, 1], all_colours[:, 2])

    print("Wrote file {}".format(save_as))
else:
    print("Selected objects contained no points")
Generating statistics from point selection
Generates some basic statistics on X,Y,Z,R,G,B values of a selection of points.
from mapteksdk.project import Project
from mapteksdk.data import PointSet
from mapteksdk.data.points import PointProperties
import numpy as np
import pandas as pd
proj = Project() # Connect to default project

save_as = "scrapbook/selected_points"
proj.delete(save_as)
# Temporarily store points and colours in these arrays
all_points = np.empty([0,3], dtype=np.float64)
all_colours = np.empty([0,4], dtype=np.uint8)

for item in proj.get_selected():
    with proj.read(item) as obj:
        if hasattr(obj, 'points'):
            # Append points from obj to buffer object
            # Use .point_selection to get indices for all True values from the selection array
            all_points =  np.vstack((all_points, obj.points[obj.point_selection]))
            all_colours = np.vstack((all_colours, obj.point_colours[obj.point_selection]))

df = pd.DataFrame(np.column_stack((all_points, all_colours[:, 0:3])),
                  columns=["X","Y","Z","R","G","B"])
pd.set_option('precision', 0)
print(df.describe())

# Example output:
#>>           X      Y      Z      R      G      B
#>> count  51478  51478  51478  51478  51478  51478
#>> mean     992   1002    993     88    109     45
#>> std       56     49      6     21     21     13
#>> min      894    891    987      9     19      2
#>> 25%      962    973    989     73     93     36
#>> 50%      986    994    990     87    111     44
#>> 75%     1037   1038    995    102    125     53
#>> max     1100   1093   1009    214    208    144
Colouring a point set by height with a colour map
This examples illustrates creation of a basic colour map, setting all z values of points as an attribute and applying the colour map to the points.
from mapteksdk.data import NumericColourMap
from mapteksdk.project import Project, PointSet
import numpy as np
proj = Project() # Connect to default project

# Create simple colour map
with proj.new("legends/colourmap_interp", NumericColourMap, overwrite=True) as new_legend:
    # Define an arbitrary number of ranges to apply colours between
    new_legend.ranges = [300, 330, 360]
    # Define equal number of colours to interpolate between
    new_legend.colours = [[0, 255, 0], # Blue
                          [255, 255, 255], # White
                          [0, 0, 255]] # Green
    # Define colours to use for values outside the given ranges
    new_legend.lower_cutoff = [128, 128, 128]
    new_legend.upper_cutoff = [128, 128, 128]
    # Keep the id for reference below
    legend = new_legend.id

# Colour selected items by height
for item in proj.get_selected():
    # Check if the object type is one we'd want to do this with
    if item.is_a(PointSet):
        with proj.edit(item) as obj:
            # Take the column of z values from the points array
            z = obj.points[:,2]
            # Save the values against a new point attribute 'z'
            obj.point_attributes.save_attribute("z", z)
            # Apply the colour map created above against that attribute
            obj.point_attributes.set_colour_map("z", legend)
Filtering a point set by height
This example will use the point_visibility array from PointProperties to apply a filter at multiple heights. As the points aren't being deleted they can be recovered using Filter > Show All in the software, or by resetting the visibility array.
from mapteksdk.data import NumericColourMap
from mapteksdk.project import Project, PointSet
import numpy as np
proj = Project() # Connect to default project

# Colour selected items by height
for item in proj.get_selected():
    # Check if the object type is one we'd want to do this with
    if item.is_a(PointSet):
        with proj.edit(item) as obj:
            # Take the column of z values from the points array
            z = obj.points[:,2]
            # Apply a numpy mask to the point_visiblity array
            # i.e. boolean array based on conditions that can be applied
            # directly to the visibility array which is a boolean array
            # This will keep points visible between heights 300-320 and 340-360
            obj.point_visibility = True # Reset the array
            obj.point_visibility[((z > 320) & (z < 325) | (z > 335) & (z < 340))] = False
Rotating a point set
This example rotates a point set using its centroid as the origin, rotated on a 2D plane around the z-axis by 90 degrees. The rotation matrix is computed using the scipy.spatial.transform.Rotation module. This example assumes the point set scrapbook/import_csv_xyz exists.
from mapteksdk.project import Project
import numpy as np
from scipy.spatial.transform import Rotation

proj = Project() # Connect to default project

point_path = "scrapbook/import_csv_xyz"
copy = proj.copy_object(point_path, "{}_rotated".format(point_path), overwrite=True)

rotate_by_degrees = 90
with proj.edit(copy) as points:
    origin = np.mean(points.points, axis=0)
    # Get a rotation matrix, about z axis at 0,0,0 by rotate_by_degrees
    rotation = Rotation.from_euler(
        'z', # Rotate around z axis
        -(rotate_by_degrees), # Rotate counter-clockwise by this amount
        degrees=True # Rotation provided in degrees
        )
    # Shift points to 0,0,0 (-origin), apply rotation, shift points back to origin
    points.points = rotation.apply(points.points - origin) + origin
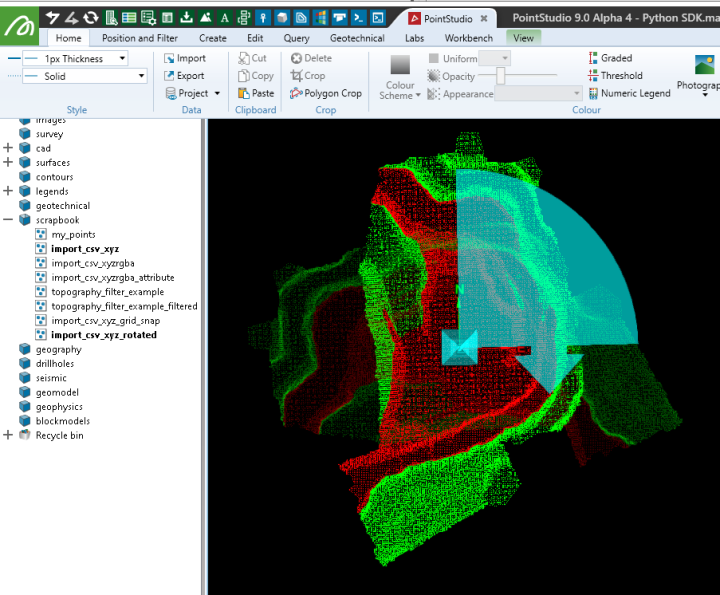
This is equivalent to using the following settings with the rotate tool in the software:
![]()
Translating a point set
This example assumes the point set scrapbook/import_csv_xyz exists. It applies a translation vector to a copy of the object.
from mapteksdk.project import Project
proj = Project() # Connect to default project

point_path = "scrapbook/import_csv_xyz"
copy = proj.copy_object(point_path, "{}_translated".format(point_path), overwrite=True)

translate_by = [0, 0, 50] # translate in z by +50

with proj.edit(copy) as points:
    # Add translation vector to point array
    points.points += translate_by
![]()
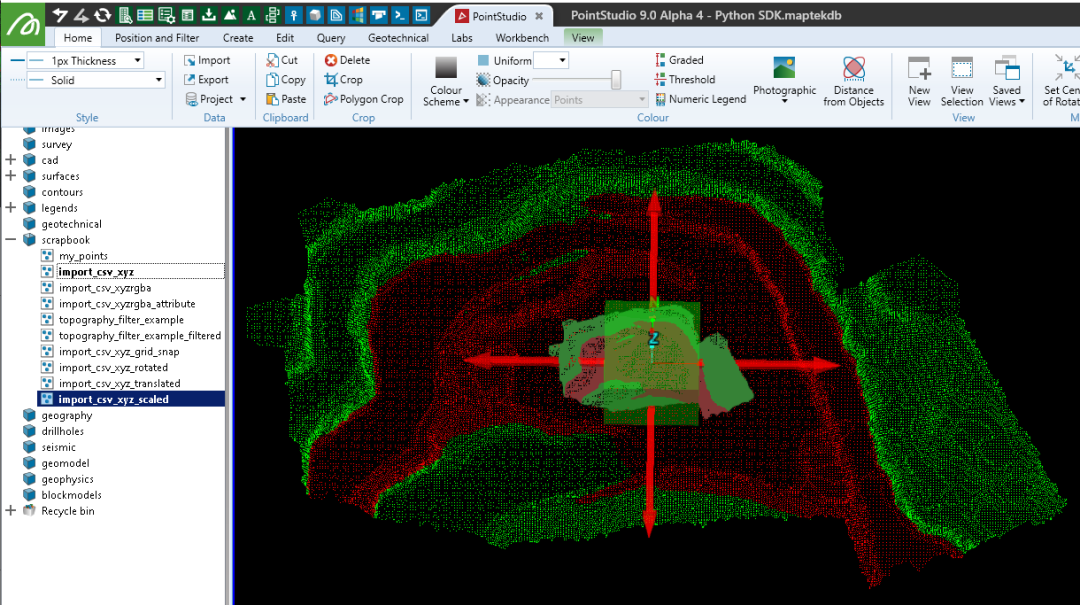
Scaling a point set
This example assumes the point set scrapbook/import_csv_xyz exists.
from mapteksdk.project import Project
import numpy as np

proj = Project() # Connect to default project

point_path = "scrapbook/import_csv_xyz"
copy = proj.copy_object(point_path, "{}_scaled".format(point_path), overwrite=True)

scale_by = [4, 4, 2] # Scale X by 4x, Y by 4x, Z by 2x

with proj.edit(copy) as points:
    # Get centroid to use as scale origin
    origin = np.mean(points.points, axis=0)
    # Shift points to 0,0,0 (-origin), apply scale, shift points back to origin
    points.points = np.array(scale_by) * (points.points - origin) + origin
Hiding a point selection
This example assumes a point set has been selected, with point primitives selected. This will replace the current visibility status of all points to be visible, unless currently selected.
from mapteksdk.project import Project
from mapteksdk.data import PointSet
import numpy as np
proj = Project() # Connect to default project

for item in proj.get_selected():
    if item.is_a(PointSet):
        with proj.edit(item) as points:
            # Visibility and Selected arrays are of equal length and type
            # To hide the selected points we simply apply the opposite
            # of the selection array to the visibility array.

            # This would also cause any currently hidden points to be shown.
            points.point_visibility = np.logical_not(points.point_selection)

            # Clear the point selection
            points.point_selection = [False]
Hiding a point selection using logical OR
This example assumes a point set has been selected, with point primitives selected. This hide the selected points and keep any already hidden points hidden.
from mapteksdk.project import Project
from mapteksdk.data import PointSet
import numpy as np
proj = Project() # Connect to default project

for item in proj.get_selected():
    if item.is_a(PointSet):
        with proj.edit(item) as points:
            # Visible = False when Visible == False or Selected == True
            # Use np.logical_or() to consider already invisible items + Selected
            # Use np.logical_not() to switch True/False on arrays
            points.point_visibility = np.logical_not(
                np.logical_or(
                points.point_selection, # True if selected, or
                np.logical_not(points.point_visibility) # True if already hidden
                )
            )

            # Clear the point selection
            points.point_selection = [False]
Deleting a point selection
While using visibility masks is preferred for data integrity and rolling back changes (and deleting of points may not be possible with some objects), it introduces complexity when performing operations over an array. For example, if building a triangulating from a range of selected objects with hidden or filtered points, it may not be desirable to include the hidden points in the result.
This example permanently removes the selected points from the point set:
from mapteksdk.project import Project
from mapteksdk.data import PointSet
import numpy as np
proj = Project() # Connect to default project

for item in proj.get_selected():
        with proj.edit(item) as points:
            # This will be compatible with any object supporting points, including surfaces
            if(hasattr(points, 'points')):
                # np.where() will return an array of indices from the selection array
                points.remove_points(np.where(points.point_selection))

            # .remove_points(), .remove_edges(), .remove_facets()
            # support single index and arrays of indices.
            # Changes are immediately committed to the backend and
            # selection, visibility and colour arrays are maintained
Creating a point set from all points in all supported selected objects
This example extracts all points from all selected objects that have points. This allows us to check if each object has point primitives that can be read without opening it first and checking attributes and without exception handling. Similar could be done with edges and facets (on objects that have them):
from mapteksdk.project import Project
from mapteksdk.data import PointSet, Topology
import numpy as np
proj = Project() # Connect to default project

save_as = "scrapbook/selected_object_points"
# Temporarily store points and colours in these arrays
all_points = np.empty([0,3], dtype=np.float64)
all_colours = np.empty([0,4], dtype=np.uint8)

for item in proj.get_selected():
    # Check if the object has point primitives without opening it
    if item.is_a(Topology):
        with proj.read(item) as obj:
            # Check if the object has points
            if not hasattr(obj, 'points'): continue
            # Append points from obj to buffer object
            all_points = np.vstack((all_points, obj.points))
            all_colours = np.vstack((all_colours, obj.point_colours))

with proj.new(save_as, PointSet, overwrite=True) as points:
    points.points = all_points
    points.point_colours = all_colours
Creating a point set from all selected points within all supported objects
from mapteksdk.project import Project
from mapteksdk.data import PointSet
import numpy as np
proj = Project() # Connect to default project

save_as = "scrapbook/selected_points"
# Temporarily store points and colours in these arrays
all_points = np.empty([0,3], dtype=np.float64)
all_colours = np.empty([0,4], dtype=np.uint8)

for item in proj.get_selected():
    with proj.read(item) as obj:
        # Check if it is an object with point attributes
        if hasattr(obj, 'points'):
            # Append points from obj to buffer object
            # Use .point_selection to get indices for all True values from the selection array
            all_points =  np.vstack((all_points, obj.points[obj.point_selection]))
            all_colours = np.vstack((all_colours, obj.point_colours[obj.point_selection]))

            # Note: to perform the opposite (copy not-selected points) you could use:
            #  all_points =  np.vstack((all_points, obj.points[np.logical_not(obj.point_selection)]))
            #  all_colours =  np.vstack((all_colours, obj.point_colours[np.logical_not(obj.point_selection)]))

with proj.new(save_as, PointSet, overwrite=True) as points:
    points.points = all_points
    points.point_colours = all_colours
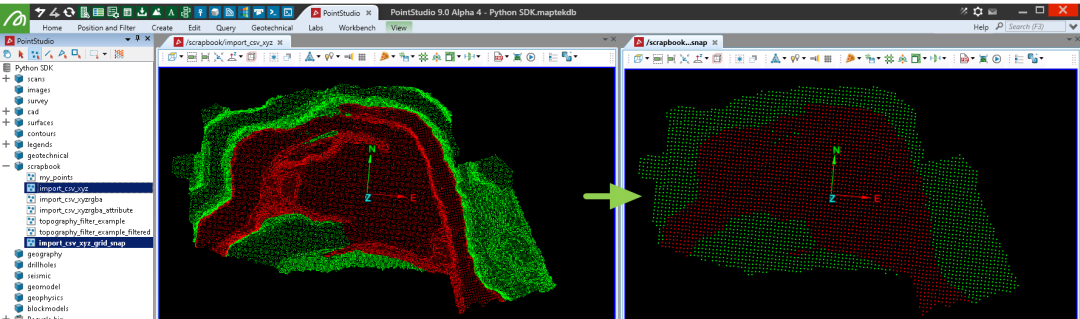
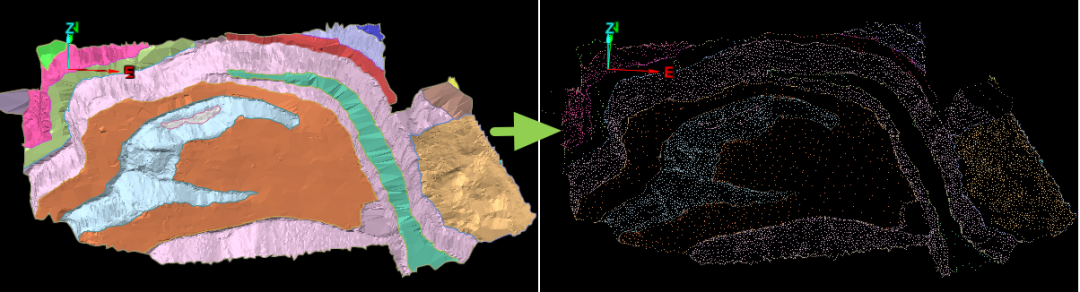
Filtering a point set by topography
This example demonstrates a Python approach to the Topography Filter tool provided in PointStudio. The topography filter divides the point data into a horizontal grid with a defined cell size. Only the single lowest or highest point in the cell is retained.
This example imports data from the sample set topography_filter_example.csv, then filters it.
import numpy as np
import pandas as pd
from mapteksdk.data import PointSet
from mapteksdk.project import Project
from numpy import genfromtxt

def topography_filter(points_object, cell_size=1, lowest=True, count_to_keep=1):
  """Topography filter example

     Parameters
     ----------
     points_object (PointSet): PointSet object open for editing
     cell_size (float): Size of cell to filter within
     lowest (tribool): True = keep lowest, False = keep highest, None = Some of both
     count_to_keep (int): Number of points to keep within the cell
  """
  # For filtering performance, sort the point data by height
  sorted_indices = points_object.points[:, 2].argsort() # sort by z
  points_object.points = points_object.points[sorted_indices]
  points_object.point_colours = points_object.point_colours[sorted_indices]
  points_object.point_visibility = points_object.point_visibility[sorted_indices]

  # Create a grid around the data by snapping X and Y values into grid
  filter_pts = pd.DataFrame(points_object.points, columns=['X', 'Y', 'Z'])
  filter_pts["X_Grid"] = np.round(filter_pts['X']/cell_size)*cell_size
  filter_pts["Y_Grid"] = np.round(filter_pts['Y']/cell_size)*cell_size

  # Get the highest or lowest (count_to_keep) points within each cell
  if lowest is True:
    # Get a list of point indices from the filter that match the original
    # dataset indices.  Use of head/tail assumes that the data is sorted
    filtered_indices = filter_pts.groupby(['X_Grid', 'Y_Grid'])['Z'].head(
      count_to_keep).index
  elif lowest is False:
    filtered_indices = filter_pts.groupby(['X_Grid', 'Y_Grid'])['Z'].tail(
      count_to_keep).index
  else:
    # keep some high and some low
    filtered_indices_low = filter_pts.groupby(['X_Grid', 'Y_Grid'])['Z'].head(
      count_to_keep).index
    keep_top = count_to_keep*0.25
    filtered_indices_high = filter_pts.groupby(['X_Grid', 'Y_Grid'])['Z'].tail(
      keep_top).index
    filtered_indices = np.unique(np.concatenate(
      (filtered_indices_low, filtered_indices_high), 0))

  # Set point visibility array to match the filter mask
  points_object.point_visibility = np.isin(filter_pts.index, filtered_indices)

def import_and_copy(project, csv_path, destination, copy_suffix = "_filtered"):
    # Extract columns x,y,z=0,1,2 (0:3) from csv_data and assign to points:
    csv_data = genfromtxt(csv_path, delimiter=',')
    with proj.new(destination, PointSet, overwrite=True) as points:
        points.points = csv_data[0:, 0:3]
    # Once committed, we can get the object path from .id.path
    copy_path = "{}{}".format(points.id.path, copy_suffix)
    proj.delete(copy_path) # delete if already exists
    # Copy and return id of the copied version
    return proj.copy_object(points.id, copy_path)

if __name__ == "__main__":
    proj = Project() # Connect to default project

    import_as = "scrapbook/topography_filter_example"
    csv_path = r"F:\Python SDK Help\data\topography_filter_example.csv"
    points_to_filter = import_and_copy(proj, csv_path, import_as)
    # Run the filter
    cell_size = 1.5
    with proj.edit(points_to_filter) as points:
        topography_filter(points, cell_size)
Illustrated below is the imported object on the left and filtered copy on the right:
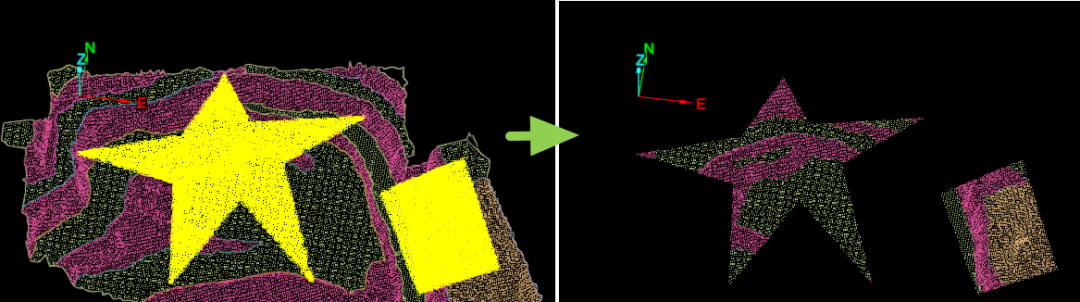
Filtering a point set by colour similarity to selection
This example gets the current selection of points on all selected objects, assesses the colour range, then filters similarly coloured points in all the selected objects. The script remains running until instructed to stop.
from mapteksdk.project import Project
import numpy as np
import math
proj = Project() # Connect to default project

end_filter = False
while not end_filter:
    # Temporarily store points and colours in these arrays
    selected_colours = np.empty([0,3], dtype=np.uint8)

    for item in proj.get_selected():
        # Get colours from selected points
        with proj.read(item) as obj:
            if hasattr(obj, 'points'):
                selected_colours = np.vstack((selected_colours, obj.point_colours[obj.point_selection, 0:3]))

        # Filter selected objects by those colours
        if len(selected_colours) > 0:
            # Get colour range by mean +/- std.dev:
            sel_reds = selected_colours[:,0]
            sel_greens = selected_colours[:,1]
            sel_blues = selected_colours[:,2]
            st_dev_multiplier = 1.8 # Increases aggression of filter
            r_std, g_std, b_std = np.std(sel_reds)*st_dev_multiplier, np.std(sel_greens)*st_dev_multiplier, np.std(sel_blues)*st_dev_multiplier
            r_mean, g_mean, b_mean = np.mean(sel_reds), np.mean(sel_greens), np.mean(sel_blues)
            r_min, g_min, b_min = math.floor(r_mean - r_std), math.floor(g_mean - g_std), math.floor(b_mean - b_std)
            r_max, g_max, b_max = math.ceil(r_mean + r_std), math.ceil(g_mean + g_std), math.ceil(b_mean + b_std)
            print("Filtering points with:\n\tRed {} to {}\n\tGreen {} to {}\n\tBlue {} to {}".format(
                r_min, r_max, g_min, g_max, b_min, b_max
            ))

            for item in proj.get_selected():
                with proj.edit(item) as points:
                    if hasattr(points, 'points'):
                        # Faster method:
                        red, green, blue = (points.point_colours[:,0], points.point_colours[:,1], points.point_colours[:,2])
                        filtered_points = np.where((
                            (red > r_min) & (red < r_max)
                            & (green > g_min) & (green < g_max)
                            & (blue > b_min) & (blue < b_max)
                            ))
                        points.point_visibility[filtered_points] = False
                        points.point_selection[:] = False # Clear selection
        else:
            print("No suitable objects/selection found for filtering. Try selecting some points to filter by.")
    if input("\n-----------\n\nRun filter again? y/n\n\n").lower() == "n":
        end_filter = True
