Ribbons
Ribbons are objects used to control the shape of an implicit model. There are two types of ribbons: ribbon chains and ribbon loops, which are analogous to polylines and polygons, respectively. In fact, the SDK type RibbonChain is based on Polyline, and RibbonLoop is based on Polygon. The additional properties of point widths and point angles provides these abstractions with their ribbonlike characteristics.
Point widths
The point widths of a ribbon loop or chain determines the width of the ribbon at each point. The greater the value of the width, the wider the ribbon will be at that point. For example, the following script:
from mapteksdk.project import Project
from mapteksdk.data import RibbonChain
from mapteksdk.operations import open_new_view

if __name__ == "__main__":
    with Project() as project:
	    with project.new("cad/ribbon_chain_width", RibbonChain) as ribbon:
            ribbon.points = [
                [0, 0, 0], [2, 2, 0], [4, 0, 0], [6, 2, 0], [8, 0, 0], [10, 1, 0]
            ]
            ribbon.point_widths = [0.0, 0.5, 0.75, 0.75, 0.5, 0.0]
           ribbon.front_colour = [255, 255, 0, 255]
           open_new_view([ribbon])
creates the following ribbon chain:
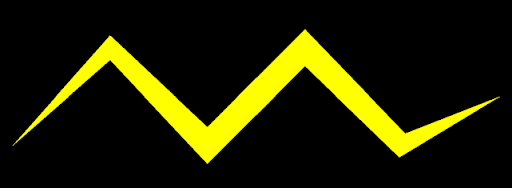
Observe the following:
-
The points are connected by edges just like a Polyline.
-
The first point is on the far right hand side and the last point is on the left hand side.
-
The width of the ribbon changes uniformly over the length of each edge.
-
At point 0, the width is 0.0.
-
The width increases linearly to 0.5 between point 0 and point 1.
-
The width then increases at a slower pace from 0.5 to 0.75 between points 1 and 2.
-
Points 2 and 3 have the same width, so the ribbon stays the same width between those two points.
-
The width then decreases from 0.75 to 0.5 between points 3 and 4.
-
Finally, the width decreases more rapidly from 0.5 back to 0.0 between points 4 and 5.
-
Note: An error will be raised if the width of the ribbon at any point is less than zero.
Point Angles
The point angles define the angle of the ribbon at each point. An angle of 0.0 (The default) indicates that the ribbon faces directly upwards (i.e. in the Z direction). An angle greater than zero indicates the ribbon is rotated to the right and an angle less than zero indicates the ribbon is rotated to the left. This is demonstrated by the following script:
import math
from mapteksdk.project import Project
from mapteksdk.data import RibbonChain
from mapteksdk.operations import open_new_view

if __name__ == "__main__":
    with Project() as project:
    with project.new("cad/ribbon_angles", RibbonChain) as ribbon:
    ribbon.points = [
        [0, 0, 0], [0, 1, 0], [0, 2, 0], [0, 3, 0], [0, 4, 0], [0, 5, 0],
        [0, 6, 0], [0, 7, 0], [0, 8, 0]
    ]
    # Set the width at every point to 0.75
    ribbon.point_widths = 0.75
    ribbon.point_angles = [
        -math.pi,
        -math.pi * 0.75,
        -math.pi / 2,
        -math.pi / 4,
        0.0,
        math.pi / 4,
        math.pi / 2,
        math.pi * 0.75,
        math.pi
    ]
    ribbon.front_colour = [255, 255, 0, 255]
    open_new_view([ribbon])
which creates the following ribbon (animation shows switching between “View from top” and “View from bottom”):
-
Each value in RibbonLoop.point_angles is the angle at that point. The angle of the ribbon linearly transitions from the angle at the first point to the angle of the second point across the edge.
-
This ribbon does a full 360 degree turn. An angle of pi is equivalent to an angle of -pi. No error is raised if the angles are outside of this range.
-
The angles are stored in radians. To specify them in degrees, use
numpy.deg2rad()ormath.radians().
Point width and point angles
The previous examples only set the point widths or the point angles. By setting both the point widths and angles it is possible to represent more complex ribbons. This is demonstrated by the following script:
import math
from mapteksdk.project import Project
from mapteksdk.data import RibbonChain
from mapteksdk.operations import open_new_view

if __name__ == "__main__":
    with Project() as project:
    with project.new("cad/ribbon_chain_angles_width", RibbonChain) as ribbon:
    ribbon.points = [
        [0, 0, 0], [2, 2, 1], [4, 0, 2], [6, 2, 3], [8, 0, 4], [10, 1, 5]
    ]
    ribbon.point_widths = [0.0, 0.5, 0.75, 1.0, 1.25, 1.5]
    ribbon.point_angles = [
        -math.pi / 2, -math.pi / 4, 0.0, 0.0, math.pi / 4, math.pi / 2
    ]
    ribbon.front_colour = [255, 255, 0, 255]
    open_new_view([ribbon])
which creates the following ribbon chain (animated by switching between viewing from the left to viewing from the right):
Both the width and the angles change over each edge, allowing for the more complicated shape to be created.
Ribbon loop
A RibbonLoop is to a RibbonChain what a Polygon is to a Polyline. Essentially, a RibbonLoop is a RibbonChain with an additional edge between the first and last points. For example, the following script creates a RibbonLoop shaped like a hexagon:
from mapteksdk.project import Project
from mapteksdk.data import RibbonLoop
import numpy as np

def circular_points(point_count: int, radius: float) -> np.ndarray:
"""Generate an array containing circular points.

Parameters
----------
point_count
The number of points in the returned array.
radius
The radius of the circle the points lie.

Returns
-------
np.ndarray
An array of shape (point_count, 3) with points following
the equation:
(sin(theta) * radius, cos(theta) * radius, 0)
"""
points = np.empty((point_count, 3), dtype=np.float64)

# The x coordinates.
points[:, 0] = np.linspace(0, np.pi * 2, point_count)
np.sin(points[:, 0], out=points[:, 0])
points[:, 0] *= radius

# The y coordinates.
points[:, 1] = np.linspace(0, np.pi * 2, point_count)
np.cos(points[:, 1], out=points[:, 1])
points[:, 1] *= radius

# The z coordinates.
points[:, 2] = 0

return points

if __name__ == "__main__":
    with Project() as project:
        with project.new("cad/loop_example", RibbonLoop) as ribbon:
            ribbon.points = circular_points(6, 5.0)
            ribbon.point_widths = 0.85
            ribbon.point_angles = -np.pi / 2
The ribbon loop is shown below:
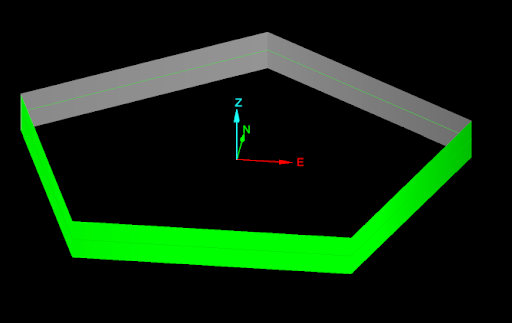
Note: Varying the point_count parameter passed to the circular_points function allows for generating other polygons. For example, 4 would give a square, 5 a pentagon and 12 a dodecagon.
Tip: Ribbon loops are the same as ribbon chains except they have an extra edge between the first and last points. This makes them more appropriate for representing closed loops.
Two sided colouring (advanced)
Ribbons can be coloured using the RibbonChain.front_colour and RibbonChain.back_colour properties. RibbonChain.front_colour determines what colour is used to colour the front of the ribbon, and RibbonChain.back_colour determines what colour is used for the back of the ribbon. For example, the following example is the same as the ribbon in Ribbon loop above, but the front of the ribbon is coloured orange and the back is coloured cyan:
from mapteksdk.project import Project
from mapteksdk.data import RibbonLoop
from mapteksdk.operations import open_new_view
import numpy as np

def circular_points(point_count: int, radius: float) -> np.ndarray:
    """Generate an array containing circular points.

    Parameters
    ----------
    point_count
    The number of points in the returned array.
    radius
    The radius of the circle the points lie.

    Returns
    -------
    np.ndarray
    An array of shape (point_count, 3) with points following
    the equation:
    (sin(theta) * radius, cos(theta) * radius, 0)
    """
    points = np.empty((point_count, 3), dtype=np.float64)

    # The x coordinates.
    points[:, 0] = np.linspace(0, np.pi * 2, point_count)
    np.sin(points[:, 0], out=points[:, 0])
    points[:, 0] *= radius

    # The y coordinates.
    points[:, 1] = np.linspace(0, np.pi * 2, point_count)
    np.cos(points[:, 1], out=points[:, 1])
    points[:, 1] *= radius

    # The z coordinates.
    points[:, 2] = 0

    return points

if __name__ == "__main__":
    with Project() as project:
        with project.new("cad/two_sided_loop", RibbonLoop) as ribbon:
            ribbon.points = circular_points(6, 5.0)
            ribbon.point_widths = 0.85
            ribbon.point_angles = -np.pi / 2
            ribbon.front_colour = [255, 165, 0, 255]
            ribbon.back_colour = [0, 255, 255]
        open_new_view(ribbon.id)
This script creates the following ribbon:
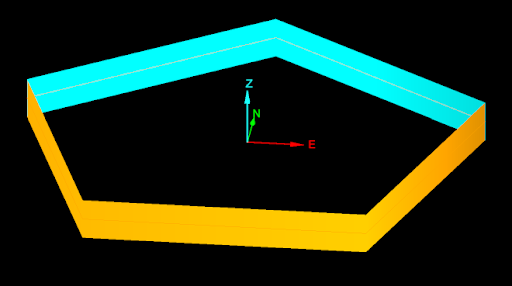
-
Ribbons only support a single colour for the front and back. They do not support per-point colours.
-
RibbonChain.back_colour does not have an alpha component. It shares the alpha with the front colour.
-
The default back colour is grey.
