Grid Surfaces
A grid surface is an alternative to a regular triangle-based surface for representing objects with a surface area. Rather than triangular facets, a grid surface is constructed from a grid of quadrilateral points called cells. Grid surfaces are represented in the SDK with the GridSurface class.
Unlike a regular surface, a grid surface cannot contain holes and cannot have any disconnected components. This restricts what a grid surface can represent; however, they are more compact and simpler, which can make it easier to avoid defects.
The points in a GridSurface object are arranged into a grid with GridSurface.major_dimension_count rows and GridSurface.minor_dimension_count columns.
GridSurface properties
The following is a list of properties and methods that are specific to GridSurface:
|
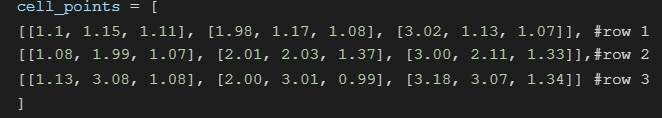
Access the cell points of a GridSurface . Note the subtle difference between points and cell_points. Cell points are rearranged into the underlying grid structure, allowing points to be referenced by row and column rather than by index. To access a point in a specific row and column, use the notation
|
|
Access the colour for each cell point in a GridSurface. Note the distinction between a point and a cell point (see above). |
|
Access the visibility for a cell to either True or False. Unlike the cell_visibility property, this allows you to select cells via row and column rather than index. |
|
Access the selection for each cell point to either True or False. |
|
Access the visibility for each cell point to either True or False. |
Grid surface examples
The following examples demonstrate how to create and interact with grid surfaces.
Constructing a grid surface
The GridSurface constructor requires the following arguments:
-
major_dimension_count: The number of points in each major dimension of the grid -
minor_dimension_count: The number of points in each minor dimension of the grid
The major and minor dimension counts determine the size of the grid. Given a major dimension count of X and a minor dimension count of Y, the grid surface will contain an X ✕ Y grid of points defining a (X - 1) ✕ (Y - 1) grid of cells. Once you have created a GridSurface object, you cannot change its major and minor dimension counts. This means that its point and cell counts will remain the same.
You can pass the following additional optional arguments to a GridSurface constructor:
-
x_step: The distance between adjacent points in the x direction of the grid surface. -
y_step: The distance between adjacent points in the y direction of the grid surface. -
start: The start point to generate the grid of points. The default is the origin ([0, 0, 0]). -
column_major: A boolean value indicating whether the grid is a column major or row major.If
column_majoris set toTrue(column major), the x corresponds to columns and y corresponds to rows. Ifcolumn_majoris set toFalse, the x corresponds to rows and y corresponds to columns. If you omit this property from the constructor, it will automatically be set to false, indicating a row major grid.
Passing the x_step, y_step and start parameters to the GridSurface constructor populates the x and y coordinates of the points of a regular grid with the specified step values.
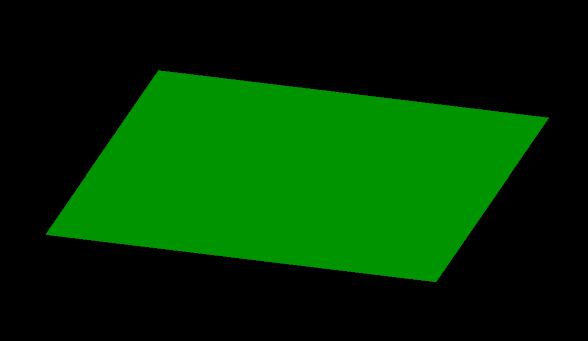
In the example below, we construct a simple, flat grid surface.
from mapteksdk.project import Project
from mapteksdk.data import GridSurface

project = Project()

with project.new("surfaces/grid", GridSurface(
    major_dimension_count=360,
    minor_dimension_count=360,
    x_step=1, y_step=1, start=[0, 0, 0])) as grid:
    grid
Running this script generates an object that looks like this:
Creating a grid surface with z-coordinates
After you create a grid surface, you can adjust its elevation by setting the z-coordinate of each point. This approach keeps the setting of z-coordinates separate from setting the x and y coordinates, saving script writers from having to regenerate x and y coordinates. It is also useful for creating three-dimensional representations of equations where the z-coordinate is calculated from the x and y coordinates.
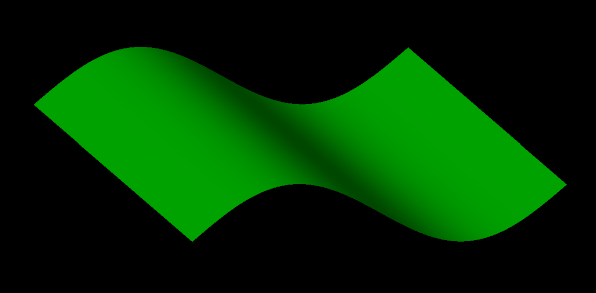
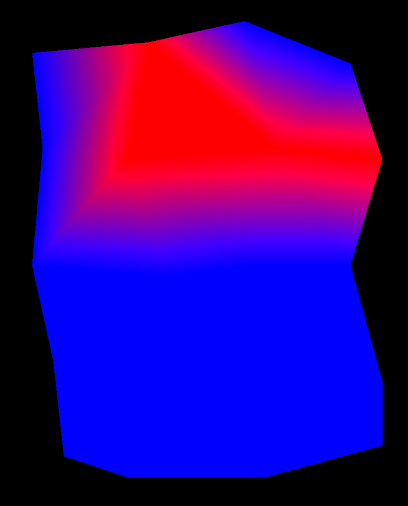
In the example below, we first copy the GridSurface object created in the previous example. Then, we modify the z-coordinate of the copied grid surface to z = 40 * sin(x + y). The x and y coordinates are interpreted as the angles in degrees.
from mapteksdk.project import Project
import numpy

project = Project()

input_path = "/surfaces/grid"
output_path = "/surfaces/sine_grid"

copy = project.copy_object(input_path, output_path)

with project.edit(output_path) as sine_grid:
    theta = numpy.deg2rad(sine_grid.points[:, 1])
    phi = numpy.deg2rad(sine_grid.points[:, 2])
    sine_grid.point_z = numpy.sin(theta + phi)
    # Multiply the z by forty to make it easier to see.
    sine_grid.point_z *= 40
Running this script results in an object that looks like this:
Creating irregular grids
The GridSurface class can also represent irregular grids, where cells are unevenly spaced.
Note: When constructing this type of grid, the x_step, y_step and start parameters should be omitted from the constructor.
The following example demonstrates how to create an irregular grid surface with 5 rows and 4 columns.
from mapteksdk.project import Project
from mapteksdk.data import GridSurface
import numpy

project = Project()

points = numpy.array([
  (0, 4.9, 4.9), (1, 5.1, 4.4), (1.9, 5.1, 3.4), (3, 5, 3),
  (0.1, 4.1, 3.9), (0.9, 4.1, 4.1), (2.1, 4, 2.9), (3.1, 4.1, 2.5),
  (0.1, 3.1, 3.4), (1, 3.1, 3.4), (2, 3, 2.4), (3.1, 3, 2.1),
  (0.1, 1.9, 2.5), (0.9, 2, 2.6), (2, 2.1, 1.9), (3.1, 1.9, 1.4),
  (-0.1, 1, 1.9), (0.9, 0.9, 1.5), (2, 1.1, 1), (3.1, 1.1, 0.9)
])

with project.new("surfaces/irregular_grid", GridSurface(
    major_dimension_count=5,
    minor_dimension_count=4)) as irregular_grid_surface:
  irregular_grid_surface.points = points
Running this script creates an object that looks like this:
Colouring the points of a grid surface
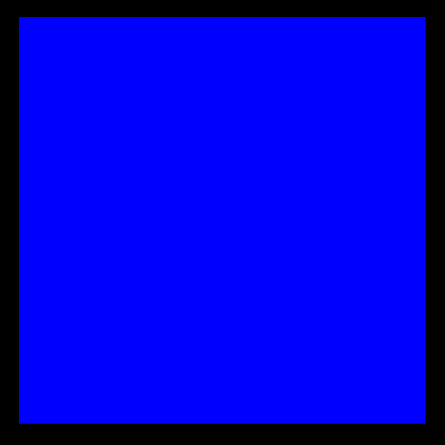
You can colour the points of a GridSurface object using the point_colours property. The following example demonstrates how to colour the points of a grid surface by setting all points to a single colour.
from mapteksdk.project import Project
from mapteksdk.data import GridSurface

project = Project()


with project.new("surfaces/grid_single_colour", GridSurface(
    major_dimension_count=5, minor_dimension_count=5,
    x_step=0.5, y_step=0.5
    )) as grid:
    grid.point_colours = [[0,0,255]]
Running this script creates an object that looks like this:
Colouring a grid surface with a colour map
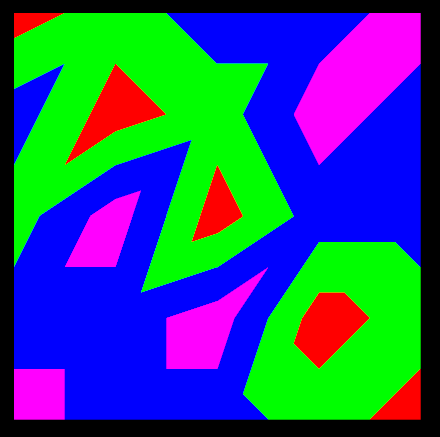
To colour a GridSurface, you can apply a colour map. The following example shows how to create and apply a numeric colour map to a GridSurface.
from mapteksdk.project import Project
from mapteksdk.data import GridSurface, NumericColourMap

project = Project()

with project.new("legends/numeric_grid_map", NumericColourMap) as colour_map:
  colour_map.interpolated = False
  colour_map.ranges = [-0.5, 0.5, 1.5, 2.5, 3.5]
  colour_map.colours = [[255, 0, 0, 255], [0, 255, 0, 255],
                        [0, 0, 255, 255], [255, 0, 255, 255]]
  colour_map.lower_cutoff = [0, 0, 0, 120]
  colour_map.upper_cutoff = [0, 0, 0, 120]

with project.new("surfaces/grid_numeric_colour_map", GridSurface(
    major_dimension_count=5, minor_dimension_count=5,
    x_step=0.5, y_step=0.5
    )) as grid:
  grid.point_attributes["value"] = [3, 2, 2, 1, 0,
                                    2, 2, 3, 0, 1,
                                    1, 3, 0, 2, 2,
                                    2, 0, 1, 3, 2,
                                    0, 1, 2, 2, 3]
  grid.point_attributes.set_colour_map("value", colour_map)
Running this script creates an object that looks like this:
Setting cell visibility
You can control the visibility of cells in a GridSurface. The example below demonstrates how to hide or show specific cells.
from mapteksdk.project import Project
from mapteksdk.data import GridSurface

project = Project()

visibility = [True, True, False, True,
              False, False, True, True,
              True, True, True, False,
              True, False, True, False]

# The negative y step flips the cell network such that the
# 0th row is at the top and the last row is at the bottom.
with project.new("surfaces/grid_cell_visibility", GridSurface(
    major_dimension_count=5, minor_dimension_count=5,
    x_step=1, y_step=-1
    )) as grid:
  grid.cell_visibility = visibility
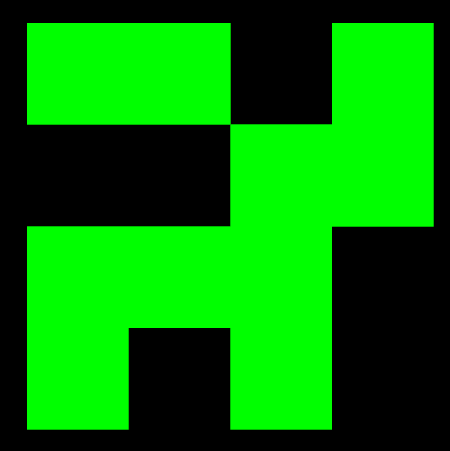
Running this script creates an object that looks like this:
Setting point visibility
You can use the point_visibility property to make the points in a GridSurface visible or invisible. A cell that contains points that are invisible will not appear in the view. The script below demonstrates setting the point visibility on a grid surface:
from mapteksdk.project import Project
from mapteksdk.data import GridSurface

project = Project()

visibility = [True, True, False, True, True,
              False, True, True, True, True,
              True, True, True, False, False,
              True, False, True, True, False,
              False, True, True, True, True]

with project.new("surfaces/grid_point_visibility", GridSurface(
    major_dimension_count=5, minor_dimension_count=5,
    x_step=1, y_step=1
    )) as grid:
  grid.point_visibility = visibility
Running this script creates an object that looks like this:

If you view the object in points mode (and overlay the above image), it will look like this:
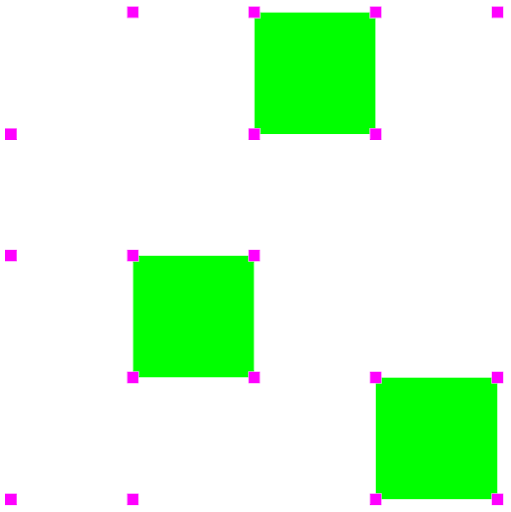
As you can see, every cell that is visible contains four visible corners.
Colouring points using point selection
GridSurface objects support point selection just as other point-based objects. This allows scripts to operate on a selection of points within the grid surface rather than the entire surface. This is demonstrated in the example below where selected points are coloured a single colour.
from mapteksdk.project import Project
from mapteksdk.data import GridSurface
from mapteksdk.pointstudio.operations import object_pick

project = Project()

oid = object_pick(label="Pick a grid surface to colour selected points")

if not oid.is_a(GridSurface):
  raise ValueError("You must pick a GridSurface.")

with project.edit(oid) as grid:
  grid: GridSurface
  grid.point_colours[grid.point_selection] = [221, 160, 221, 255]
The screenshot below shows an example of the result of running this script:
Colouring points using cell selection
You can apply operations to a selected number of cells in a GridSurface . In the example below, the selected cells are made invisible.
from mapteksdk.project import Project
from mapteksdk.data import GridSurface
from mapteksdk.pointstudio.operations import object_pick

project = Project()

oid = object_pick(label="Pick a grid surface to hide selected cells")

if not oid.is_a(GridSurface):
  raise ValueError("You must pick a GridSurface.")

with project.edit(oid) as grid:
  grid: GridSurface
  grid.cell_visibility[grid.cell_selection] = False
The screenshot below shows an example of the result of running this script:
Adding cell attributes to a GridSurface
You can add attributes at the cell level. These are called cell attributes. Every cell shares the same cell attributes. The example below demonstrates how to calculate and set cell attributes for a GridSurface.
import numpy
from mapteksdk.project import Project
from mapteksdk.data import GridSurface

points = numpy.array([
  [[-0.1, 4.9, -0.1], [1, 5, 0.2], [1.9, 5.2, 0], [2.9, 4.8, 0.2]],
  [[0, 4, -0.1], [0.8, 3.9, 0], [2.2, 4, 0.1], [3.2, 3.9, -0.2]],
  [[-0.1, 2.9, 0], [1.2, 2.8, 0], [2, 2.9, 0], [2.9, 2.9, 0.1]],
  [[0.1, 2, 0.1], [1.2, 1.9, 0.2], [2, 1.9, -0.1], [3.2, 1.8, 0]],
  [[0.2, 1.1, -0.2], [0.8, 0.9, 0.1], [2.1, 0.9, -0.2], [3.2, 1.2, 0]]
])

depth = [13.74216711, 6.26654481, 11.17255728, 10.50674182,
         7.96397555, 8.89378882, 12.19867618, 8.01683923,
         5.25515135, 6.55541477, 12.89572386, 12.29907013]

project = Project()

with project.new("surfaces/grid_with_cell_attribute", GridSurface(
    major_dimension_count=points.shape[0],
    minor_dimension_count=points.shape[1])) as grid_surface:
  grid_surface: GridSurface
  grid_surface.cell_points[:] = points

  # Calculate the area of all cells.
  cell_areas = numpy.empty((grid_surface.cell_count), numpy.float64)
  for i, cell in enumerate(grid_surface.cells):
    p0, p1, p2, p3 = grid_surface.points[cell]
    # Assuming the cell is not degenerate the points are like this:
    # p3 o---------o p2
    #    |         |
    #    |         |
    #    |         |
    # p0 o---------o p1

    area = 0

    # The squared length of the diagonals.
    diagonal_1 = numpy.sum(numpy.square(p0 - p2))
    diagonal_2 = numpy.sum(numpy.square(p1 - p3))

    # Calculate the area using the shorter diagonal.
    # This ensures correct results for concave cells.
    # This still gives incorrect values for degenerate cells.
    if diagonal_1 < diagonal_2:
      area += numpy.linalg.norm(numpy.cross(p1 - p0, p2 - p0))
      area += numpy.linalg.norm(numpy.cross(p2 - p0, p3 - p0))
    else:
      area += numpy.linalg.norm(numpy.cross(p0 - p1, p3 - p1))
      area += numpy.linalg.norm(numpy.cross(p2 - p1, p3 - p1))
    area /= 2
    cell_areas[i] = area

  # The depth attribute values are hard-coded into the script.
  grid_surface.cell_attributes["depth"] = depth
  # The area attribute values are calculated based on the geometry.
  grid_surface.cell_attributes["area"] = cell_areas
  # The volume attribute values are calculated based on other attributes.
  grid_surface.cell_attributes["volume"] = (
    grid_surface.cell_attributes["area"]
    * grid_surface.cell_attributes["depth"])

# Colour grid surface points based on cell  attributes
  for i, cell in enumerate(grid_surface.cells):
    a, b, c, d = cell
    cell_volume =  grid_surface.cell_attributes["volume"][i]
    if cell_volume > 7 and cell_volume < 10:
      grid_surface.point_colours[a] = [255,0,0,255]
      grid_surface.point_colours[b] = [255,0,0,255]
      grid_surface.point_colours[c] = [255,0,0,255]
      grid_surface.point_colours[d] = [255,0,0,255]
    else:
      grid_surface.point_colours[a] = [0,0,255,255]
      grid_surface.point_colours[b] = [0,0,255,255]
      grid_surface.point_colours[c] = [0,0,255,255]
      grid_surface.point_colours[d] = [0,0,255,255]
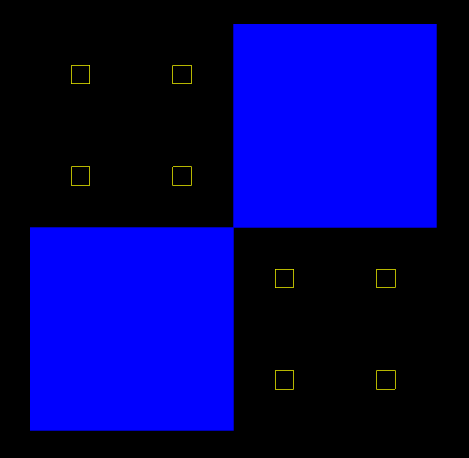
The screenshot below shows an example of the result of running this script:
The resulting GridSurface from the above code has three cell attributes:
-
“depth”, where the values are provided by the script.
-
“area”, where the values are calculated based on the topology of the grid surface.
-
“volume”, which is calculated based on the other cell attributes — it is the depth multiplied by the area.
Note: The volume is calculated at run-time and not dynamically. This means that if you make a change to the “depth” or the “area” cell attributes, the “volume” will not be updated.
Comparing points and cell points of a GridSurface
You can change the geometry of a GridSurface by either setting its GridSurface.points or GridSurface.cell_points.
Below are two scripts — one that creates a grid surface using points and the other using cell points. Using cell points is the preferred method as it preserves the structure of the grid surface.
Creating a GridSurface using points
from mapteksdk.project import Project
from mapteksdk.data import GridSurface

project = Project()

with project.new("surfaces/stepped_points", GridSurface(
    major_dimension_count=14, minor_dimension_count=10,
    x_step=1
    )) as grid:
  row_width = grid.minor_dimension_count
  height = 0
  y = 0
  for i, start in enumerate(range(0, grid.point_count, row_width)):
    grid.points[start:start + row_width, 2] = height
    grid.points[start:start + row_width, 1] = y
    if i % 2 == 1:
      height += 1
    else:
      y += 1
Creating a GridSurface using cell points
from mapteksdk.project import Project
from mapteksdk.data import GridSurface
project = Project()
with project.new("surfaces/stepped_cell_points", GridSurface(
major_dimension_count=14, minor_dimension_count=10,
x_step=1
)) as grid:
height = 0
y = 0
for i, row in enumerate(grid.cell_points):
row[:, 2] = height
row[:, 1] = y
if i % 2 == 1:
height += 1
else:
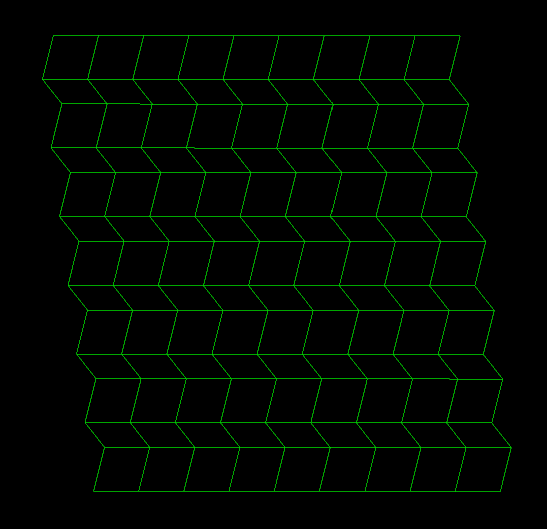
y += 1
Running either of these scripts generates an object that looks like this:
Grid surface 2D properties
Grid surfaces support accessing point and cell attributes using two-dimensional indexing.
Cell attributes 2D
The GridSurface.cell_attributes_2d property allows for two-dimensional access to cell attributes. Accessing attributes using cell_attributes_2d[name][major][minor] returns the value for the cell at cells_2d[major, minor].
The following script demonstrates the difference in the shapes of the arrays of the cell_attributes and the cell_attributes_2d properties:
from mapteksdk.project import Project, OverwriteMode
from mapteksdk.data import GridSurface
import numpy as np


def main(project: Project):
    with project.new(
        "surfaces/cell_property_2d",
        GridSurface(
            major_dimension_count=3, minor_dimension_count=4, x_step=1.0, y_step=1.0
        ),
        overwrite=OverwriteMode.UNIQUE_NAME,
    ) as grid:
        grid.cell_attributes["index"] = np.arange(0, grid.cell_count, 1)
        print("Cell attribute:\n", grid.cell_attributes["index"])
        print("Cell attribute 2d:\n", grid.cell_attributes_2d["index"])


if __name__ == "__main__":
    with Project() as main_project:
        main(main_project)
The expected output of this script is as follows:
Cell attribute:
[0 1 2 3 4 5]
Cell attribute 2d:
[[0 1 2]
[3 4 5]]
The values are the same in both arrays. The difference is, in the two-dimensional version the values are arranged into a 2 x 3 grid, which matches the dimensions of the cell grid of the grid surface (since the cell grid has dimensions major_dimension_count - 1 x minor_dimension_count - 1).
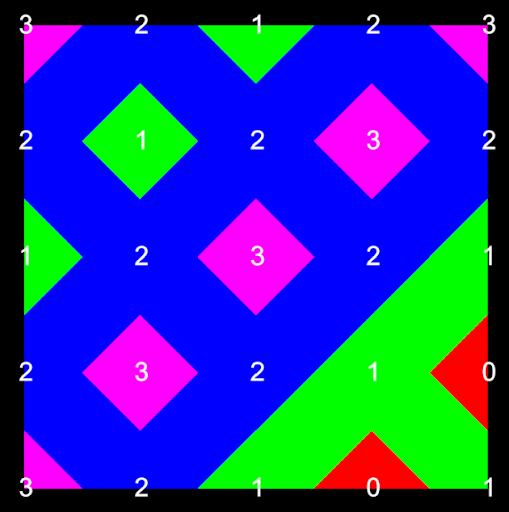
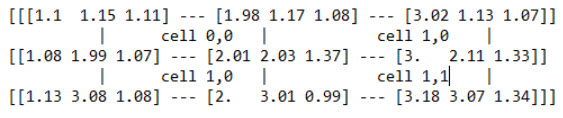
Cell point attributes
The GridSurface.cell_attributes property provides access to point attributes based on the point grid. That is, cell_point_attributes[name][major][minor] returns the point attribute name for the point cell_points[major, minor]. For small grid surfaces, this can be used to set point attributes using a two-dimensional array, which can make it easier to determine which point each attribute value is for:
from mapteksdk.project import Project, OverwriteMode
from mapteksdk.data import GridSurface, NumericColourMap, ObjectID
from mapteksdk.operations import open_new_view
import numpy as np


def create_colour_map(project: Project) -> ObjectID[NumericColourMap]:
    with project.new(None, NumericColourMap) as colour_map:
        colour_map.interpolated = False
        colour_map.ranges = [-0.5, 0.5, 1.5, 2.5, 3.5]
        colour_map.colours = [
            [255, 0, 0, 255],
            [0, 255, 0, 255],
            [0, 0, 255, 255],
            [255, 0, 255, 255],
        ]
        colour_map.lower_cutoff = [0, 0, 0, 120]
        colour_map.upper_cutoff = [0, 0, 0, 120]
    return colour_map.id


def create_surface(project: Project, map_id: ObjectID[NumericColourMap]):
    with project.new(
        "surfaces/cell_point_attribute_example",
        GridSurface(
            major_dimension_count=5, minor_dimension_count=5, x_step=0.5, y_step=-0.5
        ),
        overwrite=OverwriteMode.UNIQUE_NAME,
    ) as grid:
        # First create an empty point attribute.
        grid.point_attributes["value"] = np.empty((grid.point_count,), dtype=np.int32)
        # Now the values can be assigned via the cell point attributes.
        grid.cell_point_attributes["value"][:] = [
            [3, 2, 1, 2, 3],
            [2, 1, 2, 3, 2],
            [1, 2, 3, 2, 1],
            [2, 3, 2, 1, 0],
            [3, 2, 1, 0, 1],
        ]
        grid.point_attributes.set_colour_map("value", map_id)
        return grid.id


if __name__ == "__main__":
    with Project() as main_project:
        colour_map_id = create_colour_map(main_project)
        surface_id = create_surface(main_project, colour_map_id)
        open_new_view([surface_id])
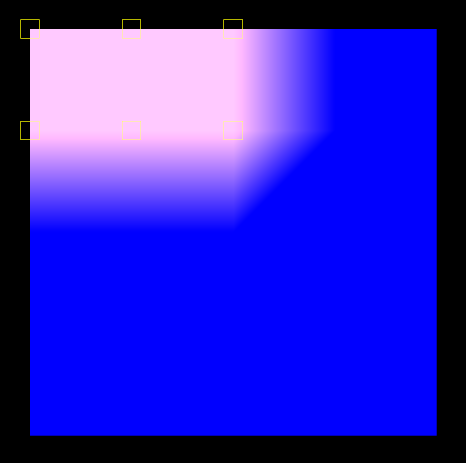
This script creates the following object:
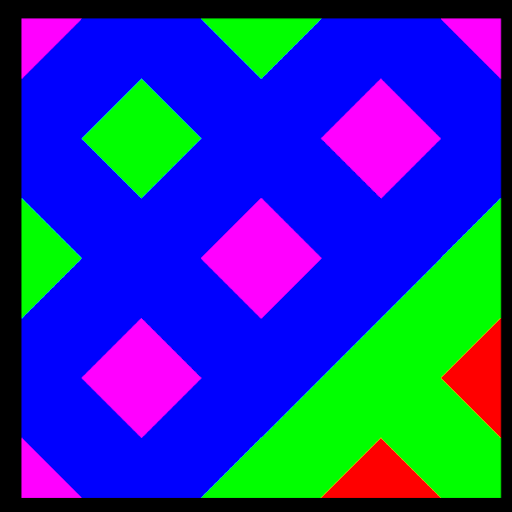
By overlaying the point attribute values over each point in this grid surface, you can see that they perfectly overlap with the array of values assigned to the point property: