ColourMap
ColourMaps (also referred to as 'Legends' in the software) represents a colour schemes with associated numeric ranges or string ranges.
ColourMaps can be applied to various data and objects for displaying physical trends. It is possible for the SDK to read legends created by users in the software as well as create legends that users can edit, view or apply in the software. An example of doing this is provided in the Create Facet Primitive Attributes example.
Topics:
Creating StringColourMap
In the following code, we:
-
Create a
StringColourMap -
Create a
DenseBlockModel -
Apply the
StringColourMapto theDenseBlockModelusing block attributes
"""Example 1: Colouring a dense block model using a string colour map."""

from mapteksdk.project import Project
from mapteksdk.data import StringColourMap, DenseBlockModel

project = Project()

with project.new_or_edit("legends/string_colour_map", StringColourMap) as string_map:
  # The names associated with the colours in the colour map. Note that these names are case-sensitive.
  # ie: red is valid, but Red is an invalid.
  string_map.legend = ["red", "green", "blue", "yellow", "cyan", "magenta", "grey", "white"]
  string_map.colours = [[255, 0, 0], # red
                     [0, 255, 0], # green
                     [0, 0, 255], # blue
                     [255, 255, 0], # yellow
                     [0, 255, 255], # cyan
                     [255, 0, 255], # magenta
                     [100, 100, 100], # black
                     [255, 255, 255]] # gray

  # cutoff specifies how to colour invalid values. In this case invalid values will be coloured
  # transparent.
  string_map.cutoff = [0, 0, 0, 0]

# Now use the colour map to colour a block model.
with project.new("blockmodels/coloured_block_model", DenseBlockModel(
    x_res=1, y_res=1, z_res=1, x_count=3, y_count=3, z_count=1
    )) as coloured_model:
  # First a block attribute must be created to colour by.
  # Note that the block in the middle has an invalid value so will be invisible.
  coloured_model.block_attributes["colours"] = [
    "red", "green", "blue",
    "yellow", "invalid", "cyan",
    "magenta", "grey", "white",
    ]
  # Now that the attribute has been added, we can assign the colour map to it.
  coloured_model.block_attributes.set_colour_map("colours", string_map)
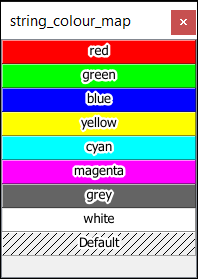
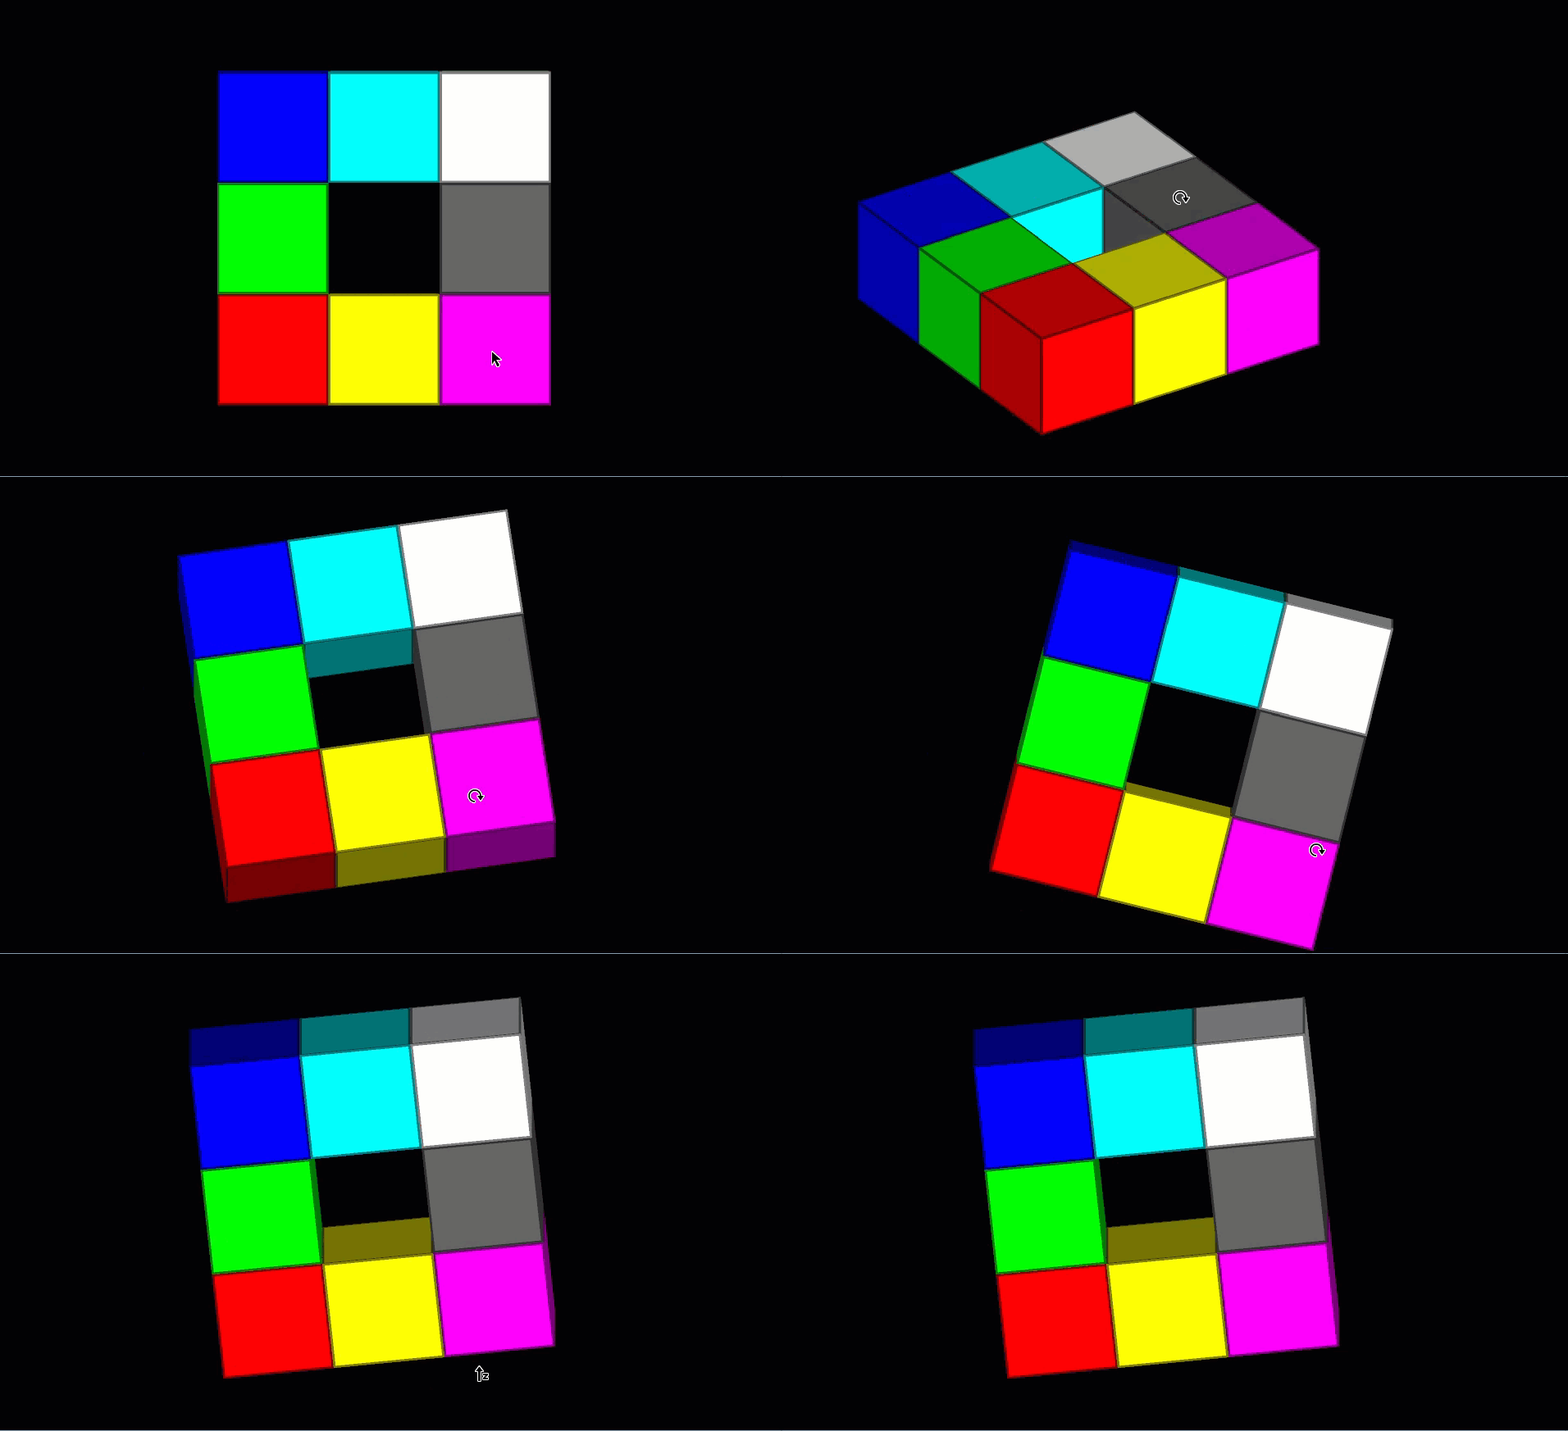
If you run this code, you will create a StringColourMap and a coloured dense block model which look like the following:
Creating NumericColourMap
In the following code, we:
-
Create a solid
NumericColourMap -
Create a
DenseBlockModel -
Apply the solid
NumericColourMapto theDenseBlockModel
"""Example 2: Colouring a dense block model using a solid numeric colour map.

There are two types of numeric colour map - solid and interpolated. They are
differentiated by the interpolated property of the colour map.

"""
from mapteksdk.project import Project
from mapteksdk.data import NumericColourMap, DenseBlockModel

project = Project()

with project.new_or_edit("legends/numeric_map_exp", NumericColourMap) as solid_map:
  solid_map.interpolated = False
  # For non-interpolated (solid) colour maps there is one less colour than range.
  solid_map.ranges = [0, 10, 20, 30, 40, 50, 60, 70]
  solid_map.colours = [[255, 0, 0], # 0 < value <= 10 are coloured this colour (Red).
                       [0, 255, 0], # 10 < value <= 20 are coloured this colour (Green).
                       [0, 0, 255], # 20 < value < 30 are coloured this colour (Blue).
                       [255,50,100], # 30
                       [250,255,40], # 40
                       [100, 30, 255], #50
                       [45, 45, 45],  #60
                      ]

  # Colours below zero are coloured this colour. In this case it is semi-transparent red.
  solid_map.lower_cutoff = [255, 0, 0, 100]

  # Colours greater than the highest range, in this case it is semi-transparent blue.
  solid_map.upper_cutoff = [0, 0, 255, 100]

with project.new("blockmodels/dense_solid_colours", DenseBlockModel(
    x_count=5, y_count=1, z_count=1, x_res=1, y_res=1, z_res=1
    ), overwrite=True) as solid_model:
  solid_model.block_attributes["solid_colour"] = [-5, 5, 15, 25, 35]
  solid_model.block_attributes.set_colour_map("solid_colour", solid_map)
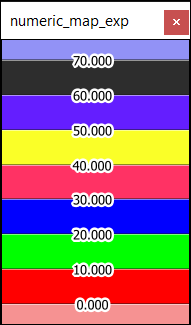
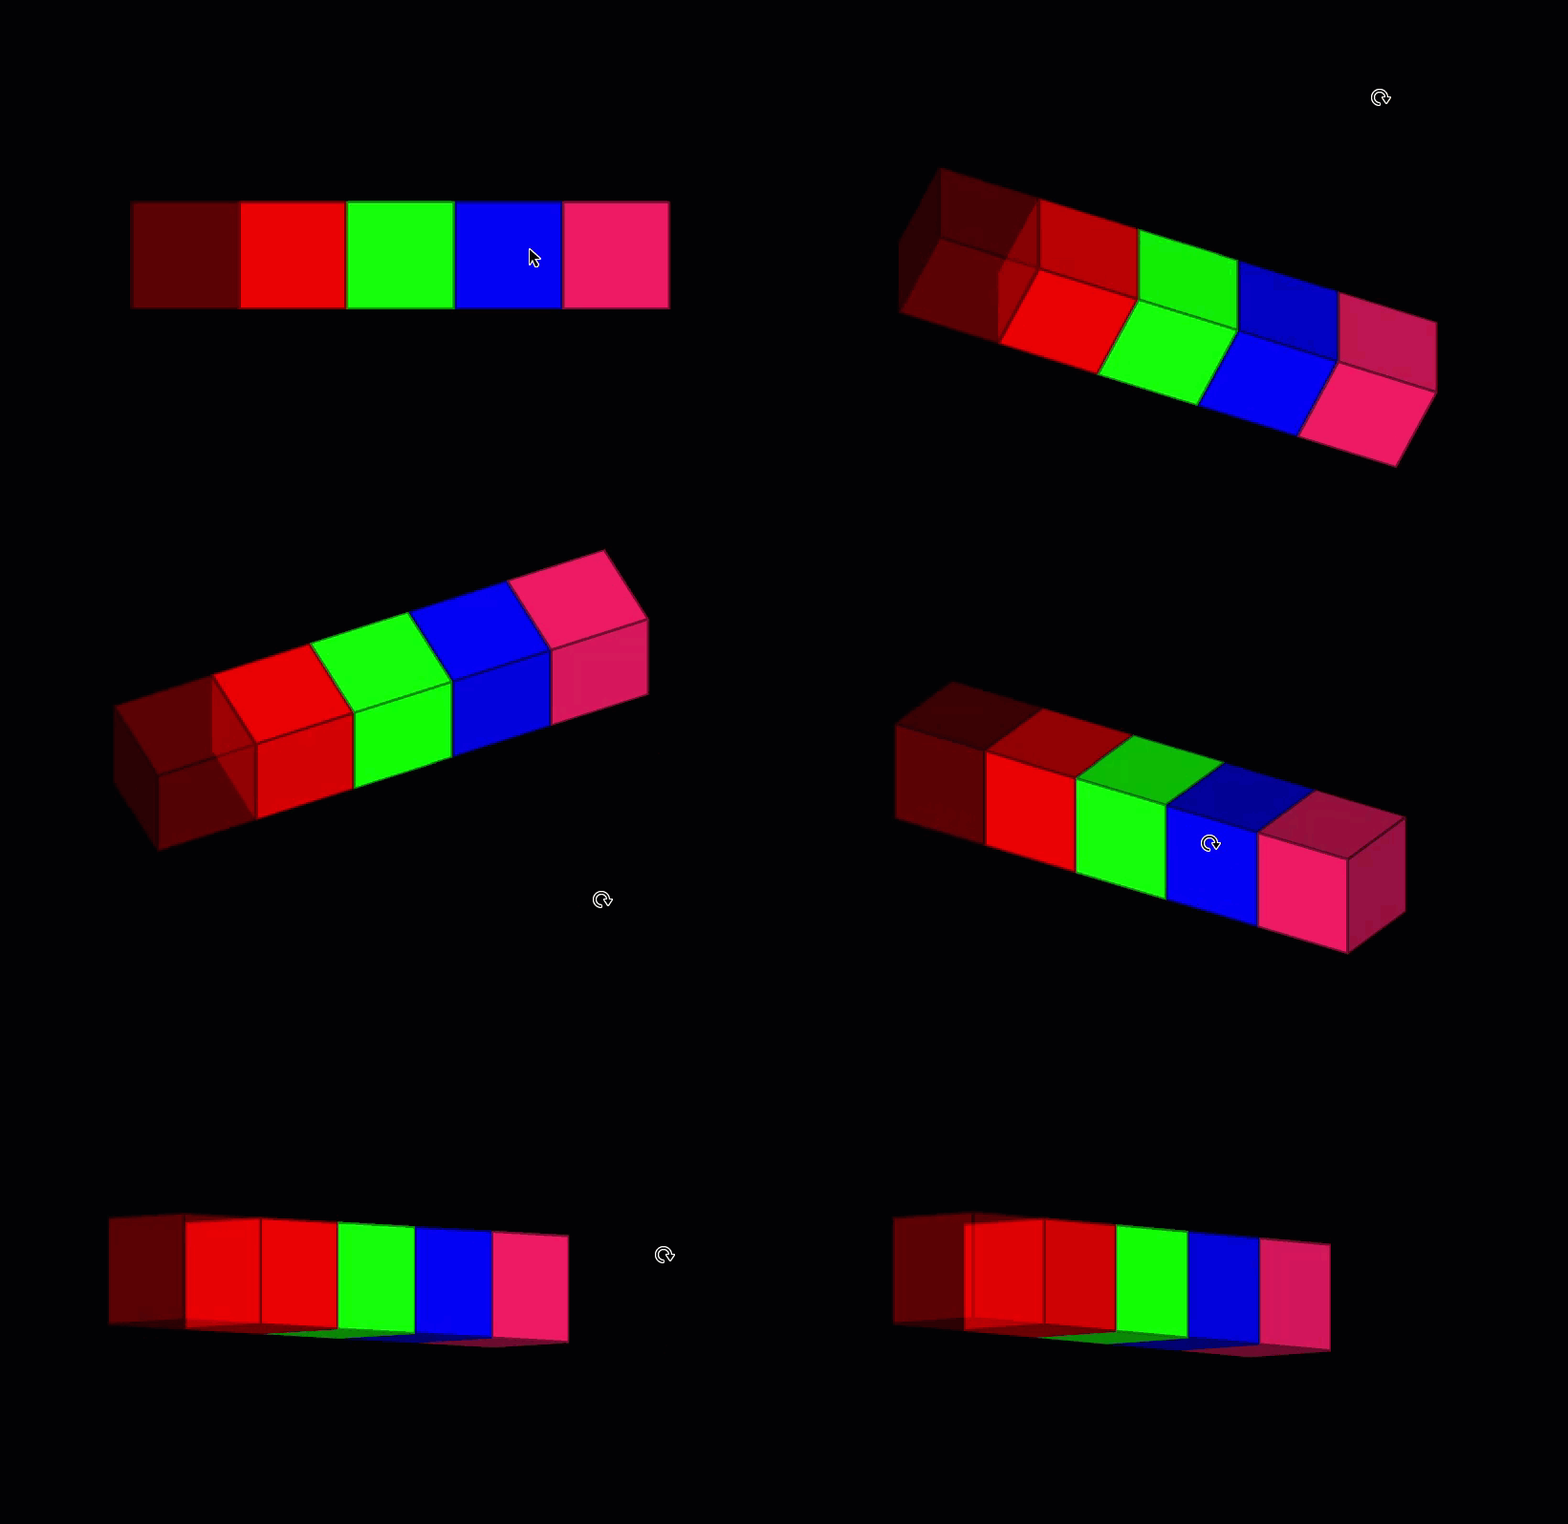
If you run the following code, you will create a solid NumericColourMap and DenseBlockModel which look like this:
Applying a Colour Scheme to Object
In the following code, we:
-
Create an interpolated
NumericColourMap -
Create a
DenseBlockModel -
Apply the interpolated
NumericColourMapto theDenseBlockModel
"""Example 4: Colouring a block model using a numeric colour map."""

from mapteksdk.project import Project
from mapteksdk.data import NumericColourMap, DenseBlockModel, Surface

import numpy as np

project = Project()

with project.new_or_edit("legends/interpolated_map", NumericColourMap) as interpolated_map:
  interpolated_map.interpolated = True
  # For interpolated colour maps the number of colours is equal to the number of ranges.
  interpolated_map.ranges = [0, 10, 20]
  interpolated_map.colours = [[255, 0, 0],
                              # Colours between 0 and 10 will smoothly transition from the colour above (red)
                              # to the colour below (green)
                              [0, 255, 0],
                              # Colours between 10 and 20 will smoothly transition from the colour above (green)
                              # to the colour below (blue)
                              [0, 0, 255],
                             ]

  # Colours below zero are coloured this colour. In this case it is semi-transparent red.
  interpolated_map.lower_cutoff = [255, 0, 0, 100]

  # Colours greater than the highest range, in this case it is semi-transparent blue.
  interpolated_map.upper_cutoff = [0, 0, 255, 100]

# Use the colour map to colour a blockmodel.
with project.new("blockmodels/dense_interpolated_colours", DenseBlockModel(
    x_count=11, y_count=1, z_count=1, x_res=1, y_res=1, z_res=1
    ), overwrite=True) as interpolated_model:
  # Create a block attribute to colour by.
  # From left to right when viewing from above:
  # The first block's value is -1 which is below the minimum so is coloured by lower_offcut.
  # As the value increases from 2 to 10 the blocks get progressively more green.
  # As the value increases from 10 to 18 the blocks get progressively more blue.
  # And finally the last block's value is 22 which is above the maximum so is coloured by upper_offcut.
  interpolated_model.block_attributes["interpolated_colour"] = [-1, 2, 4, 6, 8, 10, 12, 14, 16, 18, 22]
  interpolated_model.block_attributes.set_colour_map("interpolated_colour", interpolated_map)
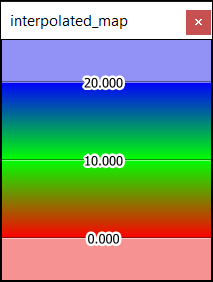
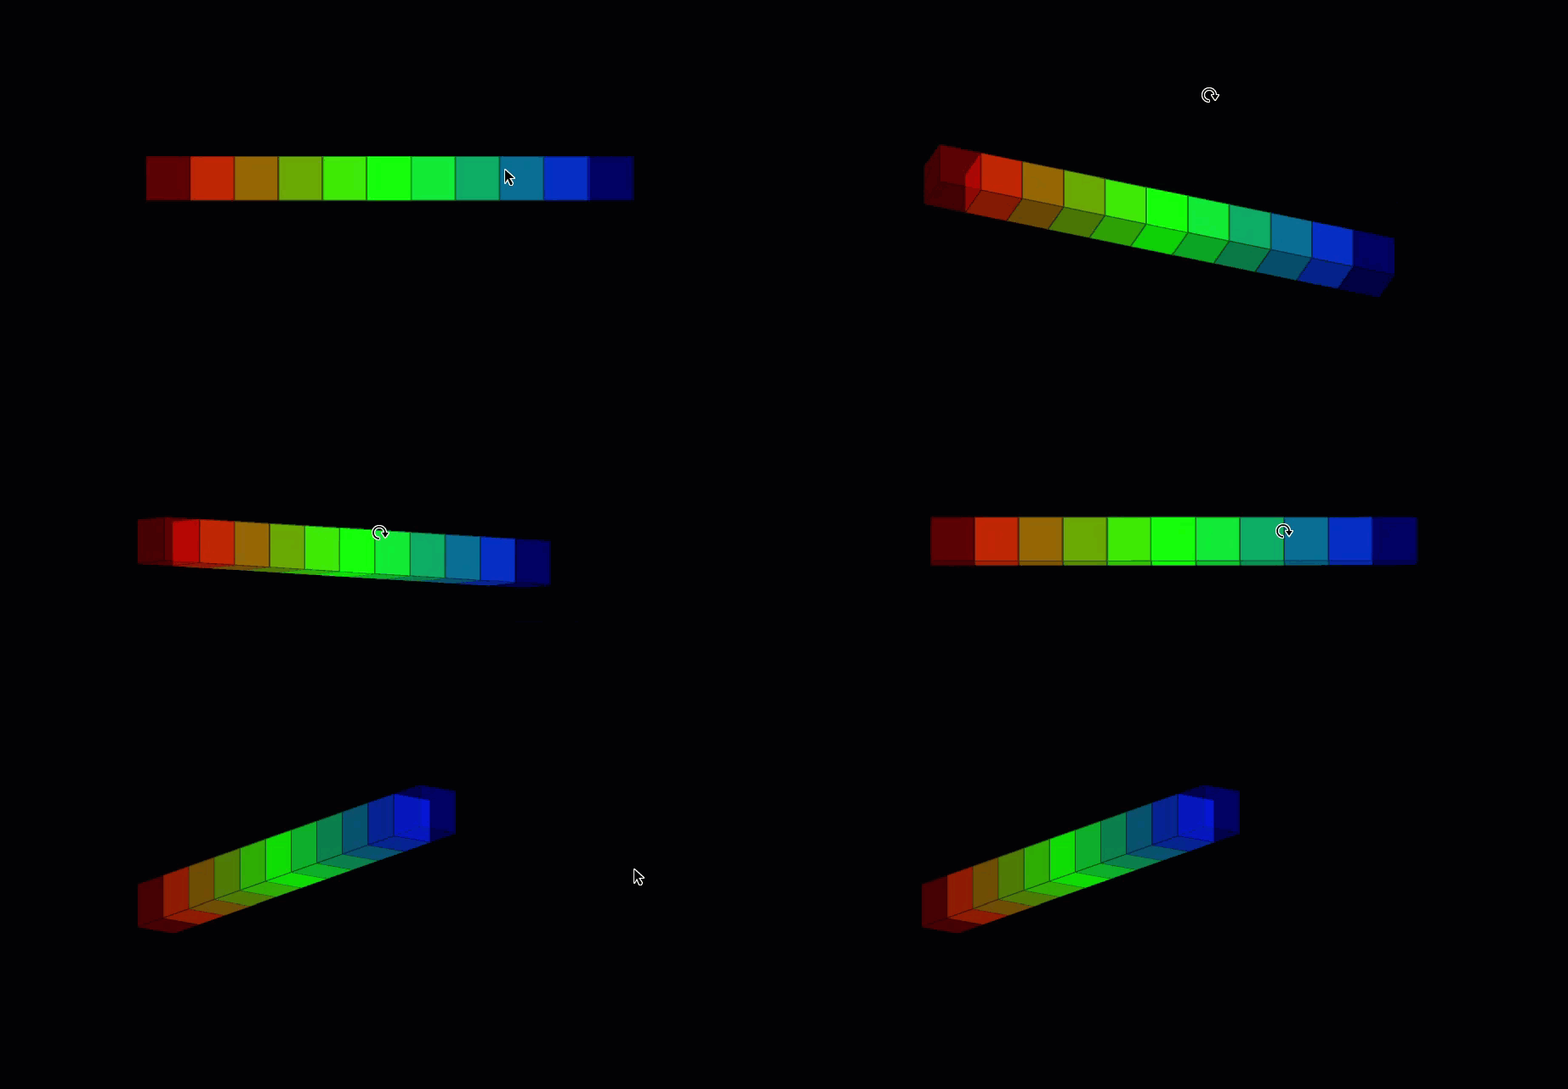
If you run the following code, you will create an interpolated NumericColourMap and DenseBlockModel which look like this:
