 Dashboard
Source file: dashboard.htm
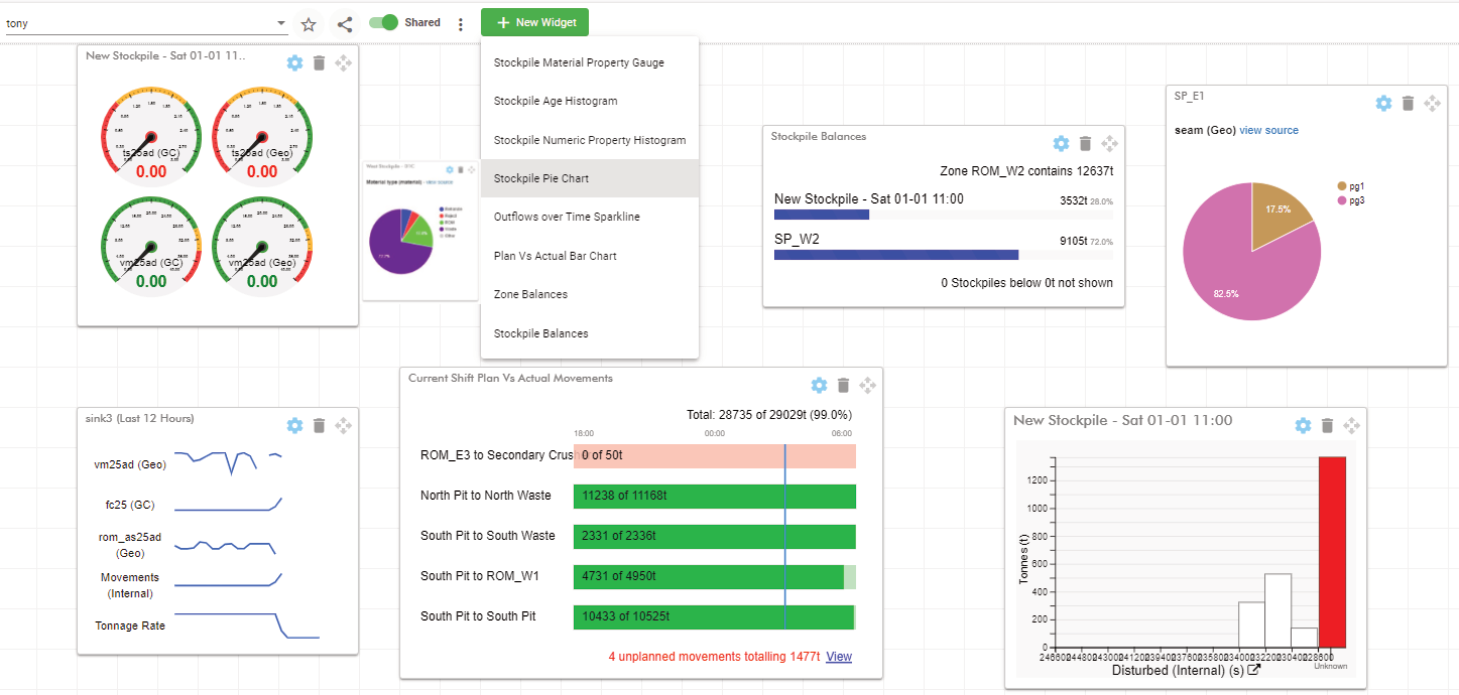
The Dashboard page is the landing page that appears after logging in. Its purpose is to enable users to monitor run-of-mine activities using instrument-styled widgets. Users can create personalised dashboards and add widgets better suited to their roles. A typical dashboard can include one or more widgets, as illustrated.
How to use the dashboard
The dashboard is configurable, enabling you to create different dashboards and add widgets as needed. Dashboards can even be shared with other users and can also be imported and exported, ready-made with preconfigured widgets for quick deployment.
-
To select a dashboard, open the drop-down to select from the list, if available. Enable the Shared checkbox to display shared dashboards for selection.
Note: When selecting dashboards, you will see the owner's name appended to those created by other users. Shared dashboards are labelled as 'shared' and are read-only for everyone except the dashboard owner.
-
To select your default dashboard, choose one you have created, then click the
 (Default dashboard) icon. When selected, the icon becomes yellow and it will also be displayed in the dashboard selection drop-down.
 -
To share a dashboard, click
 (Copy current dashboard URL to share) to copy the link to the clipboard to be provided to other users.
 Note: You cannot edit dashboards made by other users. Instead, use
 >
>  to make an editable version.
 -
Click
to open the following menu:
Rename the current dashboard (other users' dashboards, including those shared, cannot be renamed).

Create a new dashboard. When prompted, enter the name into the Name field and click
 . A new empty dashboard will be displayed.
Delete the current dashboard that you own. When prompted, click
 . Dashboards you can't delete will be greyed out.
Cloning makes a copy of any dashboard, complete with its widgets. When prompted, enter the name for the clone and click  .
.
Import a dashboard into your current dashboard. The imported file will overwrite existing widgets, if present, and apply the layout from the import source. The file format used is the same as used in  .
.
Export a dashboard belonging to you as a
JSONfile. The exported file name is as follows:<Dashboard name><Site code><Date><Time>for example:
Main ROM OverviewDEMO23_07_202411_37_42.jsonwhere:
-
<Dashboard name>is the name given to it by the user that created the dashboard. -
<Site code>is that of the currently used instance of MaterialMRT. -
<Date>is the creation date of the export expressed as:<day_month_year>. -
<Time>is the creation time of the export expressed as:<hours_minutes_seconds>.
-
-
To add a new widget to the dashboard, click
 to open its menu and select the required type. After selecting a widget, you will need to configure it. See Configuring widgets for more information on customising widgets.
Widgets
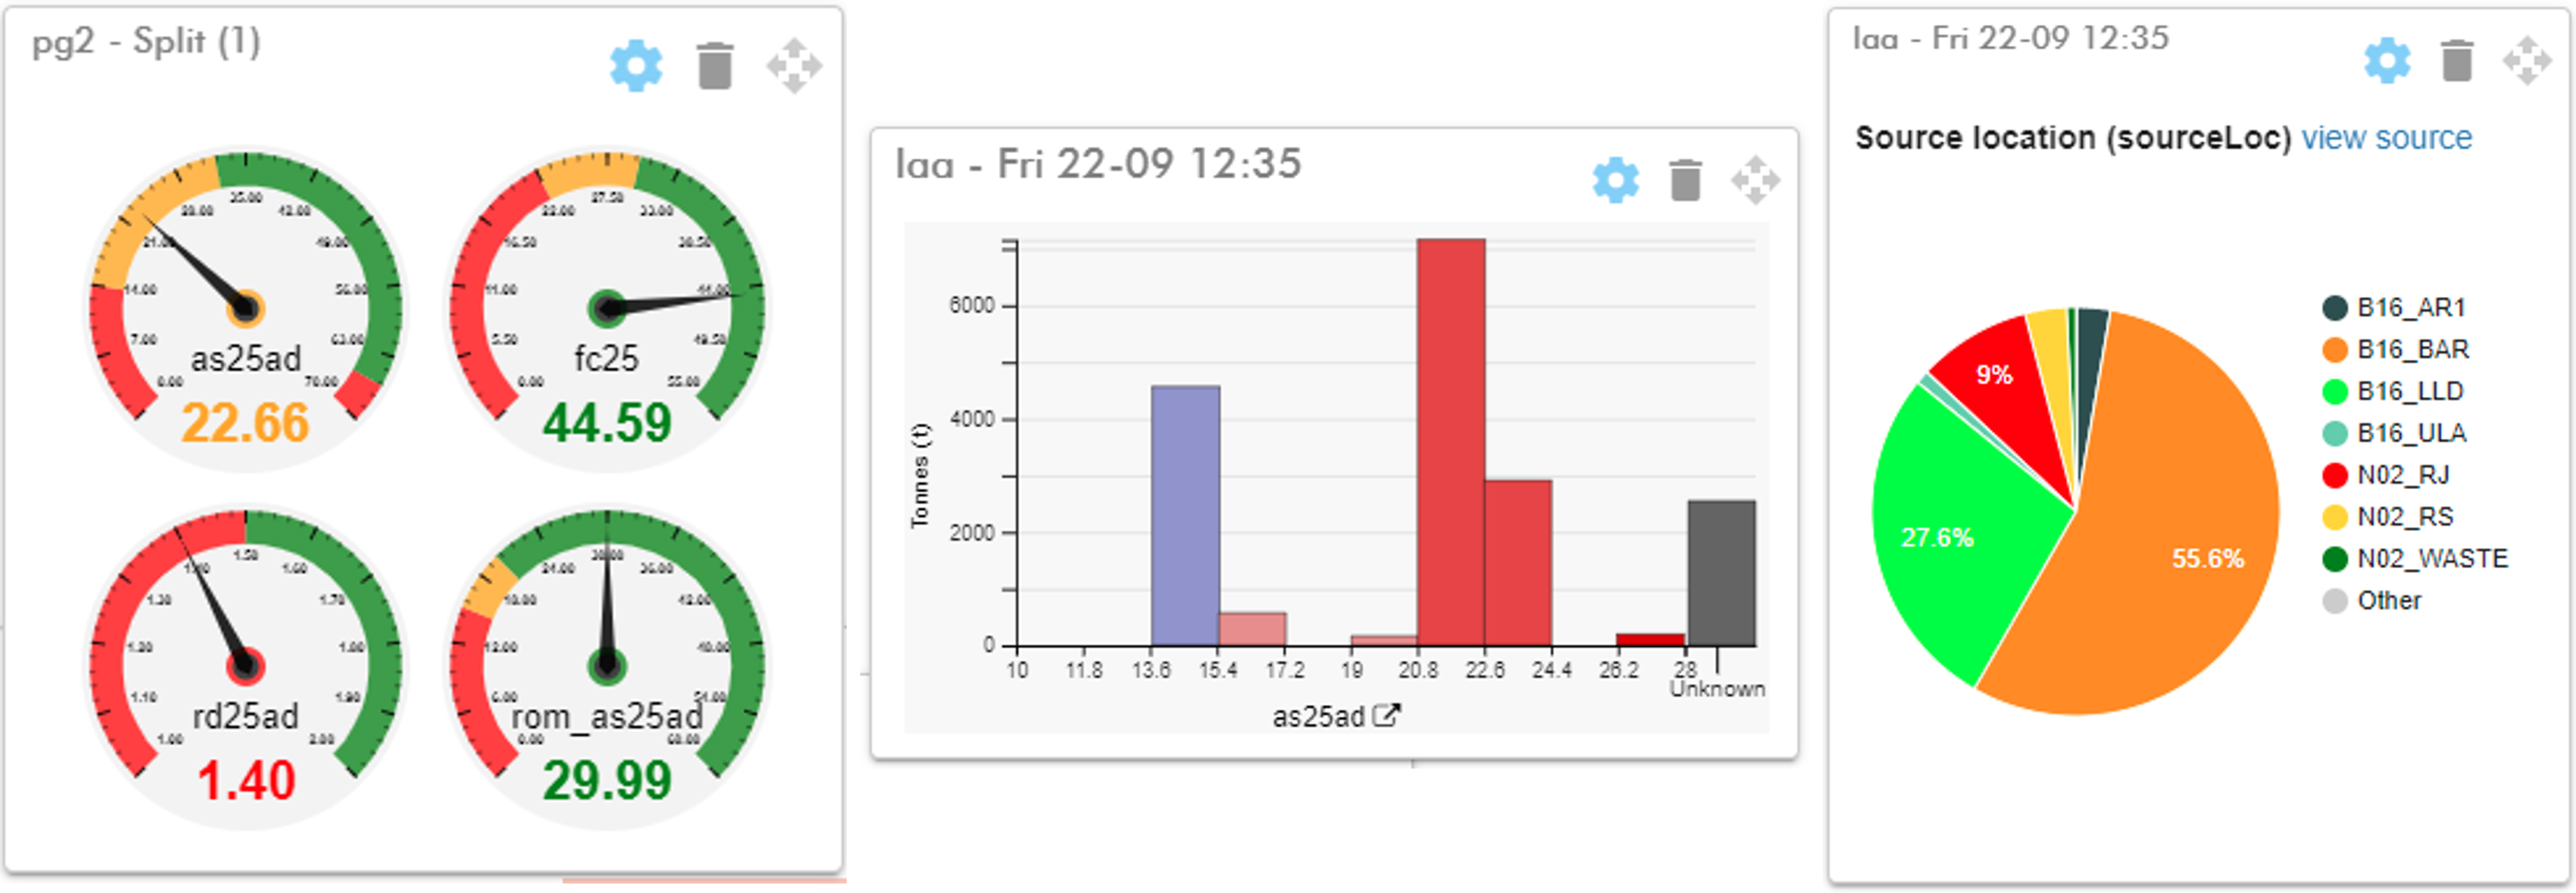
Widgets are panels that contain one or more readouts. These take the form of gauges, bar graphs, sparklines, and histograms, depending on the type of widget selected. Widgets allow you to monitor various metrics on a near-real-time basis as information is continually updated.
Configuring widgets
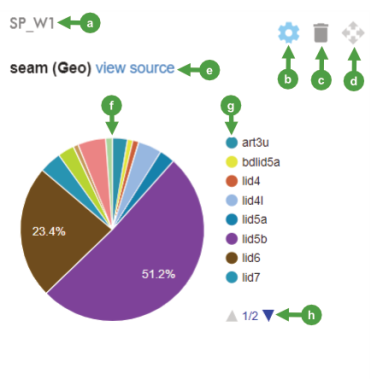
The image below shows a widget that has been configured. You can configure your own widgets, including those you share and the those in the default dashboard. However, you cannot edit other user’s widgets; their controls will not be available.
|
|


After allocating a widget, configure it to the required metrics and position it to your preference within the dashboard.
-
To place your widget, use its drag handle (
 ). To facilitate placement, the widget will snap to the nearest horizontal and vertical grid lines in the dashboard background or to adjacent widgets.
 -
To configure which data to display, click
 , then select the required parameters and values. The type of information and selection method vary. Typically, you will have one or more drop-downs that allow you to choose a single or multiple items, depending on the type of data. Once configured, your readout will be displayed using the colour scheme associated with that data.
 -
To delete a widget, click
 . It will be immediately removed from the dashboard.
Some widgets include an additional view source hyperlink.
-
Hover over the hyperlink to see a tooltip of the page that opens when clicked.
-
Click on the hyperlink to open the view source page in a new browser tab.
