Material Movements
Source file: material-movements.htm
Material Movements visualises and catalogues how materials move over time. There are two ways in which material movements are displayed, as follows:
-
Material Movements - Timeline: Use the timeline to play an animation of stockpiles as they are added or removed. The timeline uses a full-screen terrain viewer and playback-style controls for running the animation.
-
Material Movements - Stockpile: Generate a table based on the trips occurring at a particular stockpile or zone in a given period of time. You can also filter your data, view the properties of a stockpile via a tooltip in the Properties column, and see its trips in the viewer.
Using the Timeline page
The Material Movements -Timeline page visualises all material movements over a period of time. Activity is shown in real time or at different playback speeds. To use this viewer, follow these steps:
-
Manipulate the view to observe the area of interest.
Tip: Click
 (Re-centre camera orientation) to restore the view if the camera angle has been changed.Tip
To set the centre of view over a specific location, follow these steps:
-
click
 (Go to position); the Navigate to dialog will open.
 -
From the Coordinate Reference drop-down, choose either Local Mine Grid, or Lattitude/Longitude.
-
Enter the coordinates, using the appropriate type, and click
 .
.
-
-
Select a period of time using the Time drop-down or calendar picker.
-
Click
 to initiate the query. Loading time can vary, depending on the amount of data.
 -
Use the playback controls to run through the animation sequence. To learn more, see Using the playback controls.
Using the playback controls
The playback controls located along the bottom of the page allow you to run the animation of material movements. Use the playback transport controls to play through the time sequence.
-
To start playback in ascending time, click
 (Play forward), or in reverse time, click
  (Play reverse).
 Note: Forward playback loops back to the start of the time line and replays continuously, but reverse playback does not.
-
To stop playback, click the
 (pause) button. To resume playback, simply click again.
 Note: When enabled, the pause button has a green border.
-
To change the playback speed, drag the speed-control dial towards the left or the right of the centre position in the dial. Playback can be magnified by up to a factor of 604800 (real-time playback speed ), in either direction.
-
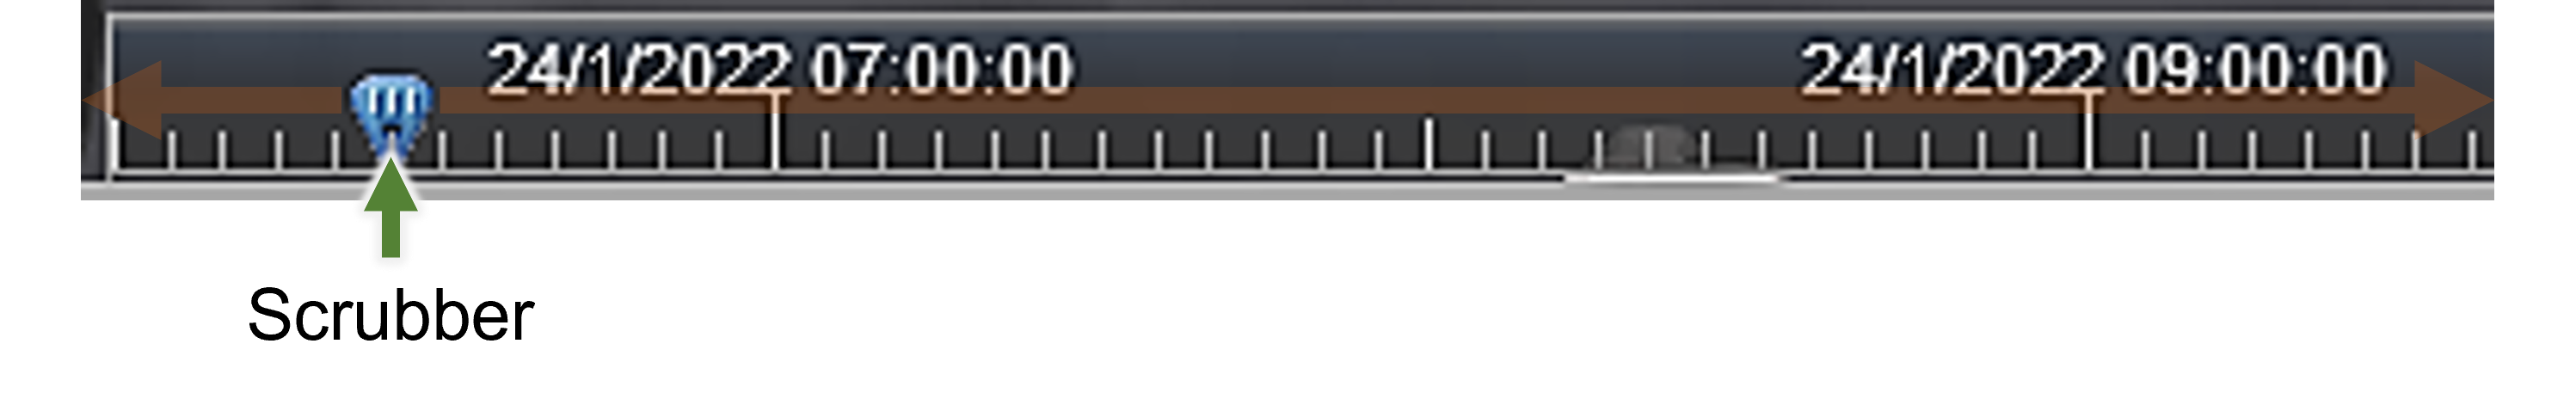
To cue to a certain position in time, use the time bar next to the playback transport controls You can either click on a point along the time bar or drag the blue scrubber to cue to your desired position You can also drag the scrubber control to animate the time sequence manually.
Using the Stockpile page
The Material Movements-Stockpile page uses a table listing trips and related information for a selected stockpile and period of time. This differs from the timeline approach, which considers site-wide material movements. This page also provides the following:
-
An optional viewer is available to provide a visual point-to-point representation of material movement.
-
A simple timeline that allows you to queue to specific events or filter a period of time along the timeline.
-
Search for specific trips by using the Load Trip tool or using Search Trips to perform a keyword search.
Generating stockpile reports
-
Select your time range by using the Time drop-down or calendar picker.
-
Select a stockpile using the Stockpile drop-down.
-
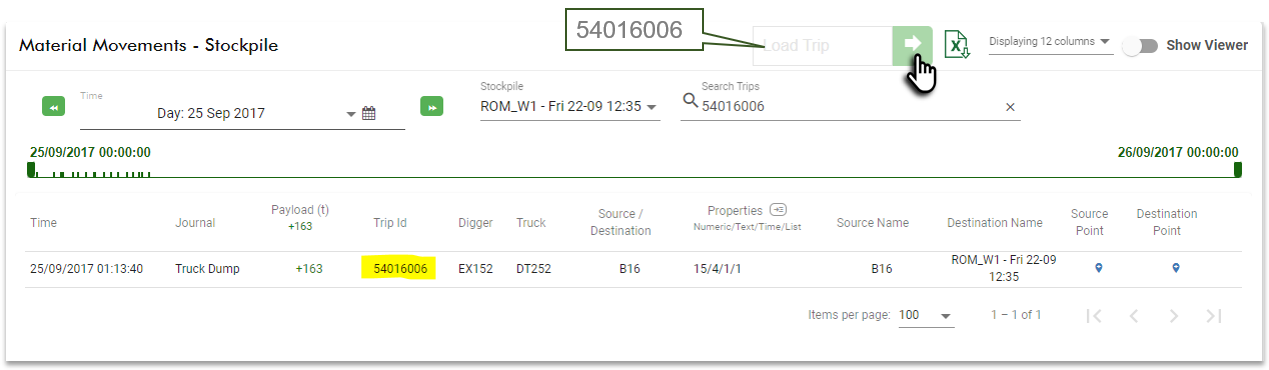
Optionally, use the timeline (above the table) to set a bandpass filter for the time range. Simply drag the time range selectors to set the start and end time. Trips are indicated by the small notches on the timeline. Items outside of your selection are filtered from the table, as demonstrated.
-
Apply other filters, as follows:
-
Load Trip: Enter the Trip id number into the Load Trip field then click on the arrow to update the table. The row matching the Trip ID is shown.
- Filter the columns in the list as required. You can control which columns are displayed using
 drop-down located near the top-right of this page. The available columns are as follows:
 General Infos
 Click here to see the definitions of general information items
Time
The time and date of the trip.
Journal
A description or reason for the trip.
Payload
The tonnage of the material for that trip.
Trip ID The unique identifier used by the FMS.
Digger The name of the equipment handling the material at the source.
Truck Then name of the truck moving the material to the destination.
Source/Destination
Identifiers used by the FMS corresponding to the source and destination location of that trip.
Properties The quantities of different properties associated with that trip. Each property category is separated by a “/” and follows this order:
Numeric/Text/Time/List.
A trip with the following properties: 14/4/1/1 indicates there are 14 numeric properties, 4 text properties, and 1 time and list property on that trip.
Tip: To view the quick statistics panel showing each property and its value by category, simply hover over an item in the Properties column.
Source Name The location from which the material was sourced.
Destination Name The location from which the material was deposited.
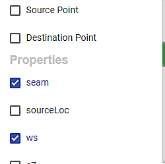
Properties
Select available properties that you want to include in your query. An corresponding column is added for each property you select.
-
Export to Excel
You can export your data as a (XLSX) spreadsheet using the selected filtering and sorting options.
To export your data, do the following:
-
Configure your search or filtering settings, including which columns to include in your report.
-
Click
 (Export to Excel) at the top-right of the page. The export is saved to your download directory as follows Trips_Report_<Date><Time>.xlsx.
where:
-
Trips_Report_is the output name. -
Dateis set to the system clock using theyear-month-daysequence. -
Timeis set to the system clock using thehours_minutessequence.
-
Using the viewer
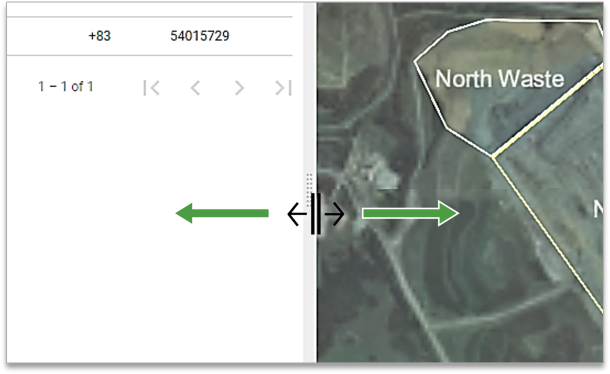
The viewer shows the passage of material movements from its source location to its destination. A geographical perspective is provided by the viewer. To show the viewer, click the  toggle at the top-right of the page. To resize the viewer, position the drag bar in the preferred position, as illustrated.
Viewing movements
Follow these instructions to visualise movements:
-
Follow the steps described in Generating a stockpile report.
-
Click
 to reorient the view to the stockpile.
 -
Select the Viewer Mode from its drop-down located at the top left-hand side of the viewer. There are two options available:
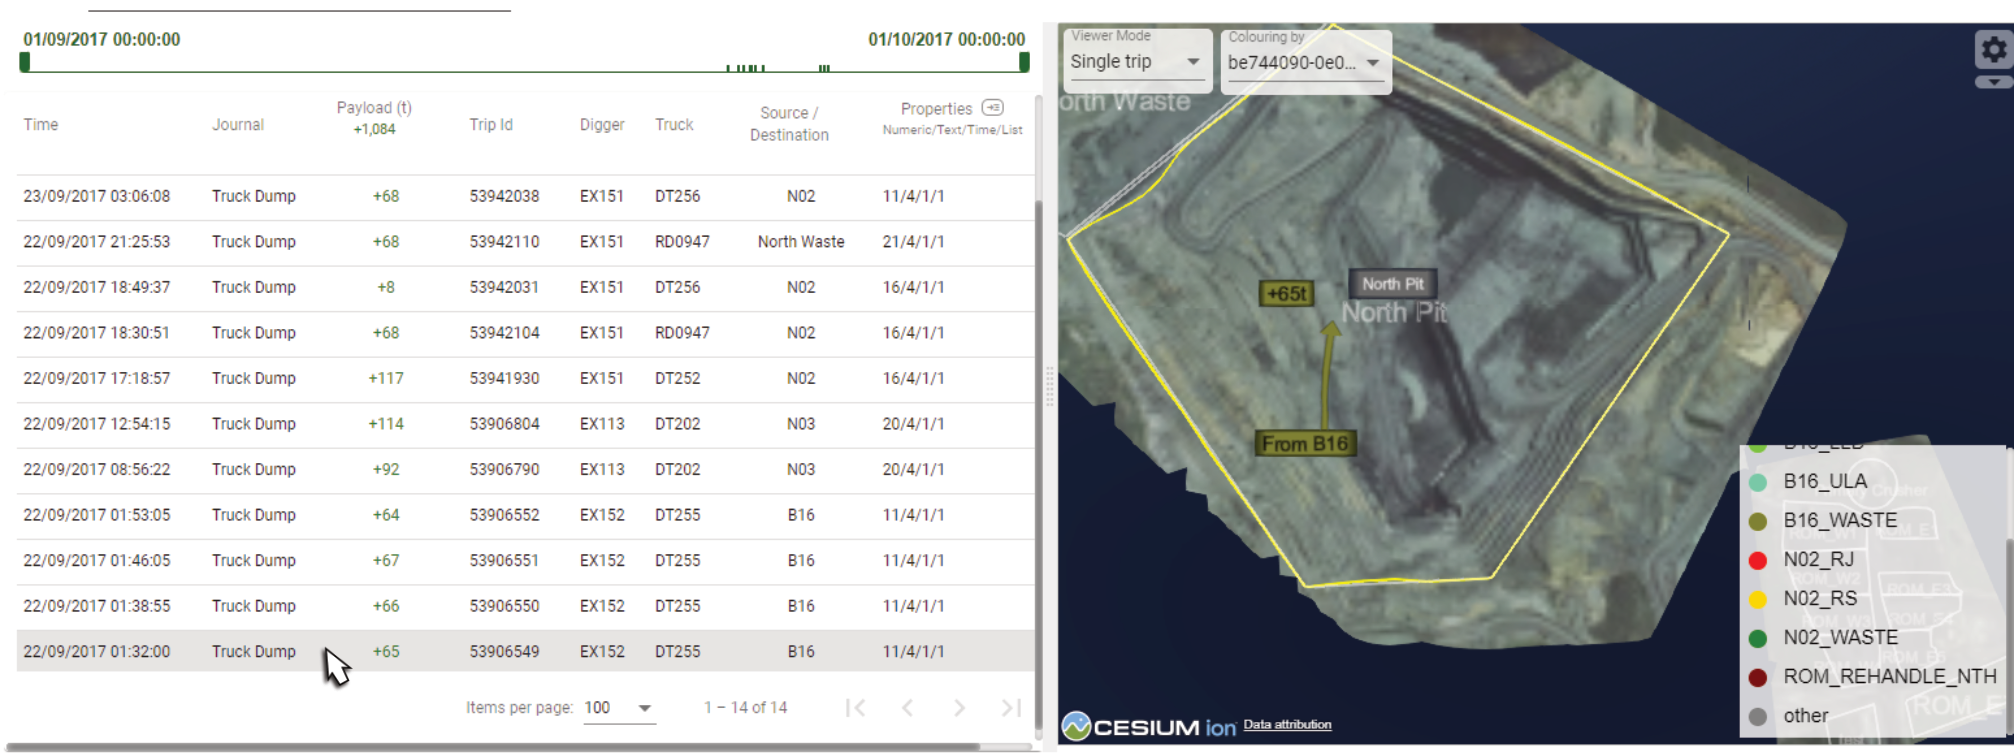
Single Trip
A solid line indicating the passage of the trip is shown when the mouse is over a particular trip in the table. A label showing the tonnage for that trip is also displayed.
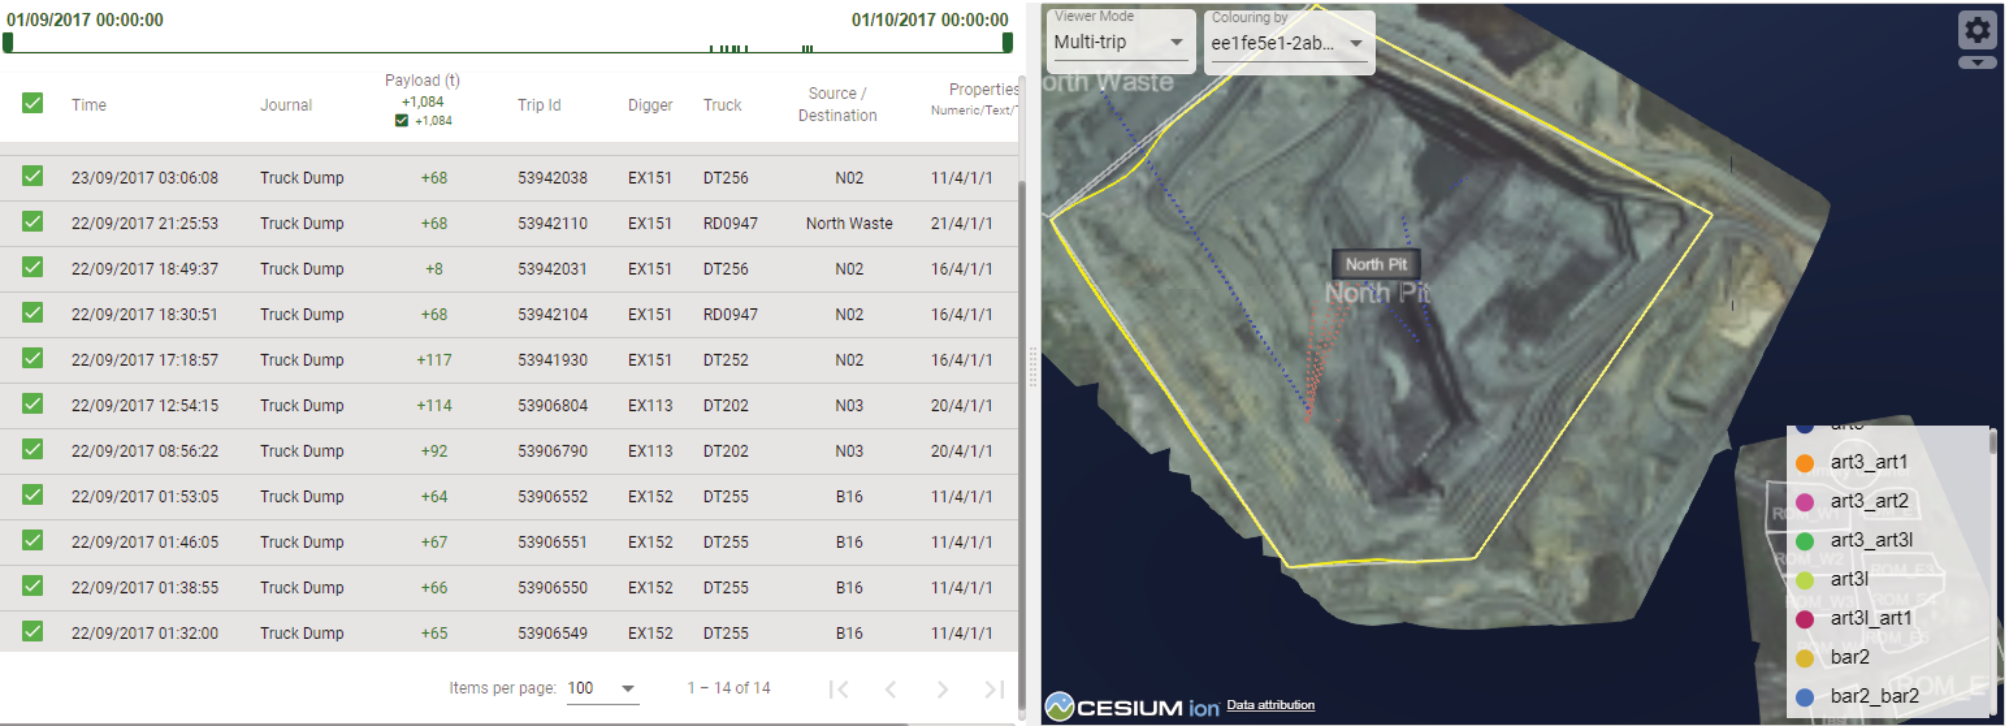
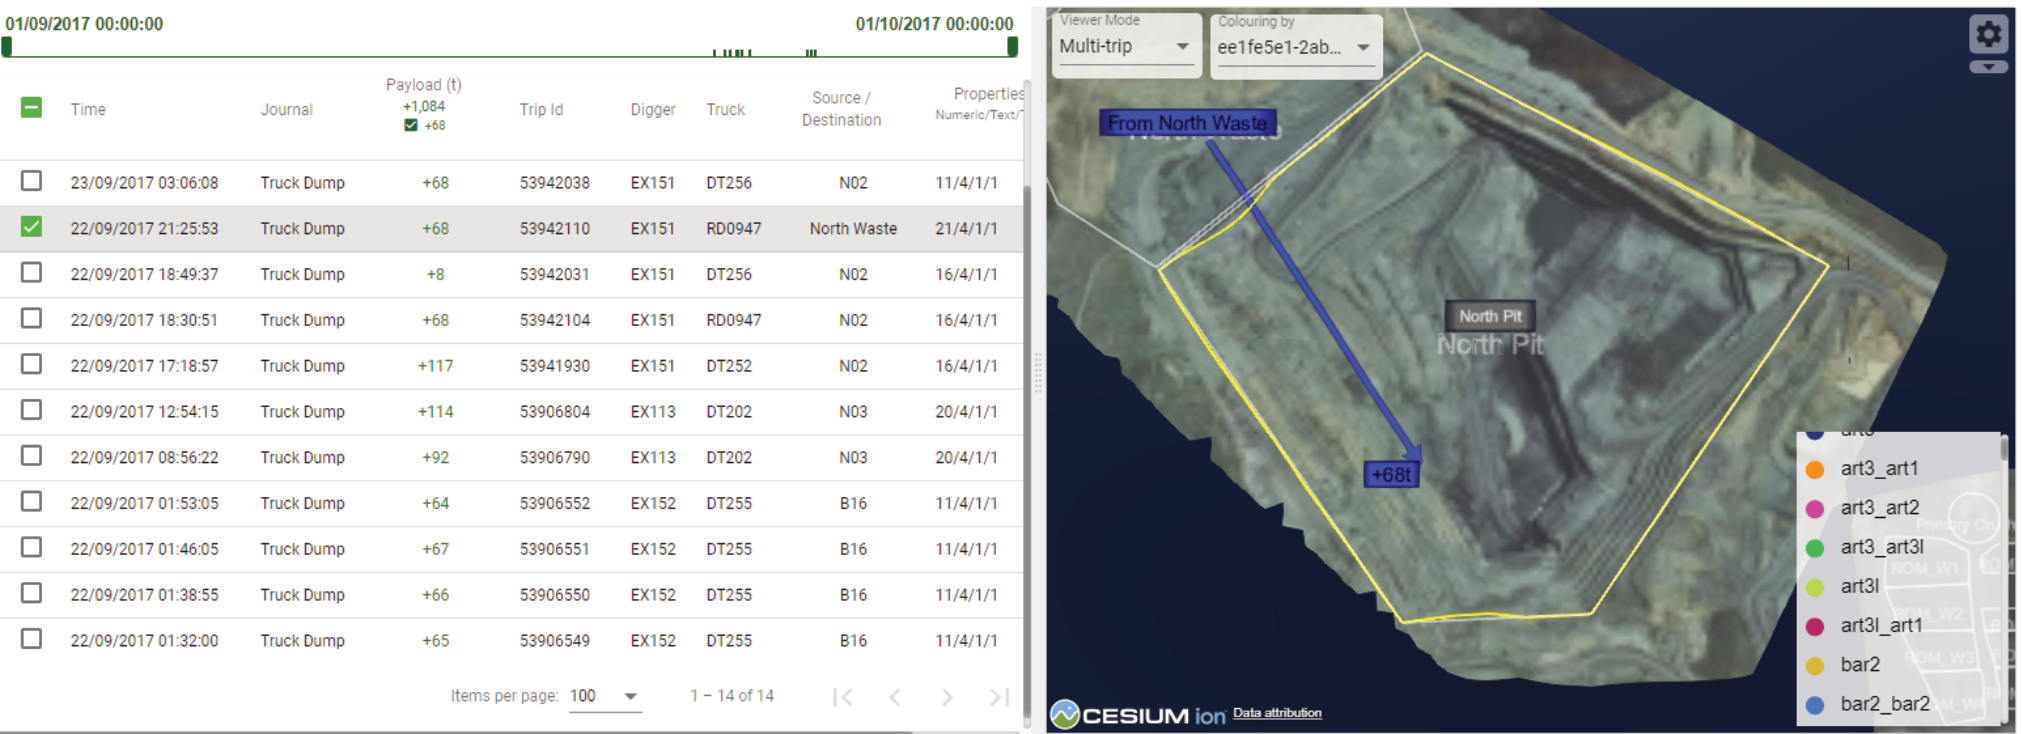
Multi-Trip
All trips to and from the stockpile are shown. The passage of each trip is represented as dotted lines.
- Select a checkbox to view a specific trip. The line connecting source and destination becomes solid, and its tonnage label is displayed.
- Select multiple checkboxes to show only those trips. The lines connecting sources to destinations revert to being dotted.
-
Select the Colouring by scheme from its drop-down list which is adjacent to the Viewer Mode drop-down. The colours of the lines are based on the chosen schema.
-
Manipulate the view as required to best accommodate the area of interest.
-
In Single-trip viewer mode, hover over any row in the stockpile movements table to show its path in the viewer.
-
In Multi-trip viewer mode, use the checkboxes in the stockpile movements table to display their paths in the viewer.
-
In the Properties column of the stockpiles table, hover over an item to view a tooltip showing its details.
|
A trip is selected in single-trip viewer mode. |
|
Multi-trip viewer mode with a single trip selected and its arrow being displayed in its property colour. |
|
Multi-trip viewer mode with multiple trips selected. All trips are displayed as dotted lines. |