 Mine Plan
Source file: mine-plan.htm
Mine Plan is a menu of tools that allows users to visually compare actual and designed schedules, query and examine schedule performance, and use this information to develop new scheduling strategies using the following:
|
|
Visualise current or past truck movements and their compliance to the design schedule. |
|
|
Query, create, or manage schedules and examine productivity against the overall plan on a chart. You can also export your data to a Microsoft Excel spreadsheet. |
|
|
Formulate and test mine plans to create accurate schedules. |
Mine Plan - Viewer
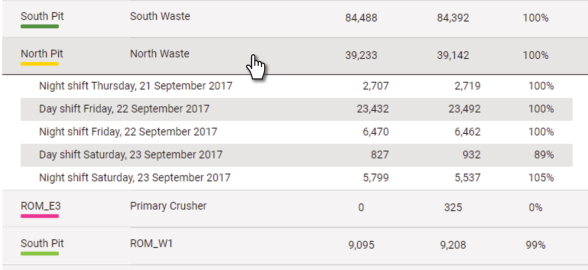
The mine plan viewer allows you to visualise the scheduled movement of material according to its source and destination. This information is arranged in a table that also includes the Mass Moved, Scheduled Mass Movement, and % Completed.
A source and destination are defined as zones where scheduled activities occur.
-
Hover over a row in the table to reveal attached schedules, as illustrated.
Movements are displayed as source-to-destination arrows. To help identify different movements, colour indicators are used. The same colour tags are used in the list to help identify the listed items with the viewer items. A wider arrow overlaying the movement indicates the following:
-
Compliance with the schedule using a colour spectrum where green is on schedule and colours changing towards the red are increasingly behind schedule.
-
The degree of completion is indicated by the arrow's position. The closer the arrow is to the destination, the closer the movement to completion.
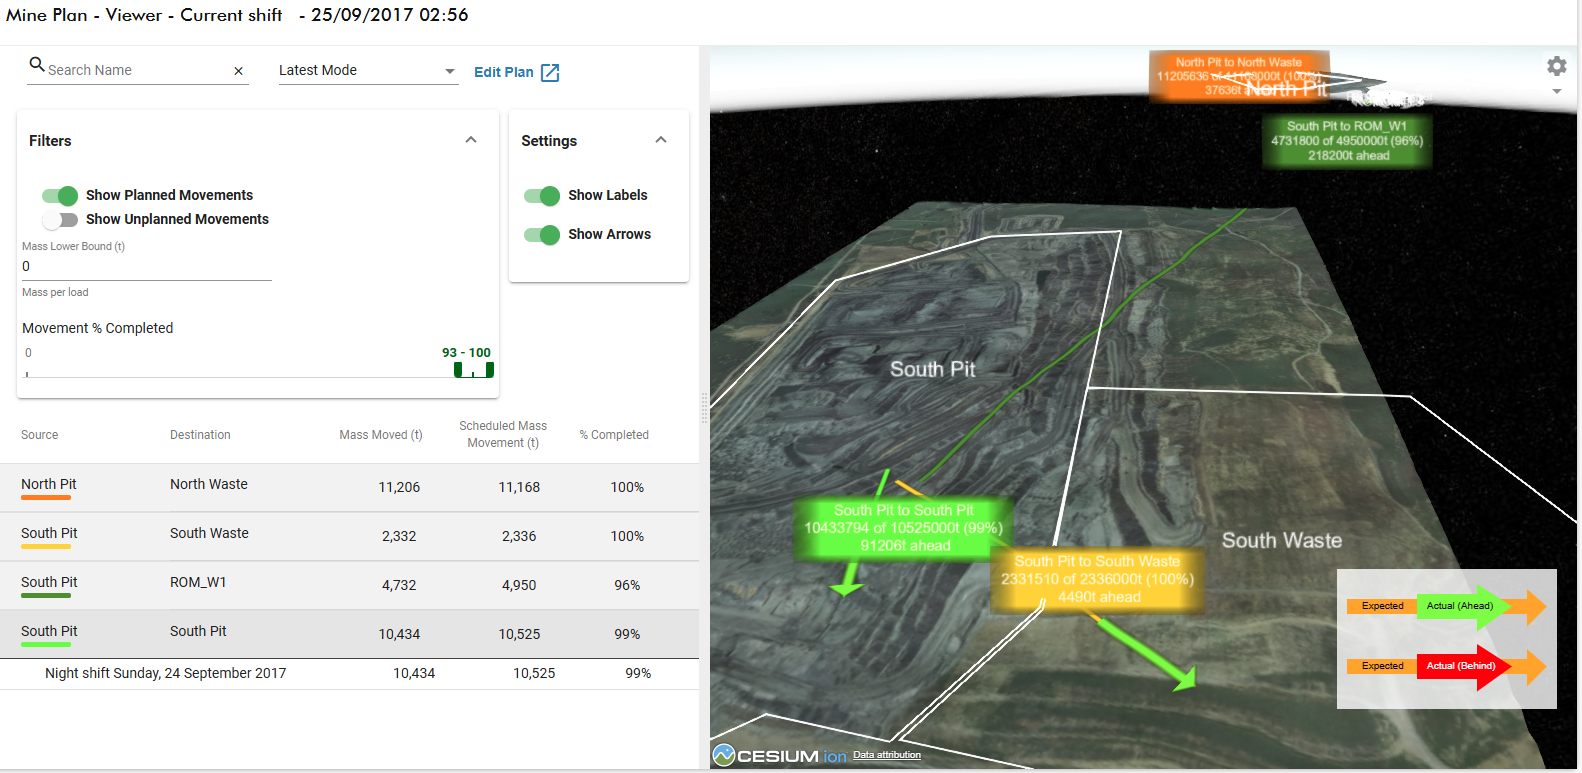
Tip: If you don’t see any movement arrows in the viewer, enable the Show Arrows toggle in the Settings drop-down.
Selecting data in Mine Plan - Editor
Information in the mine plan editor table can be searched, filtered and organised to provide the required data.
-
Use Search Name to find any value displayed in the table. The results are updated as you type.
-
Select Historical Mode or Latest Mode from the drop-down. When historical mode is selected, use the time picker to select the period of interest.
-
Click
 to open the Mine Plan - Editor page. Use this to interactively add, alter, or remove plans from this page. To learn more about the mine editor, see Mine Plan > Mine Plan - Editor.
 -
Open the Filters drop-down to further refine what is displayed in the view.
Use the corresponding toggles to independently select Show Planned Movements and Show Unplanned Movements.
-
When only the Show Planned Movements toggle is active arrows follow the zone colour.
-
When only the Show Unplanned Movements toggle is active, each scheduled source item is allocated a unique colour.
-
When both toggles are active, planned movement arrows are blue and purple for unplanned movements.
-
Enter the Mass Lower Bound. The value entered will cause the system to ignore tonnages below the set threshold.
-
Use the Movement % Completed slider to refine which events to include within the progress range by dragging any of the two sliders, as illustrated.
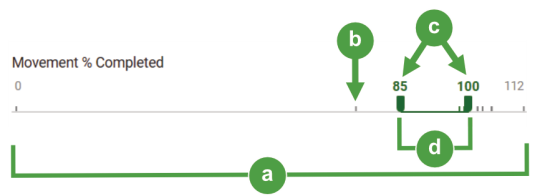

Scheduled movement timeline 
Sliders 
Movement outside of selection 
Selection made by the sliders
Filtered results are displayed in a table under your filtering options. The listed contents vary depending on your filters, as follows:
-
Planned schedules are grouped by zone. Hover over a row to reveal the list of individual movements originating from that zone.
-
Unplanned schedules are listed individually.
-
Combined schedules are grouped by movements from the same origin to destination. Click on the row to reveal the list of individual movements.
Performing tasks in Mine Plan - Viewer
Use the mouse to identify movements in the table or in the viewer.
-
Hover over the listed item in the table to highlight its arrow in the viewer. If the label is hidden, it will be displayed.
Tip: If you prefer labels to be constantly displayed, open
 (Settings) then open the Plan Vs Actual Viewer drop-down and enable Show Labels.
-
Click on a row in the table. This will centre the source zone or location of the movement in the viewer.
-
Hover over an arrow in the viewer to highlight the matching listed item in the movements list.
The label displayed when highlighting an arrow contains the following summary:
- The source and destination of the material being moved.
- The tonnage of the material obtained and remaining, and a percentage of that ratio.
- The degree of compliance with the schedule.
Mine Plan - Editor
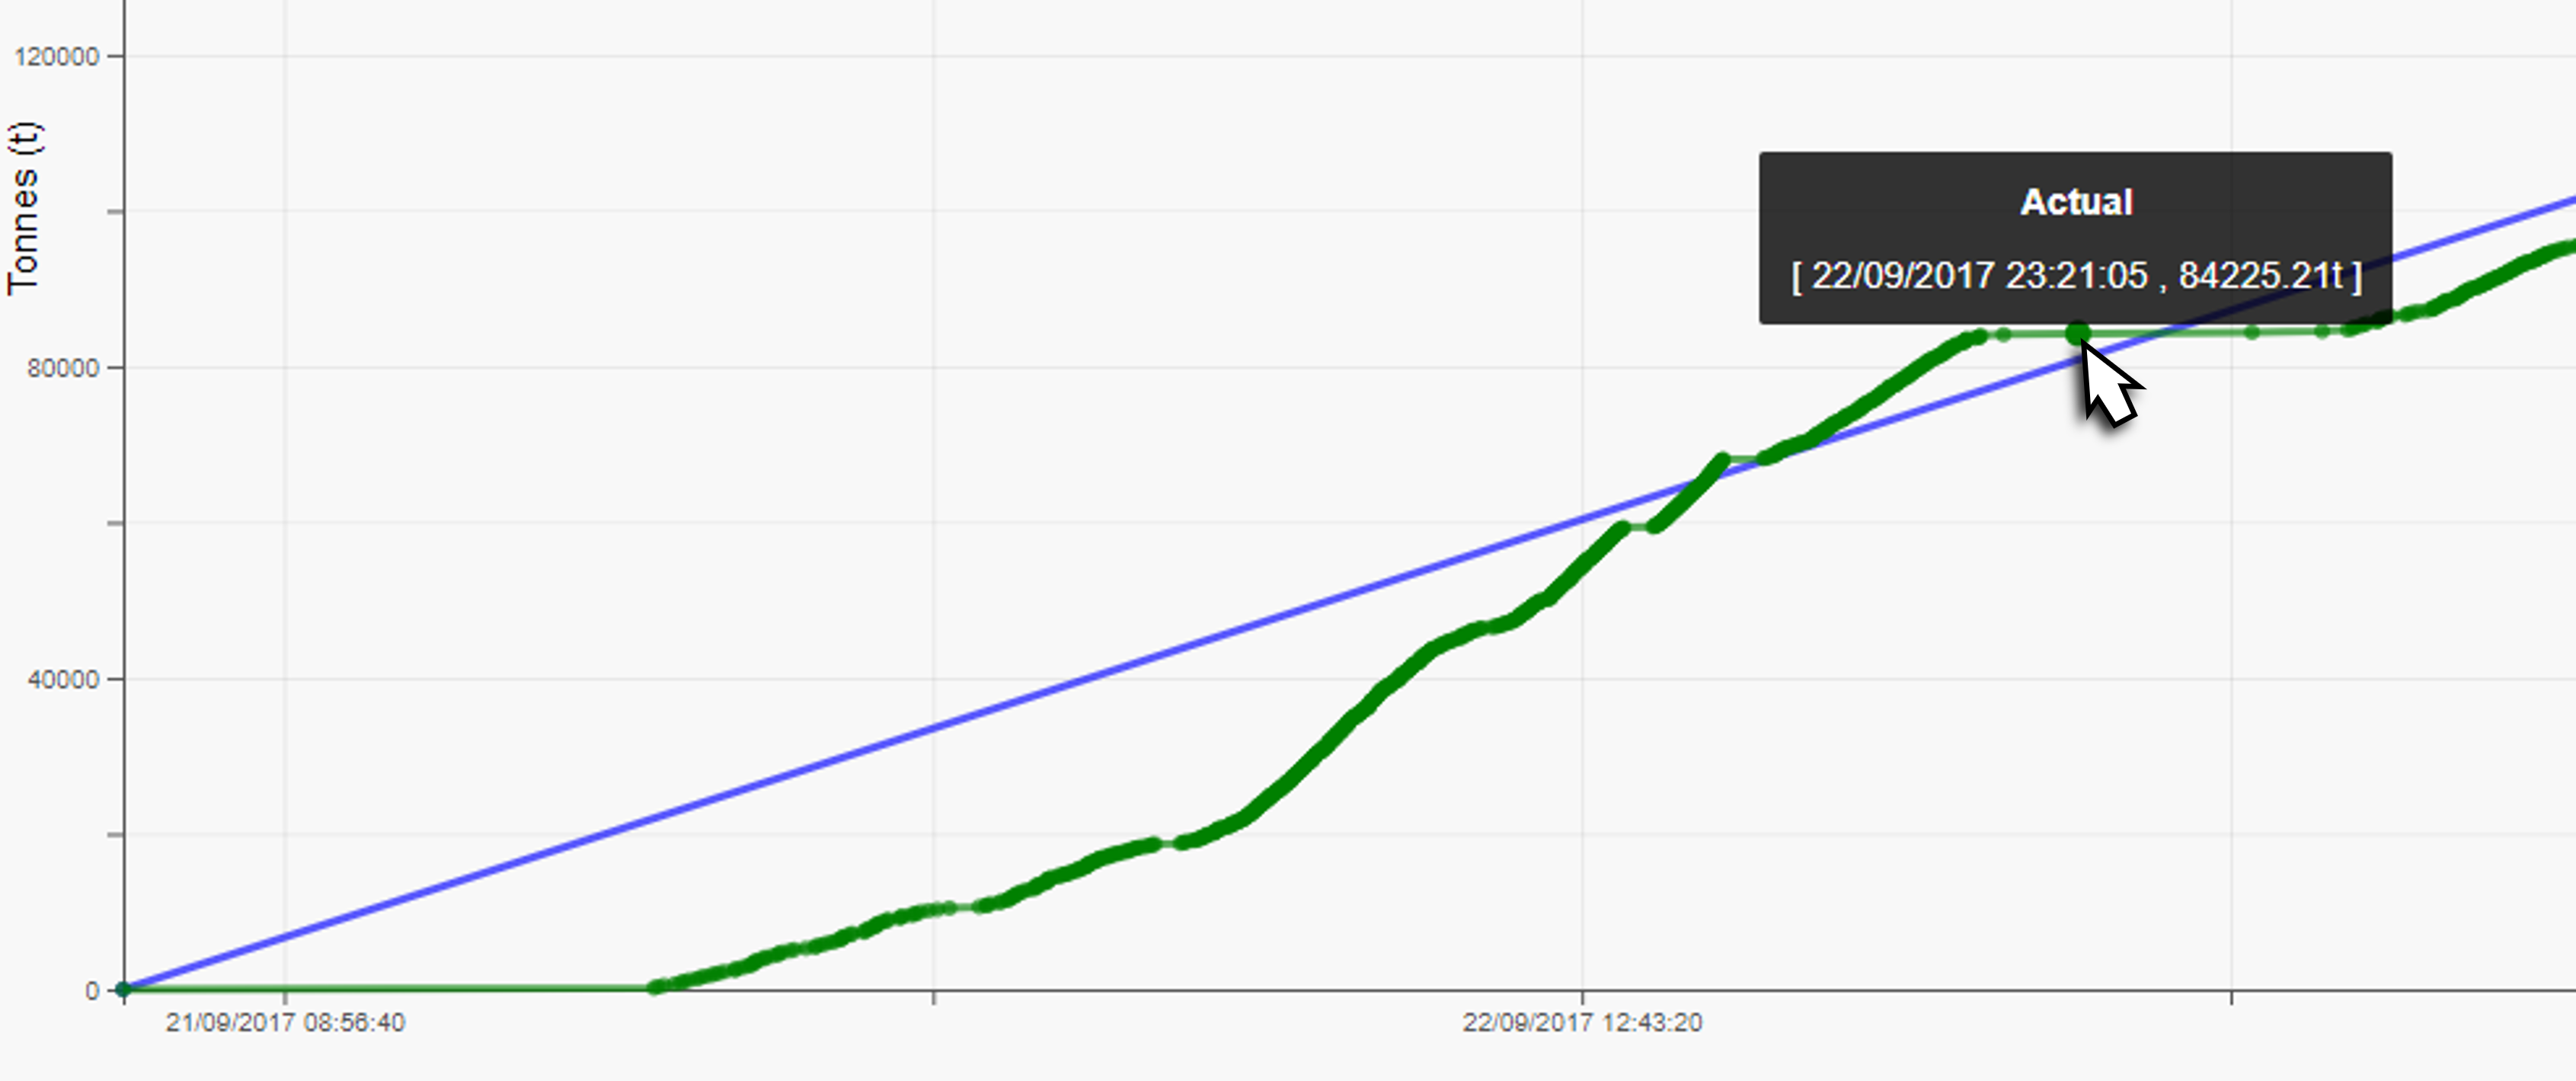
The Mine Plan - Editor displays information about scheduled items and related statistics in a customised table. They are compared in a chart comparing Actual to Plan tonnage over a given period, such as a shift or user-defined selection.
The mine plan editor allows schedules to be changed for users with applicable roles or new schedules created to meet operational needs.
-
Use the Time drop-down to select the period of time containing the required schedules.
-
Use the Schedule drop-down to select which shifts within the period of time to include.
-
Select which columns to display using the
 drop-down.
Any of the following columns (except Schedule) can be selected, as illustrated:
Schedule Start End Source Destination Truck Name Digger Name Mass -
Change the sort order of any row by clicking its header. The sort order is also preserved when exporting your data.
The chart will be plotted, which is continuously updated as you filter your data.
Viewing the chart
The mine plan chart plots tonnage against time using the currently selected period and included schedules (Actual), and a slope representing the planned schedule (Plan).
-
Use the checkboxes in the table to select specific schedules to display in the chart.
-
Hover over a plot to see a tooltip showing the time and accumulated tonnage for that trip.
Creating and modifying schedules
The mine plan editor allows you to create, modify, or delete schedules as required. A schedule created in Mine Plan - Editor is called local and listed in the table as such.
-
Create a new schedule by clicking
 . When the schedule dialog opens, select the time, then enter the required information in the Schedule dialog and click
  .
. Click here to view the Schedule dialog entries.
Time
The period over which the schedule occurs. Use the drop-down to select a time period or use the calendar picker to select a custom Date and Time. Click
 to close the calendar picker.
Source category
The type of feature containing the source material, such as a pit or stockpile. Use the drop-down to make a selection.
Source
The place from where the source material comes, such as a specific stockpile. Use the drop-down to make a selection.
Destination category The type of feature where the material is scheduled to be moved to, such as a waste dump or sink. Use the drop-down to make a selection.
Destination The place where the scheduled material movement terminates, such as a specific crusher or dump location. Use the drop-down to make a selection.
Mass The tonnage of material to be moved. Enter a value in this field. -
To modify or delete schedules, click
 next to the schedule you want to select in the Action column, then do one of the following:
-
Select Edit to open the Schedule dialog and make the required changes. This opens the same dialog used for adding a schedule.
-
Select Delete(
 ) to remove selected schedules. Selected items will be deleted with no further prompting.
-
Exporting your data to Excel
When you have selected the data to include, click ![]() to export the file to your computer as a Microsoft Excel spreadsheet, as used in the following example:
to export the file to your computer as a Microsoft Excel spreadsheet, as used in the following example:
Schedules_2017-09-22T18_00.xlsx
where:
-
Schedules_is the dataset prefix. -
2017-09-22is the scheduled date expressed as a year-month-day sequence. -
T18_00 is the scheduled end time expressed as the
Tprefix followed byhours_minutes.
Blend Plan Calculator
The blend plan calculator allows you to create target feed objectives based on a set of material properties. After configuring your blend target, you can allocate material sources to satisfy the configured requirements for the plan.
You can create multiple blend plans for each blend target, enabling you to compare outcomes and develop a schedule that meets your production objectives. After a blend plan is saved you can upload it as a new local schedule.
Creating a blend target
Creating a blend target is the first stage in creating a blend plan. During this stage, you are defining the material properties that are required. To create your blend target, follow these steps:
-
Select the Target tab.
-
Enter the blend target name into the Blend target text field.
-
Click the
 button to open the properties editor.
 -
Use the Property drop-down to select your first property.
-
Enter the Acceptable Value Ranges for that property. To do this, click
 to set your From and To value ranges. Repeat this step to add more value ranges.
 -
Repeat step 5 to enter values for Marginal Value Ranges and Unacceptable Value Ranges.
-
Repeat steps 3 - 8 for each property you wish to add to your blend target.
-
Click
 to save your changes.
Blend plans
A blend plan is where you select which sources are used to fulfil your blend target. You can view statistics from individual sources as well as combined sources. You can also experiment by changing which sources you use (such as stockpiles, zones, and polygons) and observing the results. Also, create and save multiple blend plans, then select from various contingencies to include as a local schedule. The following sections will guide you through the blend plan process.
Managing blend plan targets
The buttons below perform the following operations:
|
Blend target selection |
Open the drop-down and select an existing blend target. |
|
|
Add new blend plan targets. For more information, follow the steps in Creating a blend target. |
|
|
Save a new blend target. If you are working on an existing blend target, a dialog with the message “This will overwrite the current target. Are you sure?”: Select either:
|
|
|
Save an open blend target as a new one. This button is only available when you have opened an existing blend target. |
|
|
Remove your blend target from the list. A confirmation dialog appears before that item is deleted. |
|
|
Add your blend plan as a local schedule. To see this button, select a plan from the Blend Plan drop-down. |
| Displaying x float properties |
Open this drop-down to select other existing source properties. You will need to assign value ranges as described in Creating a blend plan. Note: <x> is the number of selected properties displayed in the drop-down. |
Creating a blend plan
To create a new blend plan, select the Plan tab, then do the following:
-
Select the blend target you want to add the blend plan to. If you haven’t created a blend target, follow the steps for Creating a blend target.
-
Select the Plan tab to open its panel.
-
Enter the name of your blend plan in the Blend plan field and click
to save your changes. -
From the Selected Sources section, click
 and select one of the following:
-
Manual: Enter the name of the source (the default name is Manual), mass, and property values in each column field.
-
Polygon: Create a polygon in the viewer over the source area. Material within your polygon is included in your plan.
-
Stockpile: Click on a stockpile in the viewer to select it. Material within the stockpile is included in your plan.
-
Zone: Click on a zone in the viewer to select it. Material within the zone is included in your plan.
-
-
Click
to save your blend plan.
After creating your blend plan, your blend plan sources are listed in the Selected Sources section. You may now do any of the following:
- Add additional sources, using in step 4.
- Select or deselect sources by clicking on the row or, on its checkbox.
- Delete a source selection using the
 button.
The Selected Sources table contain the following columns:
- Selections: These are your source selections from which materials are to be taken.
- Type: This is the source type, such as Manual, Polygon, Stockpile, and Zone. The coloured dot identifies the source type shown in the viewer.
- Mass: This is the quantity of material available in the given source.
- % of Total Mass: This is the percentage of that source material for the combined mass from all your sources.
- Float Properties: These are your currently selected properties (per column). Use the Displaying x float properties drop-down to include in the Selected Sources table.
Using Combined Sources to set your blend plan
After adding sources to your blend plan, review the information in the Combined Sources section. In here, do the following:
-
View the Combined Sources tonnage as a single bar graph, and material properties allocated to your plan.
-
Include or exclude materials from your selected sources as required.
-
Set the Mass target by entering values in the Min and Max fields.
You may also do the following in the combined sources section:
- View material sources as gauges or histograms by selecting
 or
or  respectively.
 - Select which sources to display using the Displaying x float properties drop-down list.
Tip: Click ![]() to save your blend plan when satisfied with your settings. The current blend plan can be overwritten, or it can be saved as a new blend plan.
to save your blend plan when satisfied with your settings. The current blend plan can be overwritten, or it can be saved as a new blend plan.
Adding a blend plan to a schedule
A local blend plan is one that is created by a user and annexed to existing schedules, similar to the Mine Plan Editor. The plans are labelled as "Local" when listed. To schedule a blend plan, do the following:
-
Select the blend plan from the Blend plan drop-down list.
-
Click
 to open the Schedule dialog box.
 -
In the Time field, select the time or shift to add your schedule to. You can use the drop-down to select a preset entry, or create a custom time using the calendar picker.
-
In the Destination category field, select the destination type from the drop-down list.
-
In the Destination field, select the destination from the drop-down list.
-
Click on the
 button to close the dialog box. Your local schedule is added to the mine plan.
Reviewing the remaining material
When a blend plan has been created, you can review what remains at all sources. This is shown in the Remaining Material section. To determine the remaining material from your currently selected sources, or from any other additional sources, use the Zones drop-down list.
Select any additional sources that you wish to include using the checkboxes. The chosen sources are listed in the Selections column. The remaining material is shown under the Mass column.
Note: Sources that you selected to create your blend plan are automatically selected and appear greyed-out in the drop-down list. They cannot be deselected.
You can also list sources by the stockpiles within the zones used in your blend plan, and your additional sources. To enable this, click on the Show by stockpile checkbox. Those stockpiles are added to the list.
Tip: By adding additional sources, you can quickly determine which sources can be used to produce suitable blend plans.
