 Outflows
Source file: outflows.htm
The Outflows menu has tools to reconcile data received from the FMS against lab and analyser results. This information is presented as follows:
-
Viewer by time: Analyse and view material sent to selected sinks (crushers, etc.); compared with corresponding lab results. To learn more, see Outflows - Viewer By Time.
-
Viewer by area: Determine the difference between lab or analyser samples to outflows within a selected area. To learn more, see Outflows by area.
-
Chart: View how lab and analyser results compare to each other for a selected outflows metric over a selected period of time. To learn more, see Chart.
Viewer By Time
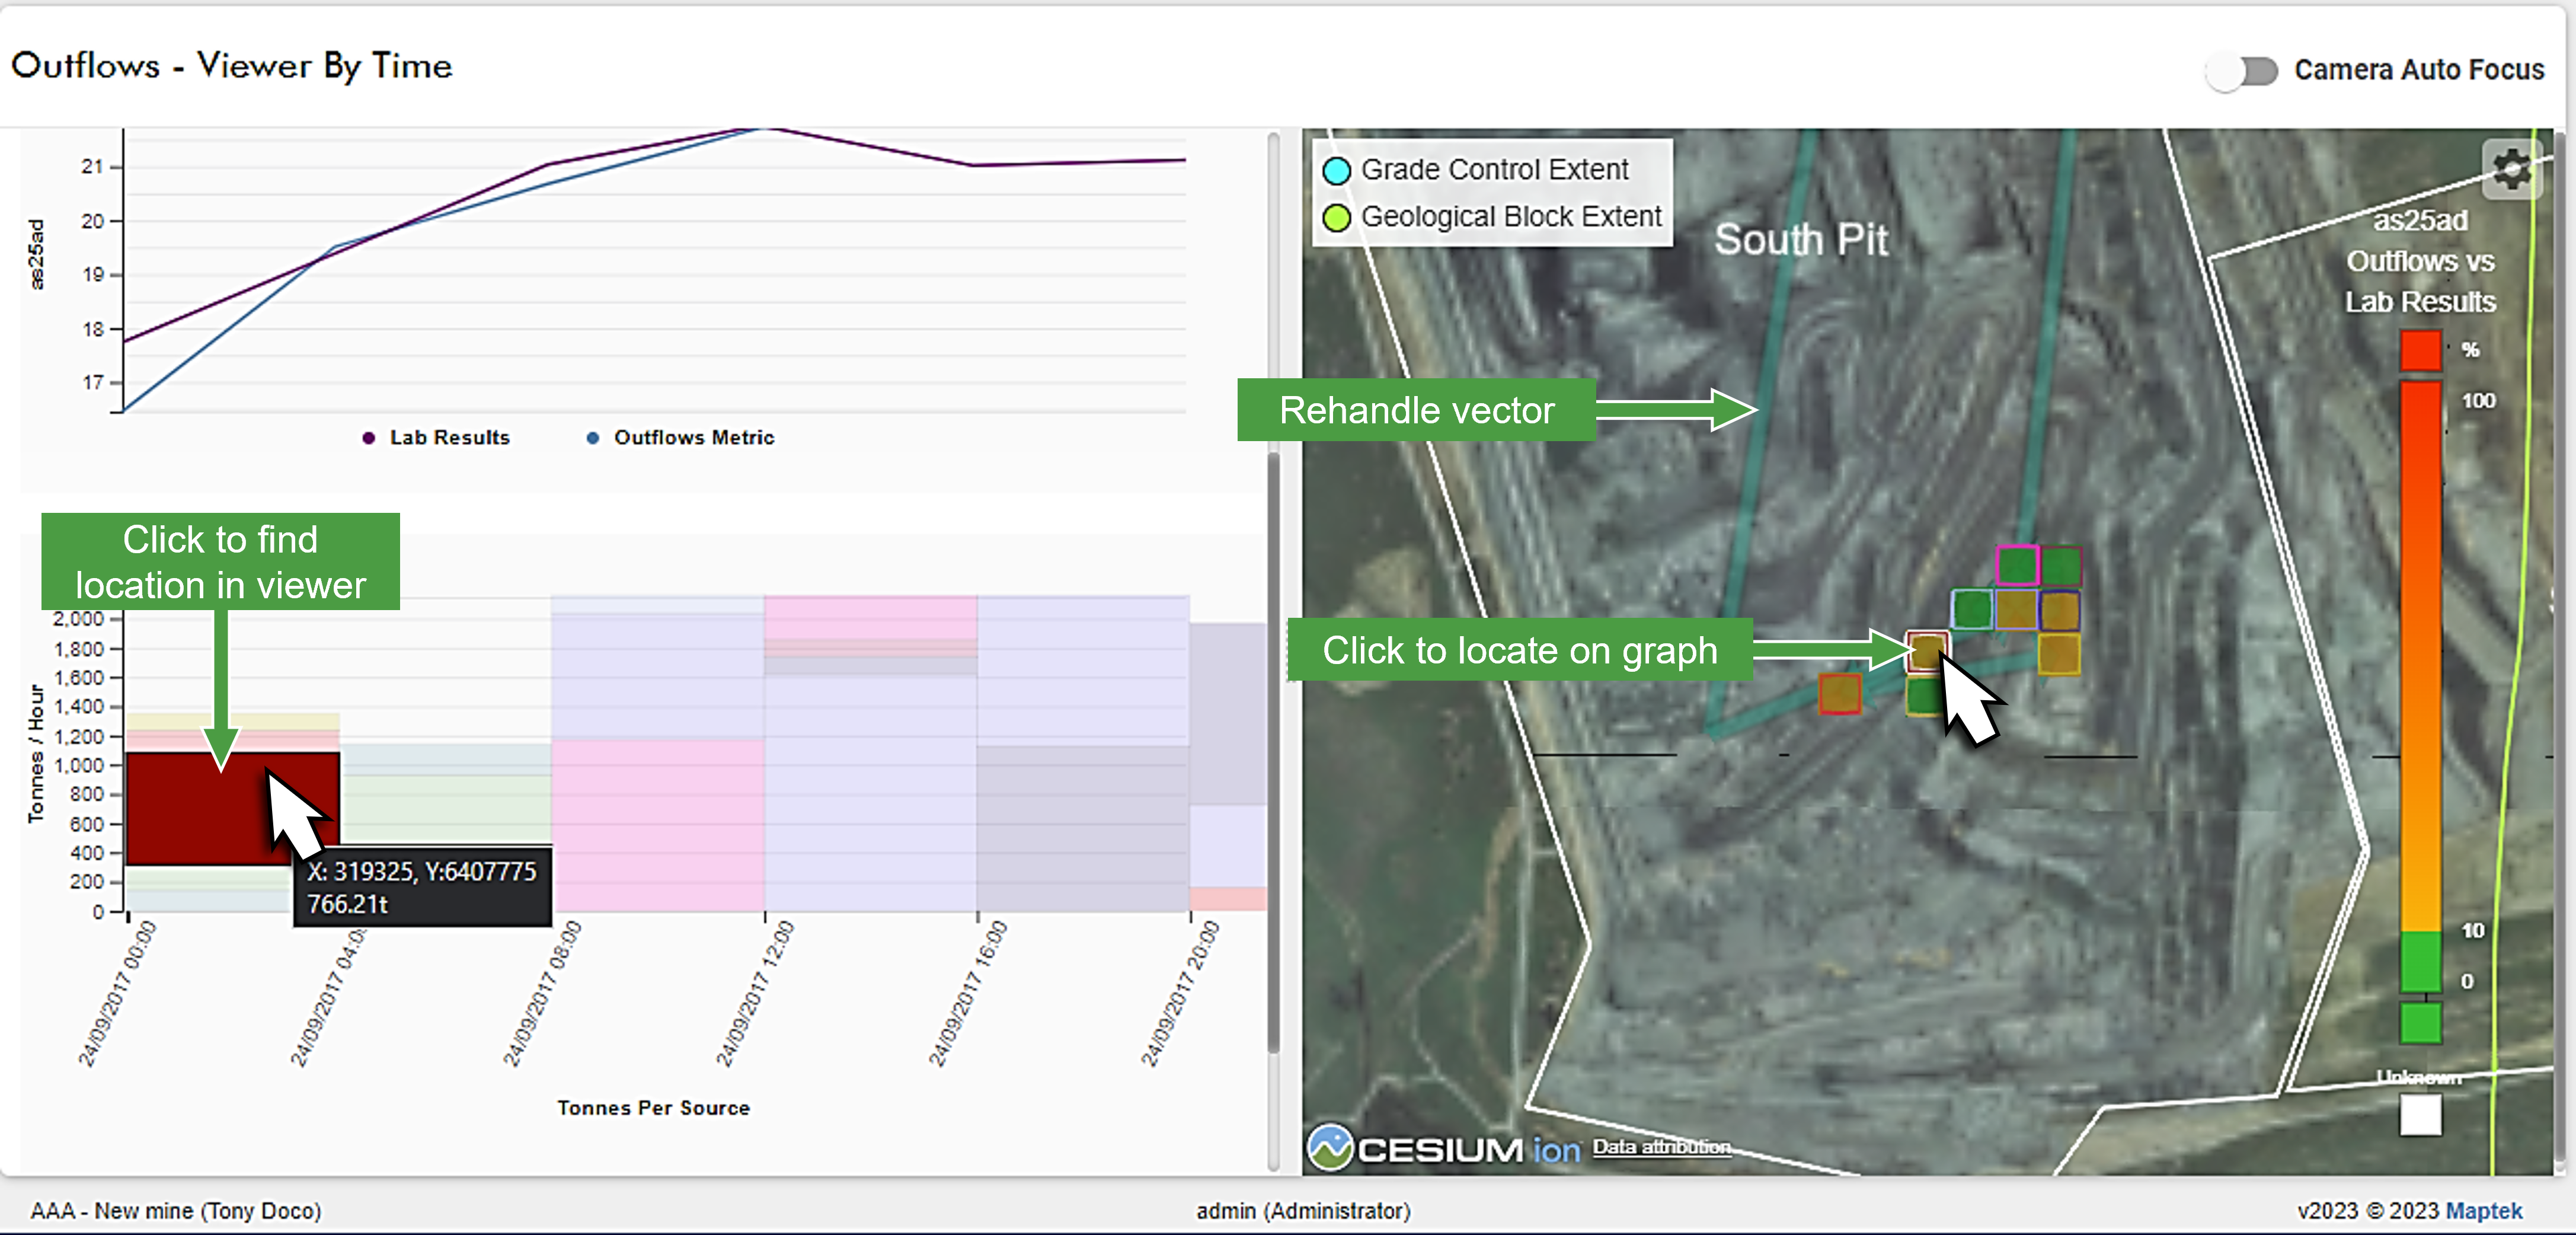
The Outflows - Viewer By Time page charts your selected outflow metric (property) and compares this to your lab results over a given period of time. Your results are shown in two panes. The left-hand pane displays the following:
-
A chart comparing your selected outflows metric and the options of outflows vs. metrics, outflows, or lab results (specifically the quality of the material property).
-
A stacked tonnes/hour vs. tonnes per source chart that provides the location of a given segment in the viewer. You can also click on a specific block in the viewer to locate a segment of data in the chart.
The viewer pane displays the following:
-
Source and destination markers of outflow material. These appear as coloured squares with a coloured border, representing a load or dump location.
-
Links connecting the movement of re-handled material to a stockpile or sink.
Generating a Viewer by Time query
Create your query by following these steps:
-
Use the Latest Mode/Historical Mode drop-down to select either option. If you select Historical Mode, proceed to step 2. If you select Latest Mode, proceed to step 3.
-
Use the Time drop-down to select a set period, or use the calendar picker.
-
Expand the Zone drop-down and select any of the available sink zones.
-
Expand the Outflows Metric drop-down and select the property type to sample.
-
Expand the Time Interval drop-down and select the required period.
-
Expand the Spatial Colouring drop-down and select one of the following: Outflows vs Lab Results, Outflows, or Lab Results.
Based on your selection the following information will be displayed:
-
A line chart that displays the selected outflows metric and spatial colouring.
-
A stacked bar graph representing the tonnage rate of all outflows and sources.
Note-
Grade control blocks are only within light blue boundaries.
-
Geological blocks are only within light green boundaries.
Tip-
Click on a source marker in the viewer to highlight corresponding data on the graph.
-
Click on a bar segment in the graph to locate the source marker in the viewer.
-
The pale teal lines indicate the direction of movement of rehandled material.
-
Enable the
 toggle to allow the camera to continuously accommodate all tiles within the view.
 The diagram below shows an example of the Outline - Viewer by time page.
-
Viewer By Area
The Outflows - Viewer By Area page allows you to select an area within grade control and geological extent boundaries. In this page, blocks represent all movements that have ever occurred at that location.
To use this viewer, do the following:
-
Click
 , then create a polygon over the area of interest.
 -
Expand the Tile Size drop-down and select a suitable size, if required. Smaller tiles (<25 m) are suitable if high-accuracy coordinates and GPS data is available. Tile sizes larger than 30 m are a recommended nominal size.
-
Click the
 button to display any geological or grade control blocks within your selection.
 -
Expand the Outflows Metric and Lab Metric drop-down and select the required metric for each.
-
Expand the Spatial Colouring drop-downs and select any of the following:
-
Over/Under Outflows vs Lab Results: This scheme indicates variance, the greater the colour strength, the greater the outflow or lab result, respectively.
-
Outflows vs Lab Results: Select this scheme to view the variance between your outflows and lab results.
-
Outflows: Select this scheme to view outflow values only.
-
Lab Results: Select this scheme to view lab results only.
-
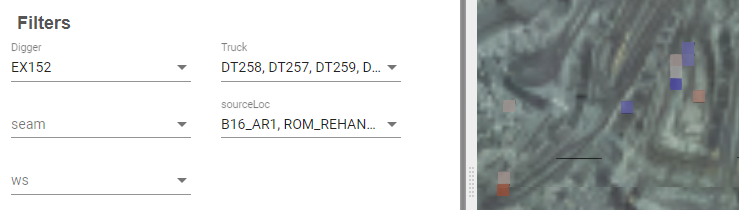
Applying additional filters
You may need to disregard some information from your sample; for example, only include a particular truck, property, or even vertically filter (z level) the data. For each drop-down in the Filters section, select available items to include. In the following example, filtering options were applied to Digger, Truck, and sourceLoc. The remaining drop-downs, seam, and ws are not filtered and default to all items.
Filter by Z Level
Filter your current results by setting an upper and lower vertical extents boundary. This is useful when isolating information related to a particular bench or allowing for changes in the local terrain. To apply the z level filter, do the following:
-
Enable the
 toggle to enable the upper and lower bound fields below it.
 -
In the Z level Lower bound field, enter the lowest allowable height.
-
In the Z level Upper bound field, enter the highest allowable height.
The filter now excludes items that are outside the set bounds from your view.
Confidence
Confidence allows you to set the amount of blending of the lab and surveyed material properties by the number of source samples over a time period. Select the following Crusher Blending Tolerance radio buttons:
-
Low: Time periods only blend materials from relatively few sources.
-
Medium: Time periods can blend materials from a moderate number of sources.
-
High: Time periods can blend materials from many sources.
Direct feed only
Enable the  toggle to only include data that has not been rehandled.
Chart
The Chart page allows you to compare current or historical lab and analyser results for a given property (outflow metric). To create a query, do the following:
-
Select Historical Mode or Latest Mode from the drop-down. If Historical Mode is selected, use the Time drop-down to select a period or use the calendar picker.
-
Expand the Time Interval drop-down and select the preferred interval.
-
Expand the Zone drop-down and select the required outflow zone.
-
Expand the Outflows Metric drop-down and select the specific outflow property.
-
Expand the Analyser drop-down and select the analyser (if required).
-
Expand the Analyser Metric drop-down and select the outflow property to chart (if required).
-
Expand the Lab Result Metric drop-down and select the outflow property to chart (if required).
As your selections are made, the chart is plotted. The top chart shows your outflows, analyser, and lab result plots and the bottom graph compares the system and analyser tonnage over the stated time period.
