 Reports
Source file: reports.htm
The Reports menu provides four different tools that generate the following:
-
Stockpile Ons and Offs: This report itemises incoming and outgoing changes in stockpile tonnage over a given period of time. To learn more, see Running stockpile ons and offs reports.
-
Tonnage Reconciliation: This report uses FMS data showing the amount of material (based on a text property) moved from the pit to other zones and from zones to outflow over a given period of time. Actual versus Mine Plan quantities determine the Variance, and their totals are summarised for each zone category. To learn more, see Running tonnage reconciliation reports.
-
Stockpile Inventory: This report shows the inventory of properties by mass in each stockpile and export it as a Microsoft Excel (
XLSX) file. To learn more, see Running stockpile inventory reports. -
Trips: This report displays which primary text properties and associated numeric and secondary text properties were present in the period of time that the trips occurred. To learn more, see Running trips reports.
Running stockpile ons and offs reports
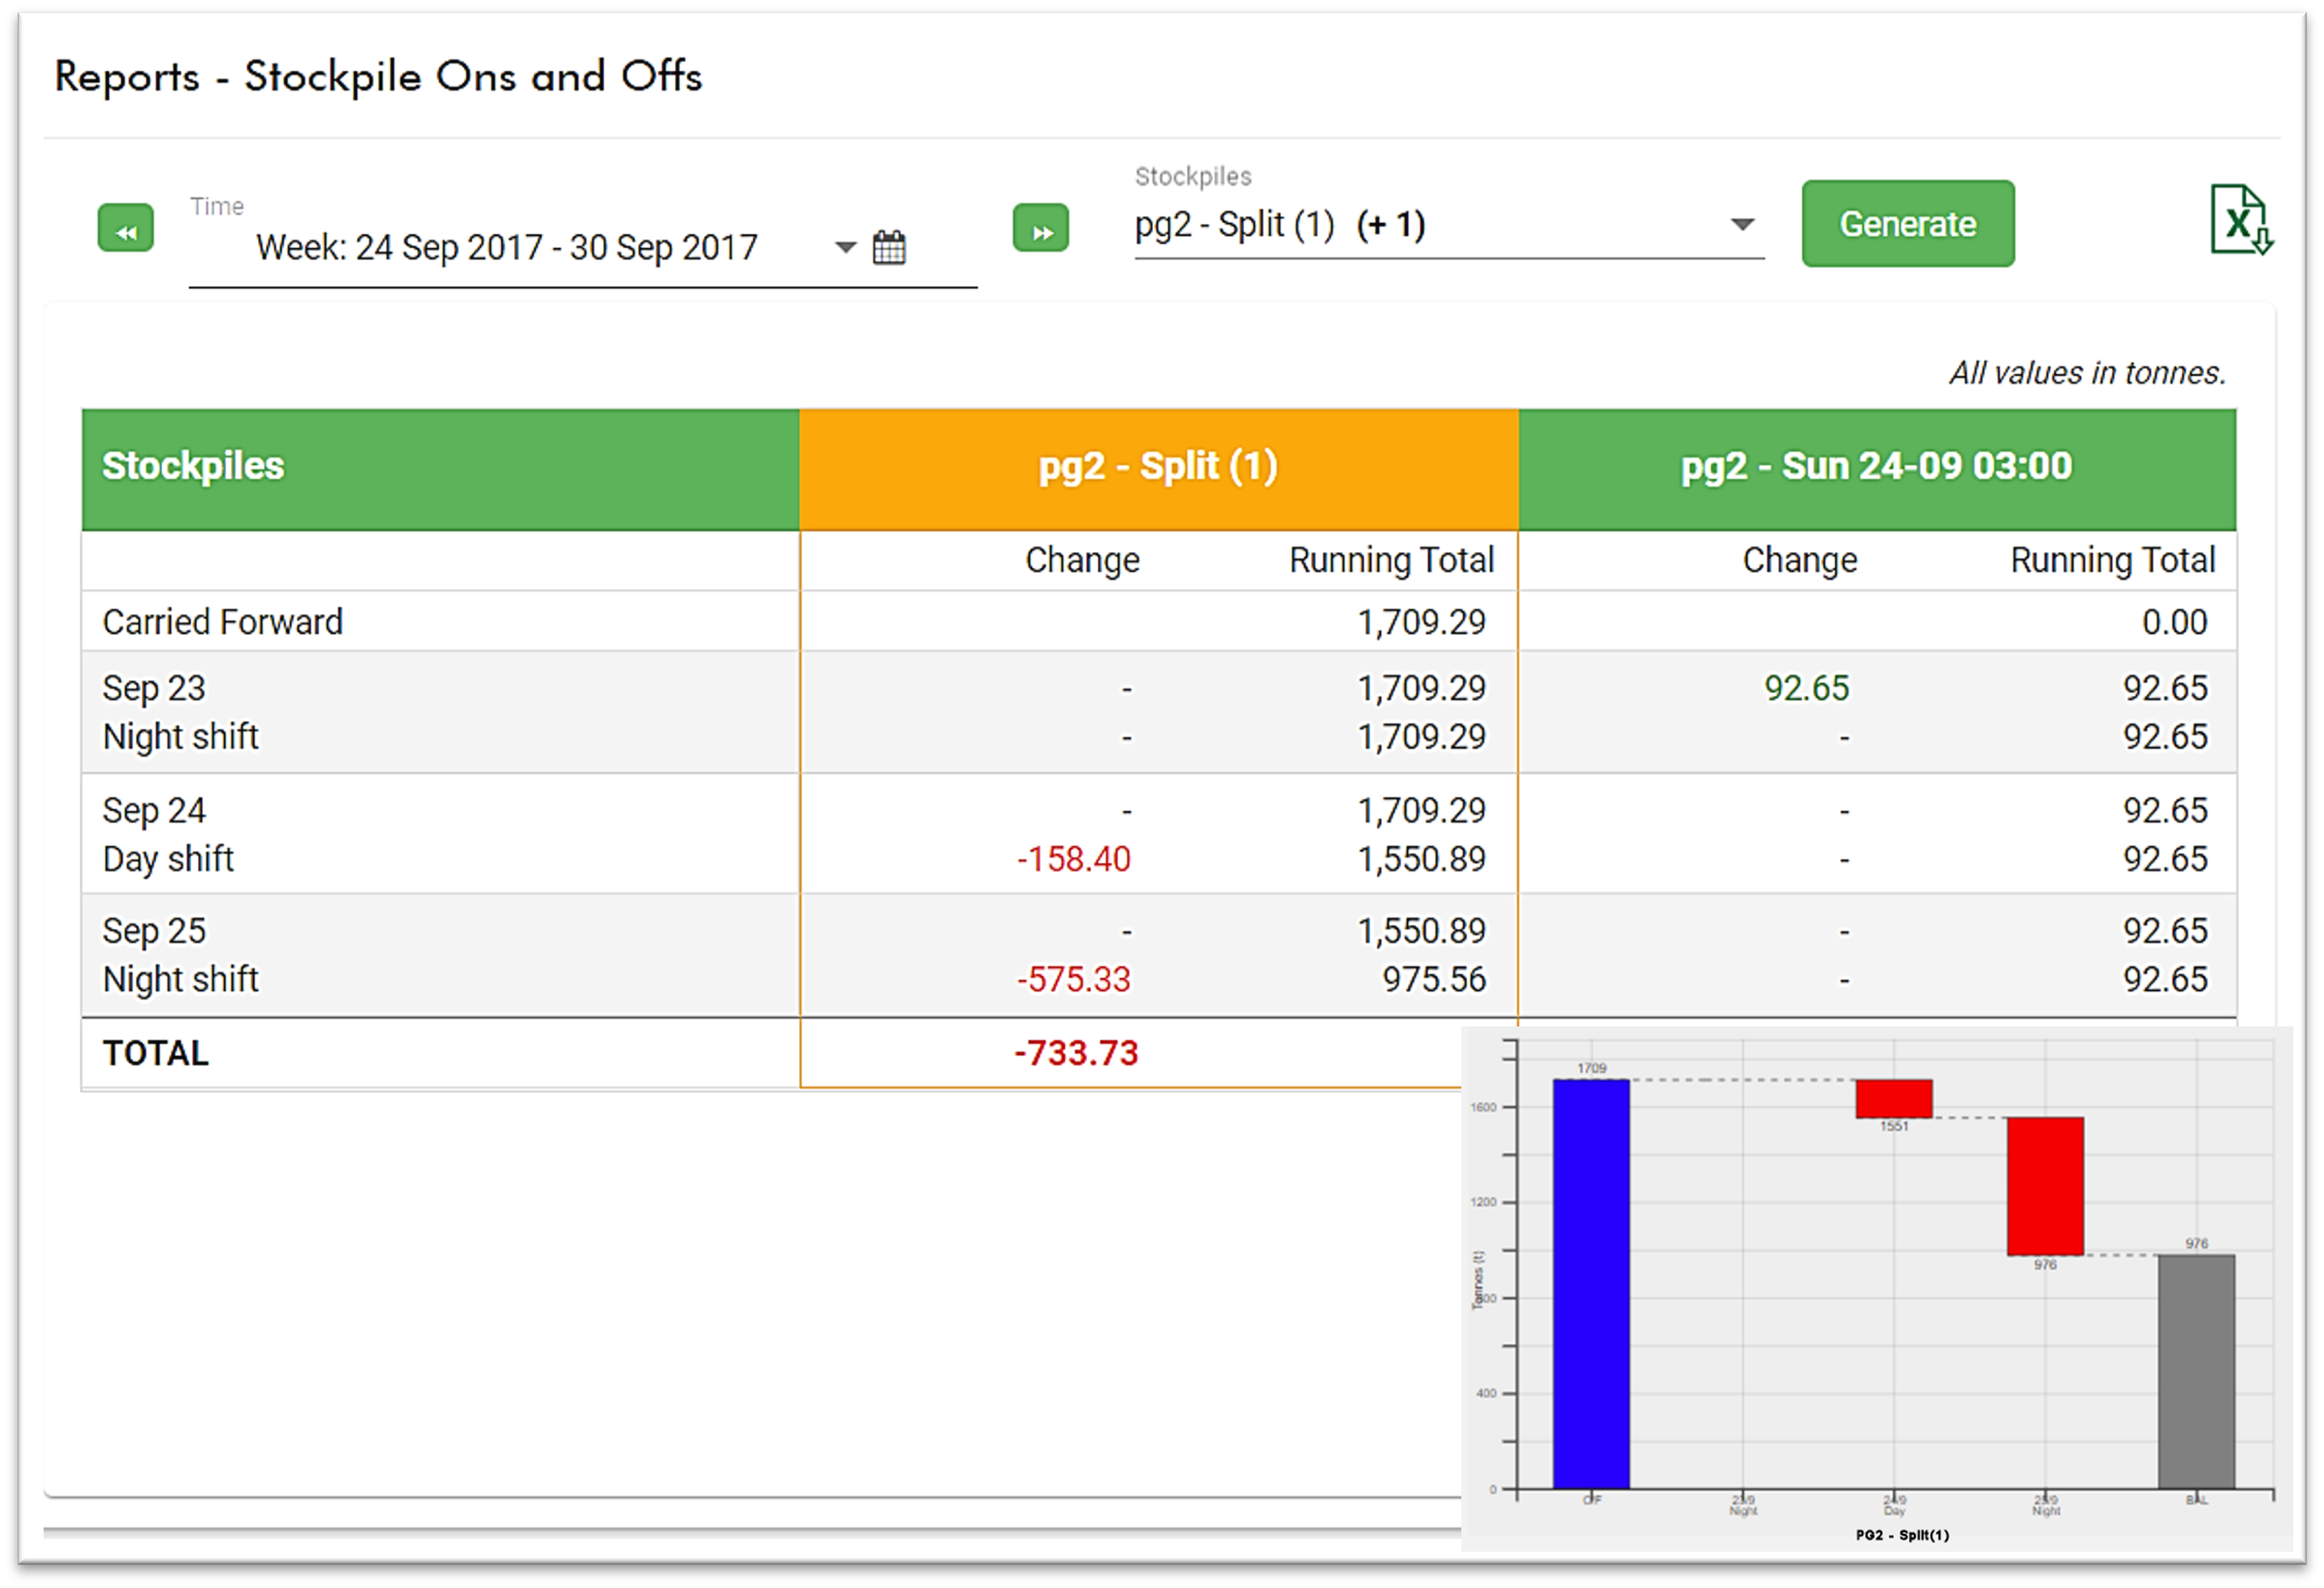
Reports - On and Offs reports changes in the mass of a stockpile as material is added to (ons) and removed from (offs) the stockpile. A total and running total is tabulated for each stockpile. To generate an On and Offs report, follow these steps:
-
Open the Time drop-down or use the calendar picker to select the required time range.
-
Open the Stockpiles drop-down and select which stockpiles to include.
-
Open the Filter drop-down and select one of the following:
-
Ons only: Only material added to selected stockpiles is accounted for in the report.
-
Offs only: Only material removed from selected stockpiles is accounted for in the report.
-
Ons and Offs: Material added to and removed from selected stockpiles are accounted for in the report.
-
-
Click
 to create the report.
 In the example below, tonnages for each shift inside the date range are listed for all queried stockpiles in their own columns.
Viewing additional information
After generating your report, you can examine information in more detail, as follows:
- Hover over any column to show a small pop-up waterfall chart.
- Click on the column header of any stockpile to see an expanded view. A panel will open containing statistics from the stockpile.
Interpreting on and offs report data
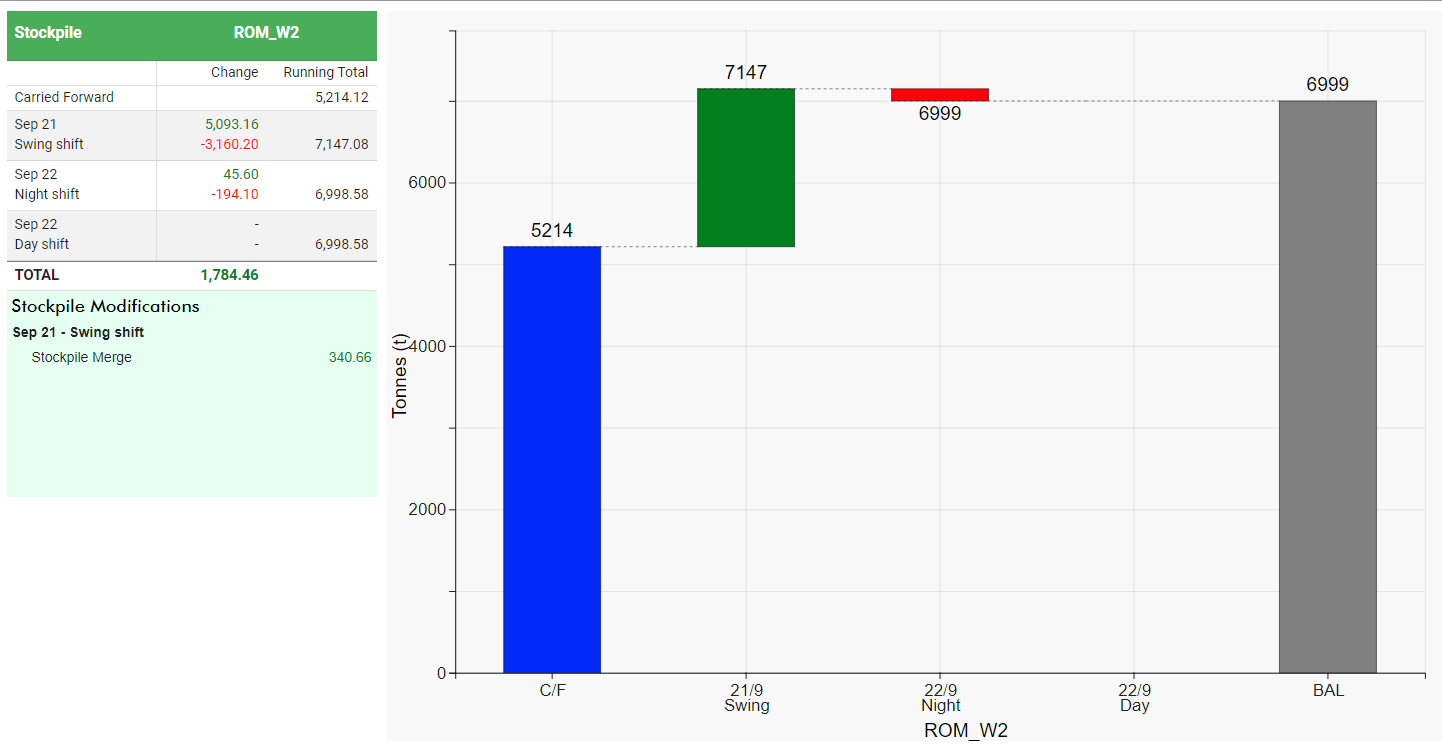
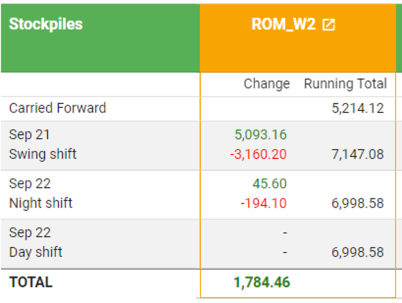
Each stockpile has its own column, which is subdivided into two columns: Change and Running total. See the example below.
The stockpile ROM_W2 has changes recorded for the swing shift on September 21 and the night shift of September 22. No changes occurred on the September 22 day shift.
In the Change column, the stockpile ons are 5093.16 and 45.6 tonnes and the stockpile offs are -3160.20 and -194.10 tonnes
TOTAL change is the difference of the tabulated on and off values. In this example, this is: (5093.16 + 45.60) - (3160.20 + 194.10) = 1784.46. The total change is recorded at the bottom of the Change column.
The Running total column is the sum of the Carried Forward amount (if present) and net Change in each shift. Subsequent changes are added to the running total from the previous shift, as demonstrated in the following example:
5214.12 + 1932.96 = 7147.08 (Sep 21 Swing shift)
7147.08 + (-148.5) = 6998.58 (Sep 22 Night shift)
0 (no change) + 6998.58 = 6998.58 (Sep 22 Day shift)
Exporting your on and offs report
Reports are exported to a Microsoft Excel spreadsheet (xlsx) file. To prepare your export, follow these steps:
-
Configure your filtering parameters, then click
to run the report. -
Click
 (Export to Excel) at the top-right of the page.
 The report is saved to your browser's download directory as Stockpiles_Changes_Report_<Date><Time>.xlsx.
where:
-
Trips_Report_is the output name. -
Dateis set to the system clock expressed asyear-month-day. -
Timeis set to the system clock expressed ashour-minutes.
-
Running tonnage reconciliation reports
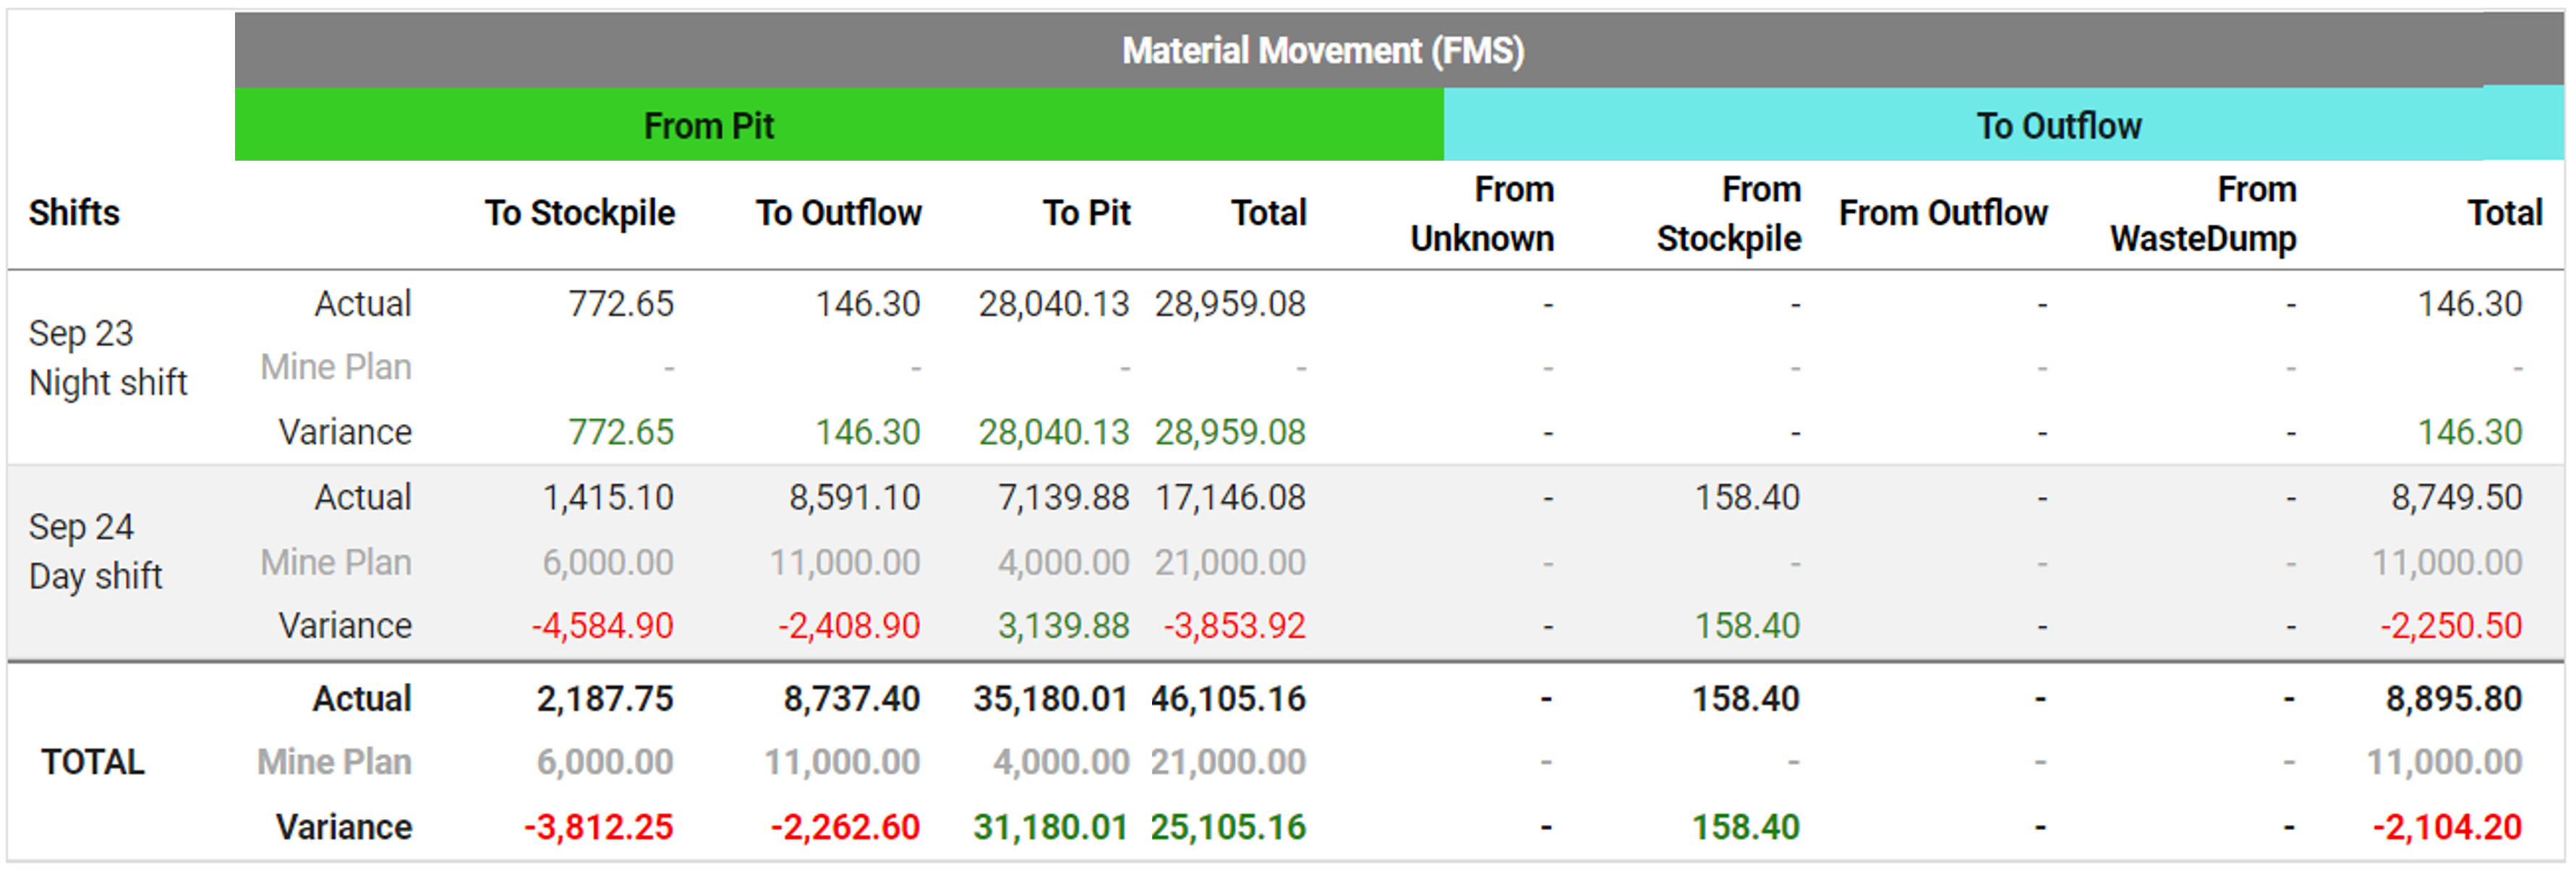
Tonnage reconciliation uses FMS data to tabulate and quantify the following text properties:
- From Pit: In this section of the table, material moved from the pit is tabled for each destination zone category. Each shift has a row for Actual, Mine Plan, and Variance.
- To Outflow: This section of the table is material moved from a zone category that goes to the Outflow. The same rows, Actual, Mine Plan, and Variance are used.
To generate a report, follow these steps:
-
Select the time period using the Time drop-down or the calendar picker.
-
Select a Text Property from its drop-down list.
-
Select at least one component from the Value drop-down list using the checkboxes for individual selection, or use Select All to include all items.
-
Click
to create the report.
Interpreting tonnage reconciliation data
Each shift contains three rows, as follows: Actual (tonnage), Mine Plan (designed tonnage), and Variance (the difference between Actual and Mine Plan values). For each shift, the following applies:
-
Positive variance (green text) indicates values meeting or exceeding Mine Plan values.
-
Negative variance (red text) indicates a shortfall of the expected mine plan values.
-
Accumulated actual, mine plan, and variance values are located in the bottom row, TOTAL.
-
The combined amount of material for shift From Pit and To Outflow are recorded in each column, Total.
Exporting your tonnage reconciliation report
Reports are exported to a Microsoft Excel spreadsheet (XLSX) file. To prepare your export, follow these steps:
-
Configure your filtering parameters, then click
to run the report. -
Click
(Export to Excel) at the top-right of the page. The report is saved to your browser's download directory as Tonnage_Reconciliation_Report_<Date>T<Time>.xlsx.
where:
-
Trips_Report_is the output name. -
Dateis set to the system clock and expressed asyear-month-daysequence. -
Timeis set to the system clock and expressed ashours-minutessequence.
-
Running stockpile inventory reports
-
Open the Stockpiles drop-down then select those stockpiles to include. A row is generated for each stockpile included.
-
Open the Properties drop-down then select those properties to include. A column is generated for each property included.
-
Click
to run the report. An inventory table will be created, similar to the following illustration.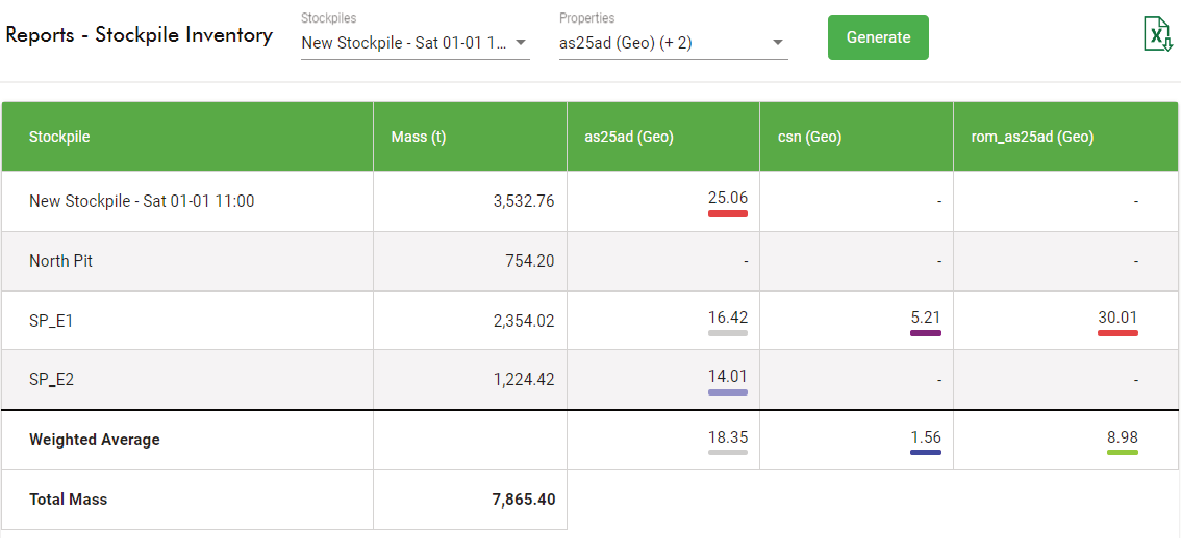
Tip: Hover over a property in any cell to view a histogram tooltip.
Interpreting stockpile inventory data
Stockpiles are listed in the first column, followed by the combined tonnage (mass) and movements in the second and third columns respectively. The columns thereafter list the properties that were selected to be included in the inventory. The coloured dots in each cell indicate the schema colour of that material.
There are two aggregate value rows at the bottom of the table that are:
- Weighted Average: Weighted Mass= (w1 * x1) + (w2 * x2) + ... + (wn * xn) / w1 + w2 + ... + wn
Where:
w1, w2, ..., wn are the stockpile mass assigned to each data point. x1, x2, ..., xn are the values of the property. -
- Total Mass: The total mass is the sum of all the stockpile mass in the Mass column.
Exporting your stockpile inventory report
Reports are exported to a spreadsheet (xlsx) file. To prepare your export, follow these steps:
-
Configure your filtering parameters, then click
to run the report. -
Click
(Export to Excel) at the top-right of the page. The report is saved to your browser's download directory as Stockpile_Inventory_Report_<Date>T<Time>.xlsx.
where:
-
Trips_Report_is the output name. -
Dateis set to the system clock using theyear-month-daysequence. -
Timeis set to the system clock using thehours-minutessequence.
-
Running trips reports
All trips in a given time period associated with your primary and optional secondary text properties; numeric properties will be listed in its own column. Components of the selected text property are displayed in the first column, and its mass is listed in the adjacent Mass column. The table shows which components were present, and their underlying numeric properties. What you choose to display depends on the filtering options used, as follows:
- Use the Time drop-down or the calendar picker to select the period to query.
- Use the Primary Text Property: drop-down to select a text property, or type a keyword in the Search Properties field to find a specific text property.
- Use the Numeric Properties drop-down to select the required text properties
When the required parameters are inputted, click to run the report.
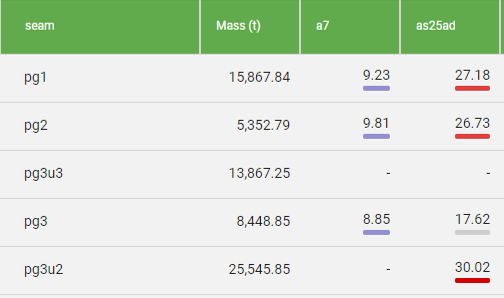
The image below demonstrates a report based on the text property seam. In this section of the report, the list of components in seam is shown, along with any numeric properties. The colour underlines correspond to the weighted-average legend set in the Material Properties Schema. In this instance, all the visible values for a7 fall between 5 and 10, which is indigo. For the property as25ad, the value range for grey is 15 to 20 and 25 to 30+ is red.
Expanding your filtering options
You can refine the report by clicking on  to reveal the following:
-
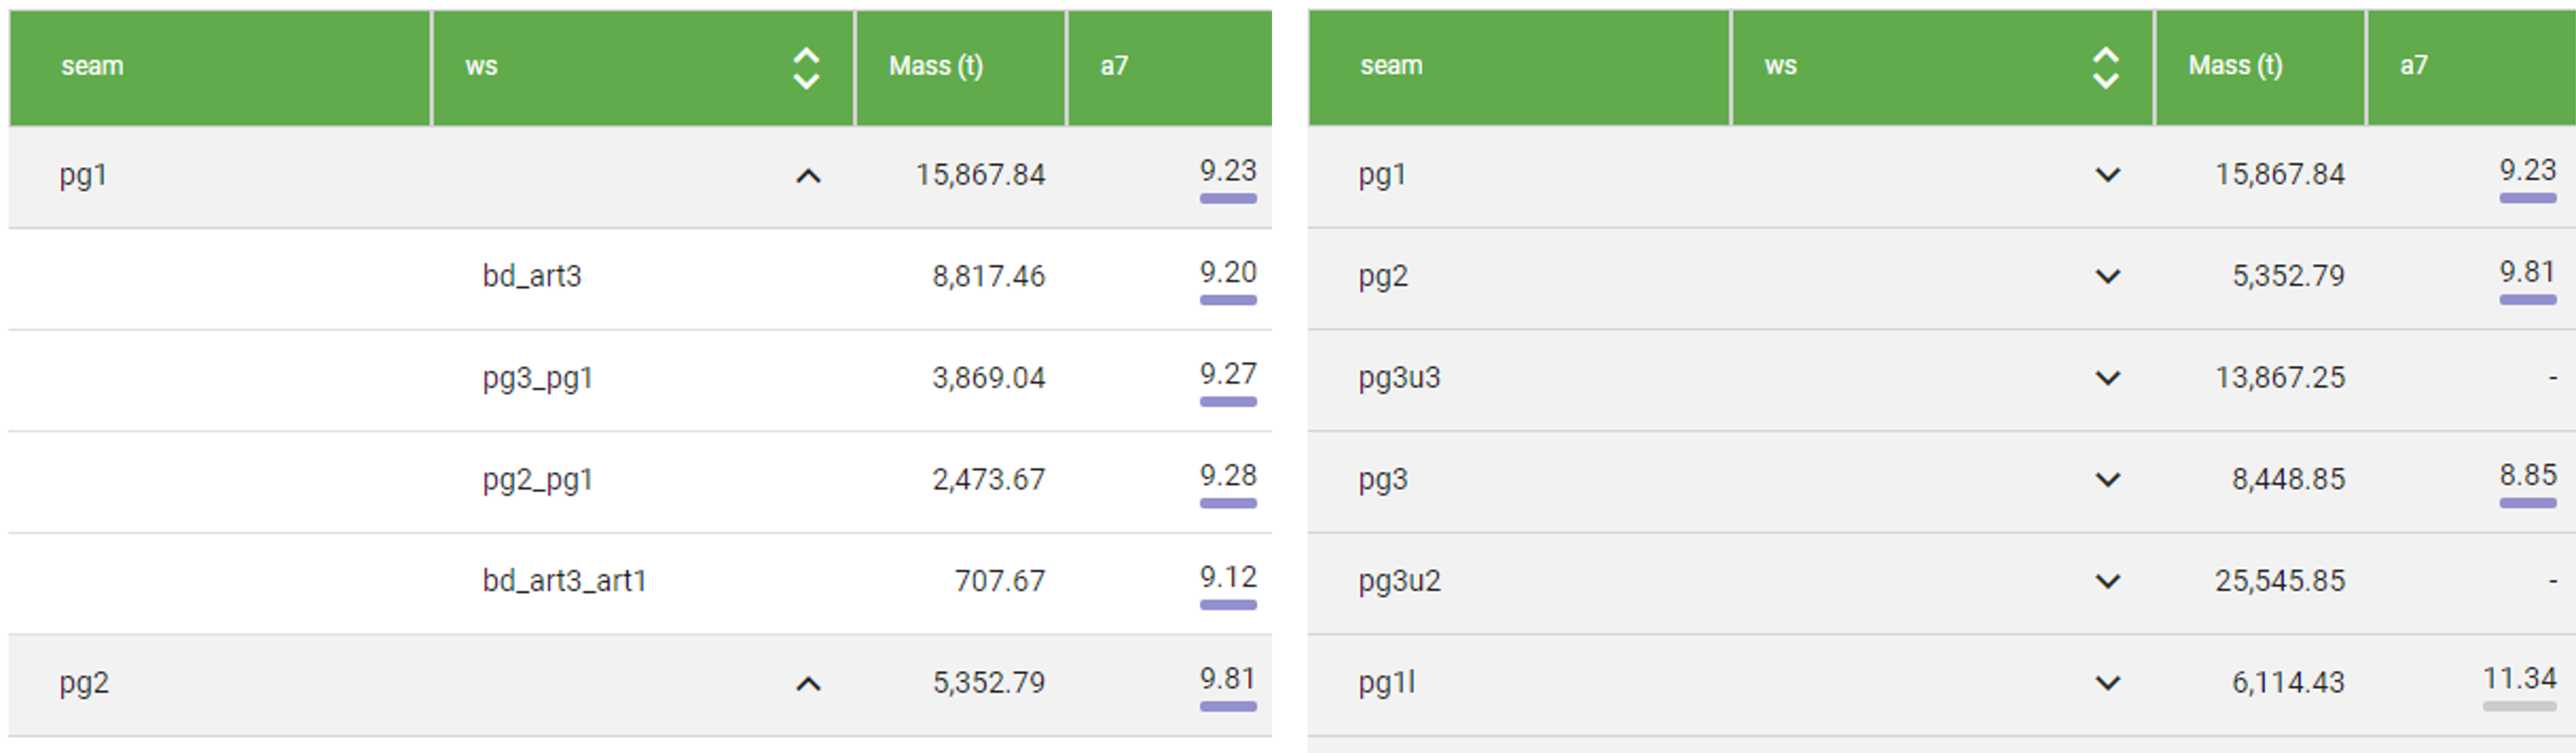
Secondary Text Property: Select a second property from this drop-down. A second column next to the primary text property is inserted. Any secondary properties within the primary property component are listed in an expandable list.
ExampleA secondary text property, (ws) has been assigned and added next to the primary text property, (seam). Note that the secondary property column is expandable. Use
 in the header to expand and collapse the secondary properties column. Optionally, you can expand or collapse individual rows using the
  and
and  button, respectively.
In the instance below, the primary text property, seam, contains components, pg1, pg2, pg3u3, and so on. Each primary component may contain components of the secondary text property. In this case, pg1 has bd_art3, pge_pg_1, pg2_pag1, and bd_art3_art1 that were present in the trips containing pg_1. Likewise, for every secondary text property component, there may be a numeric property associated with it.
- Destination zones: Select which destination zones should be included in your trips report and filter out the rest. To make a selection, expand the drop-down and do any of the following:
- Search zones: Type a keyword to locate matching names.
- Select All: Use the checkbox to select all numerical properties. Disabling the checkbox clears all currently selected items.
- Select individually: Use the checkboxes to select specific properties.
After updating your destination zone, click
to refresh your report. -
Source zones: Select which source zones should be included and filter out the rest. To make a selection, expand the drop-down and do any of the following:
- Search zones: Type a keyword to locate matching names.
- Select All: Use the checkbox to select all numerical properties. Clearing the checkbox clears all currently selected items.
- Select individually: Use the checkboxes to select specific properties.
After updating your destination zone, click
to refresh your report. -
Ignore re-handled trips: Select this checkbox to prevent material being double counted. Simply put, material that hasn’t been moved before is counted and included in your report. However, if subsequent (rehandled) trips occur, they are excluded in this report.
Tip: You can change the position of any primary text property component listed in the Reports - Trips page. Simply select and drag any row to the desired position in the list.
Exporting your trips report
Reports are exported to a Microsoft Excel spreadsheet (xlsx) file. To prepare your export, follow these steps:
-
Configure your filtering parameters, then click
to run the report. -
Click
(Export to Excel) at the top-right of the page. The report is saved to your browser's download directory as Trips_Report_<Date>T<Time>.xlsx.
where:
-
Trips_Report_is the output name. -
Dateis set to the system clock using the<yyyy-mm-dd>sequence. -
Timeis set to the system clock using the<hh-MM>sequence.
-
