Colour by Grade
Source file: colour-by-grade.htm
With Colour by Grade you can colour a selected line by its inclination and optionally generate a colour legend and a histogram for the selected data.

-
On the Home ribbon tab, go to the Colour group. From the Colour Scheme drop-down list select
 Colour by Grade.
 -
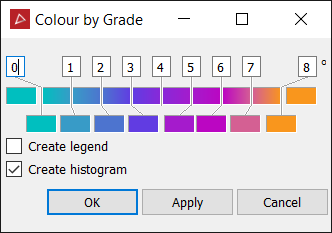
Select the line to be coloured. The available options are displayed by clicking on the colour.
-
Adjust the colour scale as required. See Modify a colour scale for detailed instructions.
-
Select Create legend to make a legend indicating the colour scale. Double-click on the legend in the project explorer to view it.
-
Select Create histogram to make a graph displaying the distribution of data in front of and behind the surface. The chart will be placed in a secondary container called colour by distance from objects legend. Double-click on the container to view the chart.
-
Click OK or Apply.
