Fragmentation Analysis and Report
Source file: fragmentation-analysis-and-report.htm
Use these tools to analyse and report on blast fragmentation using automated rock size detection and analysis from muck pile scans.
Fragmentation Analysis
The fragmentation analysis tool takes a point set of a pile of rocks, breaks it down into individual rocks and fines.
-
Select the stock pile to be analysed.
-
On the Query ribbon tab, go to the Fragmentation Analysis group and select
 Fragmentation Analysis.
 -
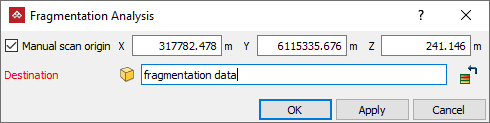
If necessary, select Manual scan origin and pick a point in front of the data set.
Note: Clear this option if only analysing a single scan. The tool will use the scan's origin point.
Important: This option is required if there are multiple scans, or a non-scan point cloud to be analysed. Ensure that the selected origin point gives the best possible view into all voids between rocks.
-
The default output destination is the legends container. To use a different output container, drag it into the Destination field.
-
Click OK.
-
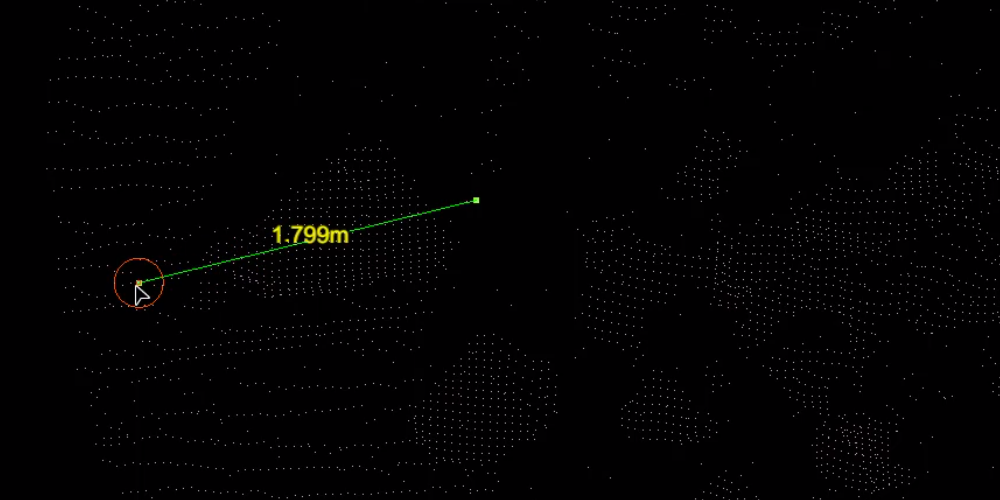
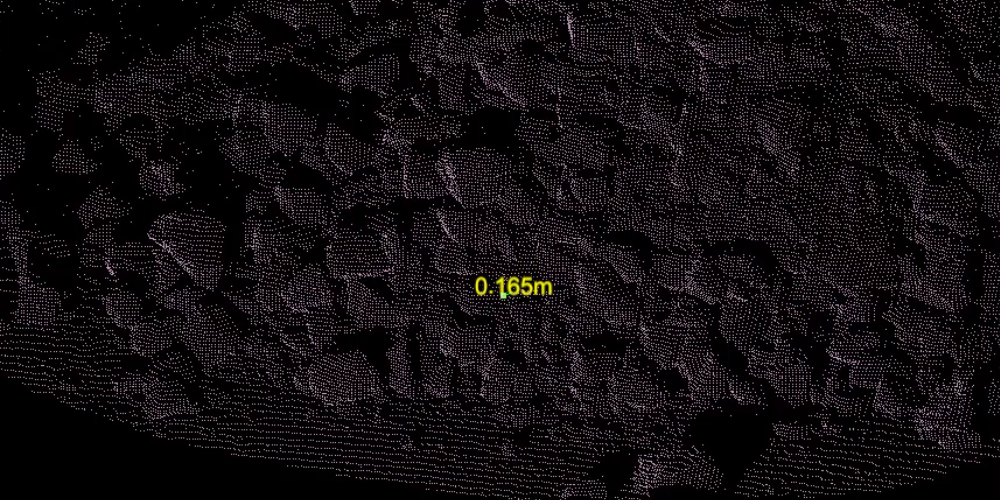
Create a legend to suit the fragmentation analysis results. See Numeric Legend Editor. To determine the size range limits, measure a large and small sample rock in a view window, as below.
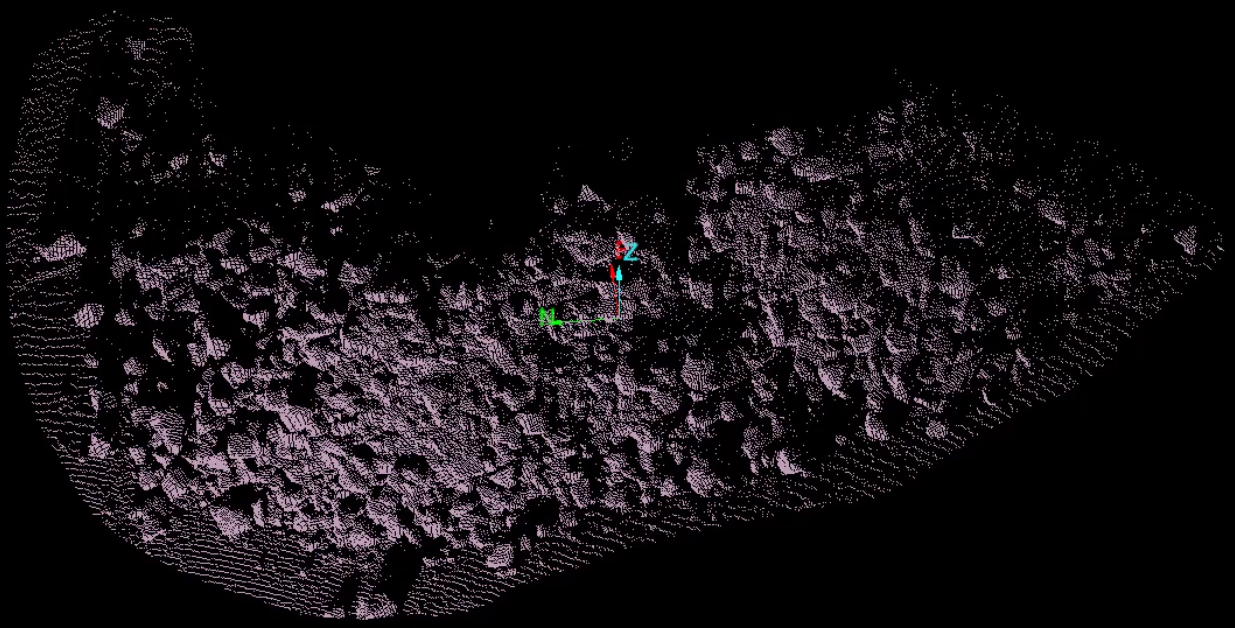
PointModeller analyses the fragmentations and stores the results in the destination container.
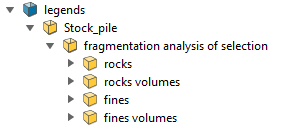
Note: Each time the tool performs an analysis it will create a new result set in the destination container.
Tip: You can randomly colour rocks according to size with Ctrl+2 for a better visual representation.
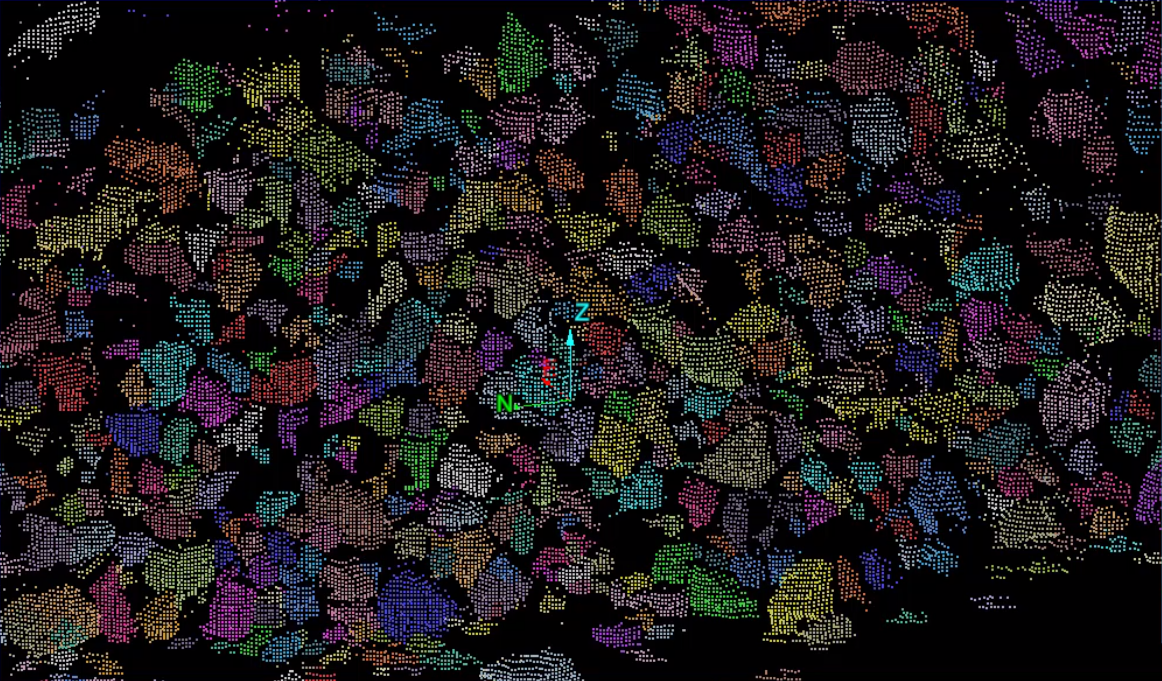
|
Find a large sample rock and measure its width to be used as an upper limit in creating a legend. |
Find a small sample rock and measure its width to be used to be used as a lower limit in creating a legend. |
Fragmentation Analysis Report
Following a fragmentation analysis, you can generate a fragmentation report, including images and graphs, that can then be exported to PDF or a CSV format.
-
On the Query ribbon tab, go to the Fragmentation Analysis group and select
 Fragmentation Analysis Report.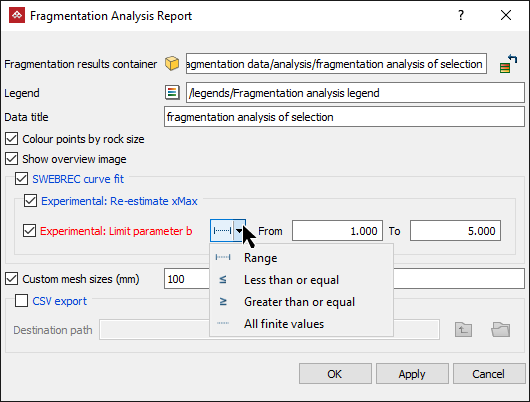
-
Drag the fragmentation analysis of selection container into the Fragmentation results container field.
-
For the Legend field, you can do either of the following:
-
Select the legend created above in the project explorer and it will be added to the Legend field.
-
Leave the field empty, in which case the report tool will generate a legend based on the range of data, using the spectrum colour scheme.
-
-
Select or clear the following options according to requirements:
-
If selected, Colour points by rock size will colour the rocks according to the legend scaling.
-
If selected, Show overview image will display a coloured representation of the selected area in the report.
-
-
Select SWEBREC curve fit to display the fragmentation size distribution in a graph. Leave the experimental options cleared.
TipIf you find that the SWEBREC curve is a poor fit to the data curve after generating the report, try again using the experimental options, as below.
-
Select Experimental: Re-estimate xMax to enable Experimental: Limit parameter b.
-
Select Experimental: Limit parameter b and, from the drop-down list, select how to Limit parameter b.
-
Enter tighter constraints for parameter b.
-
-
To report the percentage of rocks found that are smaller than a certain size, select Custom mesh sizes (mm) and enter a value.
-
Select CSV export option if a csv is required and assign the Destination path for the file.
-
Click OK or Apply.
A report on the fragmentation analysis will be generated and displayed in a PDF view window.
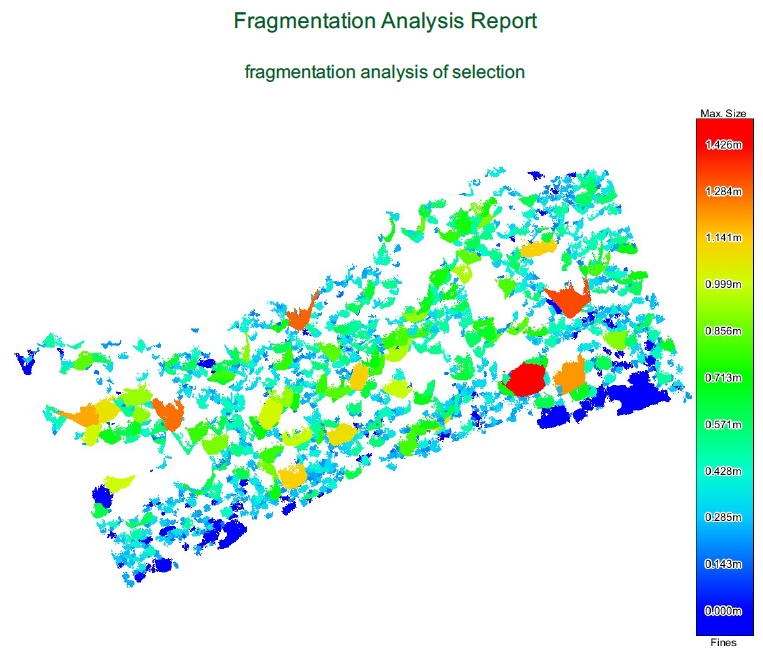
A Fragmentation Analysis report (first page) graphically displaying the rock sizes and coloured according to the legend.
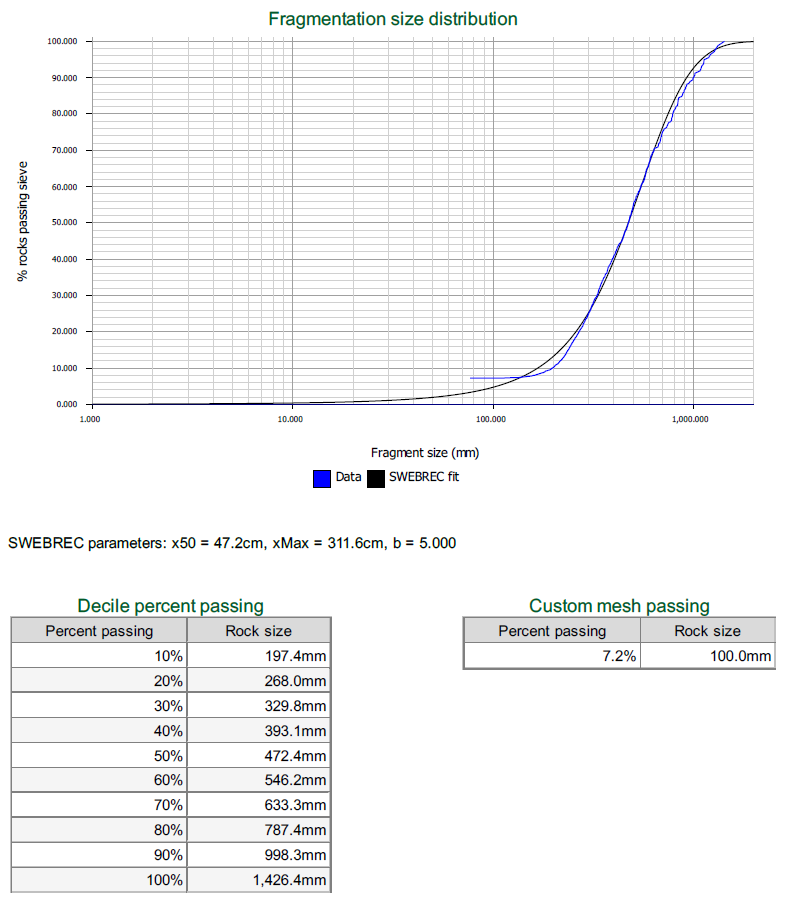
A Fragmentation Analysis report (second page) that displays the details below, depending on options selected.
- Fragmentation size distribution as a SWEBREC fit graph and the parameters used for it.
- A Decile percent passing table showing the percentage of rock sizes found.
- A Custom mesh passing table showing the percentage of rocks that will pass through a custom mesh size.
The report can be downloaded by clicking  and or printed by clicking
  .
.
