Applying a Colour to Indicate the Distance from Objects
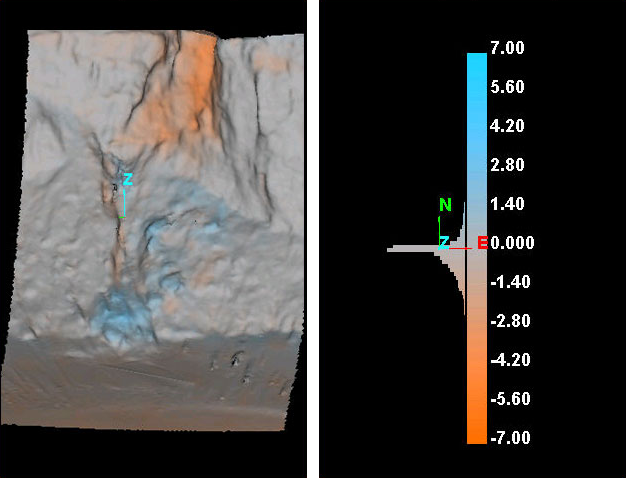
Colour distance from objects compares objects against a base or reference object and colours by the distance between the objects according to colour versus distance relationships specified in the colour scheme editor.
This tool
is useful for comparing triangulations of as-built surfaces against design
models to highlight non-conformance. It can also be used to visualise areas
of change between scans of the same area, for example a slow moving failure
in an open pit mine.
-
On the Home ribbon tab navigate to the Colour group. From the Photographic drop-down list select
 Distance from objects.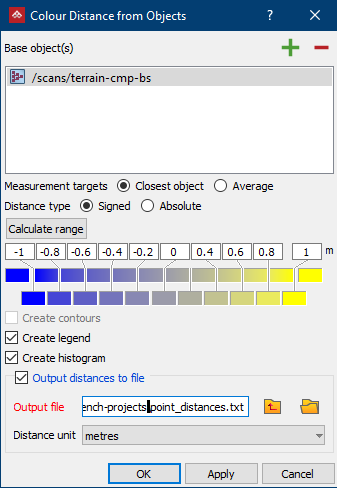
-
Populate the Base object(s) field with the object(s) to measure distance from.
-
Select Closest object to colour object points based on the closest base object to that point. Select Average to colour object points based on the average distance to every other base object.
-
Select Signed distance to separate colouring depending on whether the selected data is above or below a base surface (or Absolute distance otherwise).
-
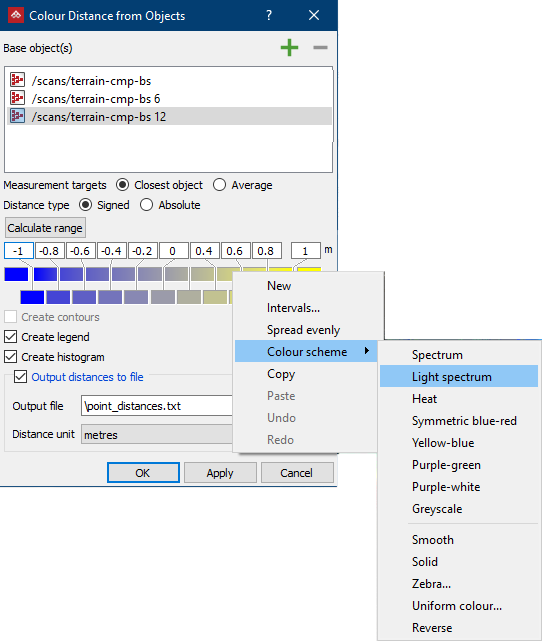
The colour scale of the colour scheme editor can be adjusted manually by sliding the vertical edges of the coloured cells representing the colour bands. Colours can be selected from a colour palette for individual cells, or preset colour schemes can be applied to colour the entire range. Calculate range determines the distance settings for the colour scheme based on minimum and maximum separation between the base object(s) and the selected object. Right-clicking on the top line of coloured cells displays further options for editing colour bands and the automated arrangement of colours:
- New: Splits a colour band in two - effectively adding a new colour band to the range of colours in the colour scheme editor.
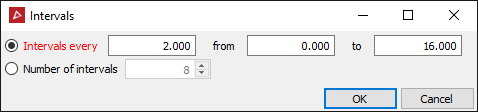
- Intervals: Provides further numerical control over the spacing of colours.
- Spread evenly: Distributes the total colours evenly over the distance range.
- Colour scheme: Select from preset arrangements of colours.
- Undo/Redo: Undo and Redo operations
to the colour scheme editor.
-
Selecting Create legend will create a secondary container called Colour by distance from objectslegend. This contains a graph displaying the distribution of data in front of and behind the surface. The legend can be viewed by right-clicking on the container and selecting View selection, or clicking Ctrl+N.
-
Selecting Create contours will create contours of the selection based on the distance from the base objects at intervals equal to the colour band interval.
The contours are saved in the contours container.
-
Select Output distances to file and enter the Output file name and path. This saves a csv file listing the points of the selected surface and the distances from the base objects.