Numeric Legend Editor
The numeric
legend editor provides a tool for setting up colour
schemes with associated numeric ranges, including dimensions. These
numeric legends can be applied to various data and objects for displaying
physical trends using colour schemes.
There are several options allowing you to fine tune colour
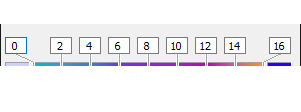
schemes. Setting up legends is very flexible. Numerals can be entered
into the text boxes, the lines can be slid along to different positions,
lines can be added and deleted, intervals can be spread evenly and colours
can be automatically generated.
-
On the Home ribbon tab navigate to the Colour group and select
 Numeric Legend.
 -
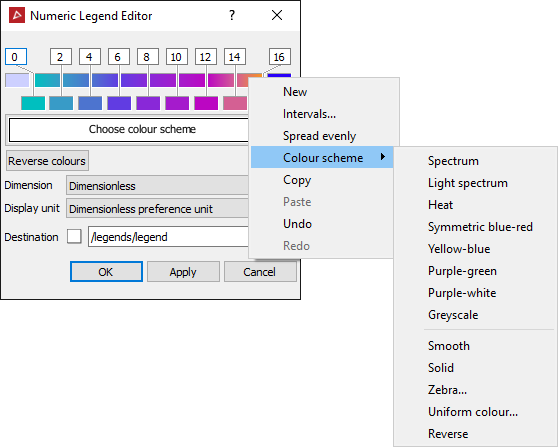
Define numerals and interval spacing.
-
Choose individual colours or pre-defined colour schemes.
-
Choose units for dimensions.
-
Save the new numeric legend (colour scheme).
-
Apply the new numeric legend as you would a standard colour scheme. (Refer to colour scheme instructions)
See also custom colour information regarding further advice on applying legends.
To display the numeric legend editor, right-click the main trend line for the context menu.
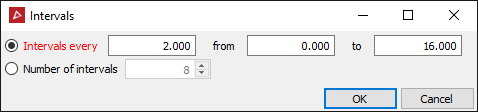
Below is the numeric legend editor panel for the Intervals... setting.
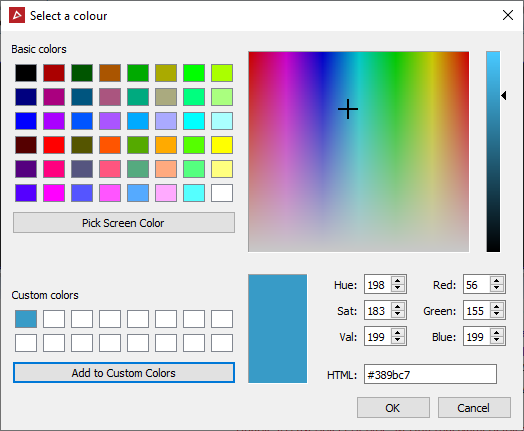
Double-click a colour square in the Numeric Legend Editor panel for the Basic colour selector.
-
Either start with choosing a basic colour or navigate the black cross icon over the different shades or enter a custom RGB or a hexadecimal colour value.
-
Optionally you can save the colour by clicking Add to Custom Colours button.
-
Click OK.