To Apply a Threshold Colour
Threshold
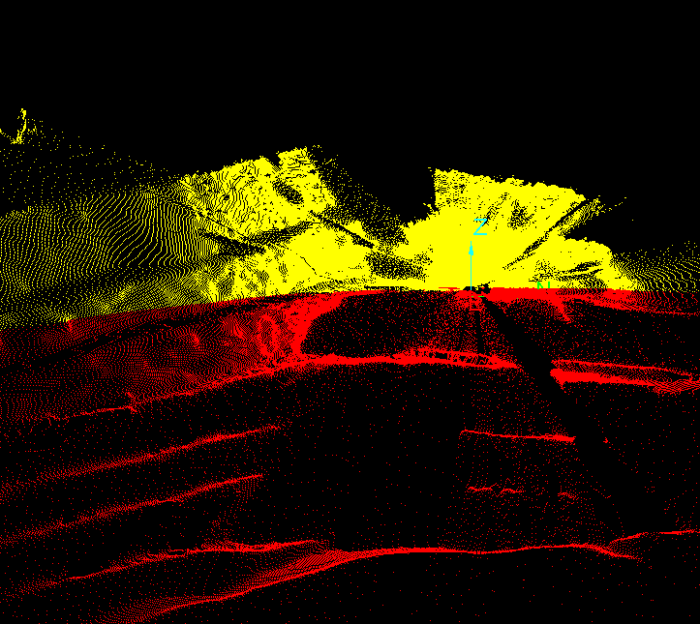
colour highlights data above or below a specified intensity, range
or height. It can be used to highlight a specific change that is of interest.
For example, data above or below a specific elevation can be coloured.
-
Select the object or data to be coloured.
-
On the Home ribbon tab navigate to the Colour group and select
 Threshold.
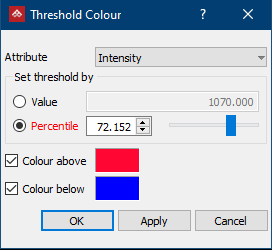
-
Select the property to Colour by (Intensity, Range or Height).
-
Enter a Value; absolute or Percentile. If a single scan is selected, the Value field is automatically completed with a value denoting the 50th Percentile.
- The Value option displays data above the entered range in one colour and below in another. The Value automatically displayed is equal to the Percentile.
- When Percentile is selected, the percentage of data points above and below the selected percentage is displayed. For example, the image below has Range selected with a Percentile of 50. It shows that 50% of the scan points (in green) are very close to the scan origin point.
-
Choose to Colour above or Colour below (or both) and click in the colour fields to select the colours to use.
Note: Only
the visible points are coloured. If the scan has been filtered, the invisible
points will remain unchanged. Select Filter > Show
All ![]() to re display filtered points.
to re display filtered points.