Create a Rose Diagram
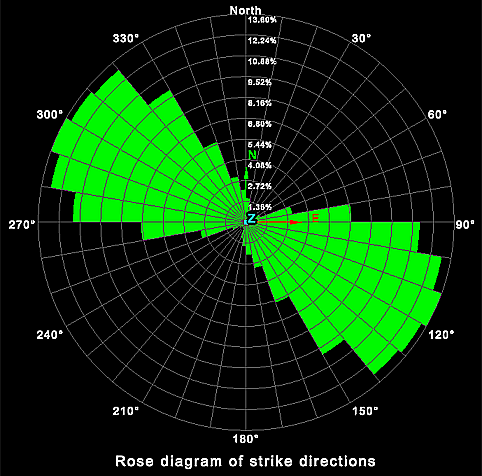
The rose diagram plots the frequency of data versus the direction of the data. It can be used to identify directional trends in the data.
Data preparation
Before creating a rose diagram, suitable data must be prepared.
-
Select a surface created using spherical surface, scan surface or a fusion surface. Topographic surfaces are not suitable for geotechnical analysis as they are created in a top-down manner that does not provide sufficient detail on rock slopes.
-
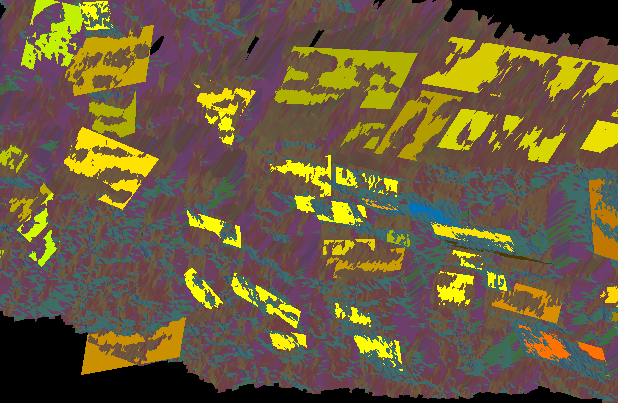
On the Geotechnical ribbon tab navigate to the Colour group and select
 Colour Dip and Strike to highlight the areas to be analysed.
 -
Select point selection mode
 .
. -
Select some points on a structure of interest.
-
On the Home ribbon tab navigate to the Selection group and select
 Smart Select to expand the selection across the
structure.
 -
On the Geotechnical ribbon tab navigate to the Dip and Strike group and select
 Query.
 -
Repeat this process for all structures of interest. Discontinuity objects are saved in the geotechnical container for each query.
-
Add the resulting discontinuity objects to the view window.

Diagram creation
-
Highlight all the created discontinuities in the project explorer.
-
On the Geotechnical ribbon tab navigate to the Analyse group and select
 Rose Diagram.
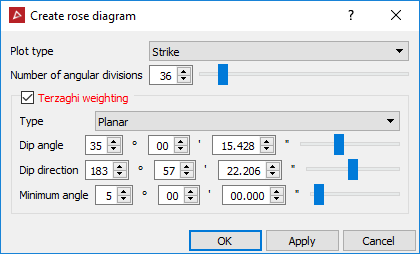
- Select
the Plot type from the drop-down
list (refer to Glossary
for explanations of the plot types) :
- Strike direction: Plots the strike direction of the planes.
- Dip direction: Plots the dip direction of the planes.
- Trend direction: Plots the trend direction of the planes.
-
Specify the Number ofangular divisions required in the diagram (range 2-360).
-
SelectTerzaghi weighting if desired.
Terzaghi weighting uses the measurement orientation to counteract the sampling bias, the options are:
- The Planar type weighting gives higher weights to discontinuities less likely to intersect the specified plane.
- The Linear type weighting gives higher weights to discontinuities less likely to intersect the specified line.
-
Enter the angle of the Dip angle and Dip direction or use the slider.
-
The Minimum angle is the lowest angle between the measurement orientation and the discontinuity that will be used for weighting.
The rose diagram is saved in the geotechnical container.

The direction of the data is displayed around the outside of the diagram and the frequency of the data is displayed in the centre.