Inter-Ramp Compliance Reporting
The
Inter-Ramp Compliance reporting tool is a
The key benefit is in allowing you to quickly and efficiently identify areas of concern in wall angles and catch bench widths (CBW) for stability, rock fall and design optimisation.
The unique, powerful reporting tool visually and statistically highlights wall angles and bench widths of mining areas.
The tool is easy to use. String data is used to define toe, crest as well as material boundaries, with results making it clear whether wall angles and bench widths are within the specified tolerances.
How the tool works:
- Only uses the defined CAD string data (toe, crest, back-break, muck or rill)
- The pit surface is only used as a visualisation in the cross sections. It is not used in any way for calculations
- Your defined strips are used to calculate statistics on wall angle & catch bench width (CBW). The centre of each strip is used and where the string data intersects along that centre line, this is the data that is used to calculate the relevant statistics for the overall summary. Visualisation of sections can also be defined, for example; every 5th strip generates a cross section.
Procedure
On the Query ribbon tab navigate to the Reporting group and select ![]() Inter-Ramp Compliance.
Inter-Ramp Compliance.
The main sections of the Inter-Ramp Compliance report tool are:
- Specify report data
- Configure report
- Review report images
- Review report
A. Specify report data
You will need
some additional data created in advance with
Data to be defined ready for analysis:
- The bounding polygon
- Segments line
- As-built surface
- An additional surface
- Crest lines
- Muck top lines
- Toe lines
- Muck bottom lines
- Back break lines
- Contour and Division lines
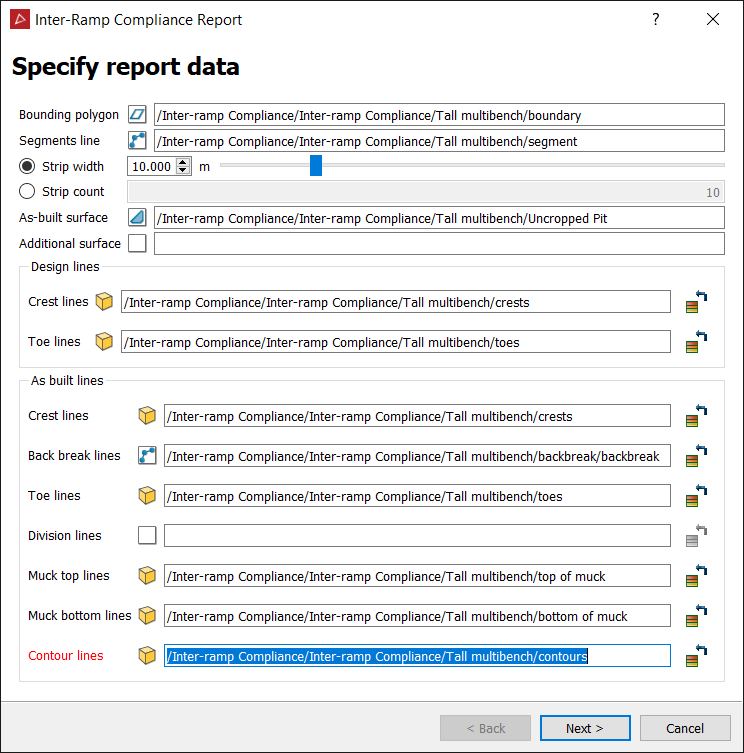
Follow the steps below to specify report data
-
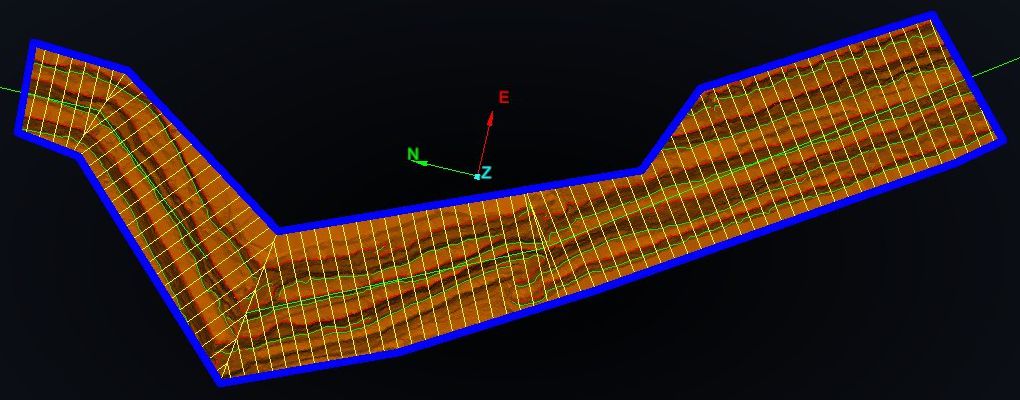
Create a bounding polygon, to mark the overall boundary of the region you want to report on.
-
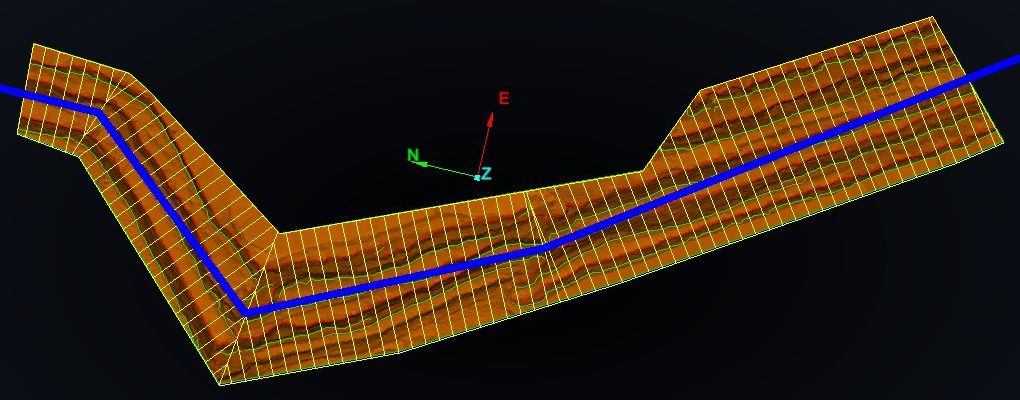
Create a segment line, to tell the IRC report where to generate the report segments.
-
Enter a strip width.
-
Enter strip count.
-
Drag in the as-built surface which is used for visualising the calculation results.
-
Drag in any additional surface, if specified it will appear in the final report cross section(s).
-
Drag in the created crest lines from the pit bench.
-
Drag in the created backbreak lines. (optional).
-
Drag in the toe lines created along the toe of the pit benches.
-
If a bench has a muck pile on it, you can specify muck bottom lines and muck top lines if an actual toe line is not visible. (Optional)
-
Contour lines should be used to more accurately define the bench face angle when the small lip caused by doing a double height bench would cause the crest to toe measurement to be inaccurate. (optional)
-
Division line: When the IRC report sees a division line, it acts as though lines on either side of the division lines are from entirely different strips.That is, the IRC report will not attempt to calculate anything that spans across one of these lines.
-
Click Next to proceed to Configure report section.
B. Configure report
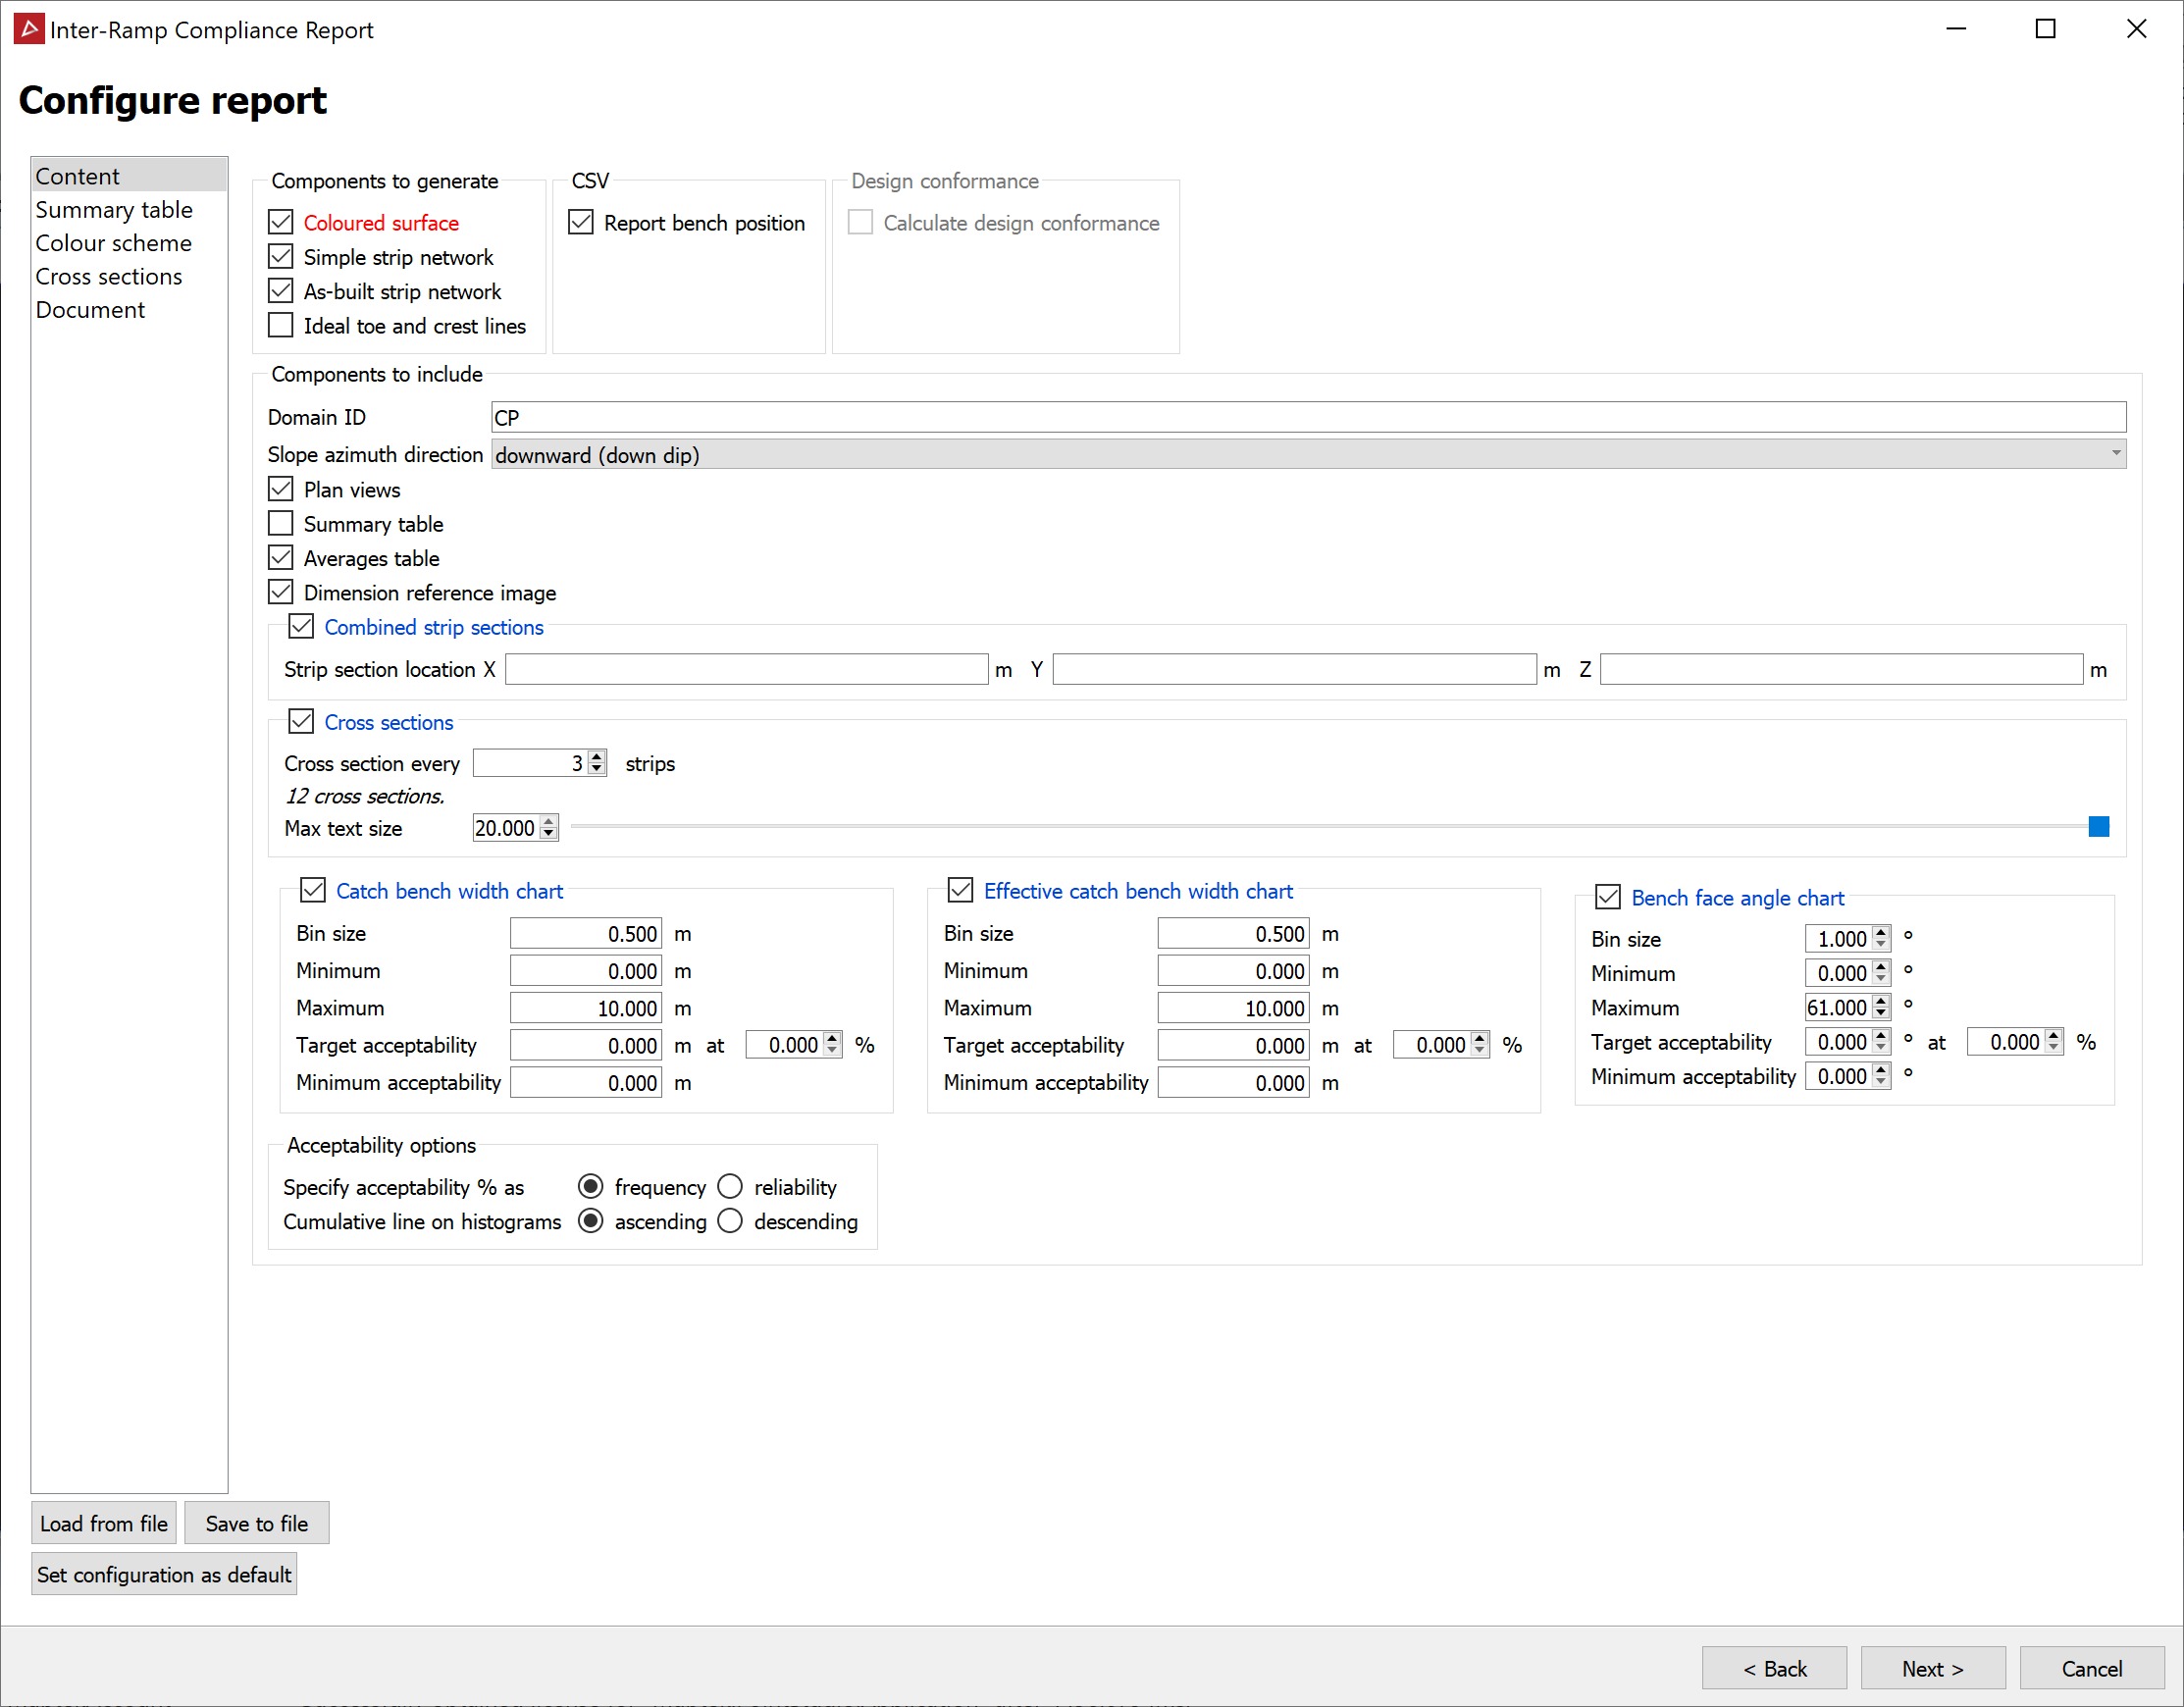
Content of Configure report
Coloured Surface
If the coloured surface is enabled, the IRC report will colour a cropped version of the as-built surface by the colour maps specified on the colour scheme page.
Simple strip network
Enabling simple strip network will create a collection of coloured-by-compliance edge networks will be created in /scrapbook/Inter-ramp compliance results container.
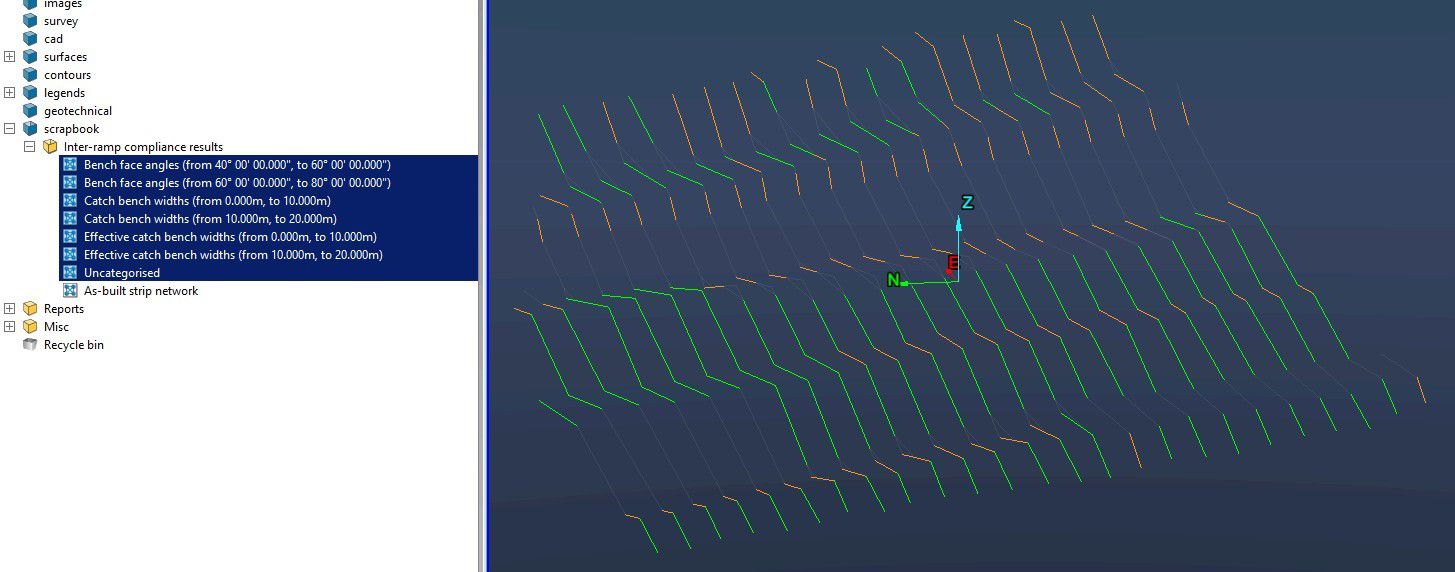
These edge networks are generated from the toe and crest lines that cross the strip mid-planes.
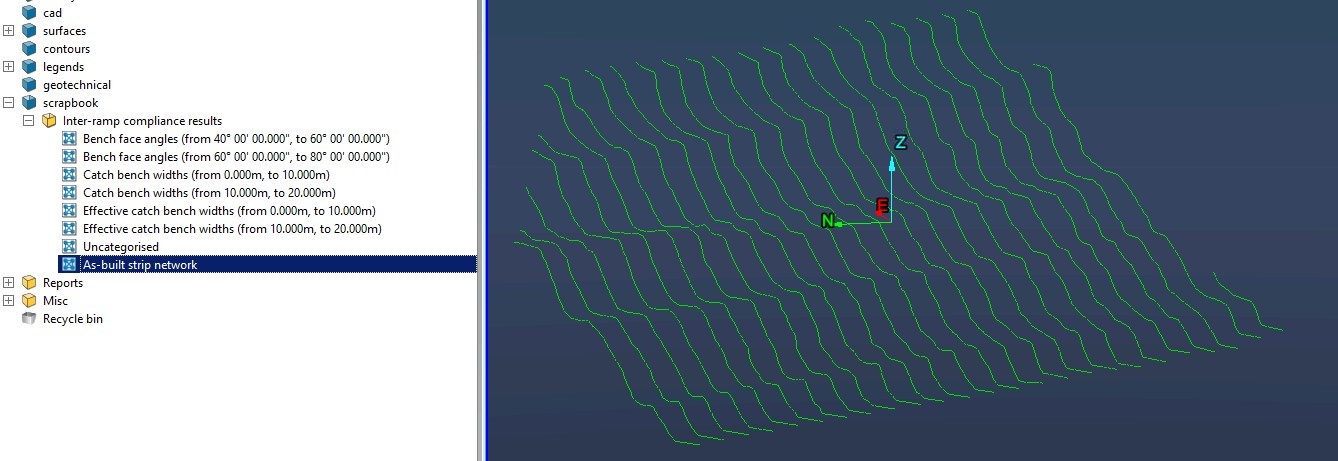
As-built strip network
Enabling the as-built strip network will create an edge network in /scrapbook/Inter-ramp compliance results container from the cross section of the as-built surface and the strip mid-planes.
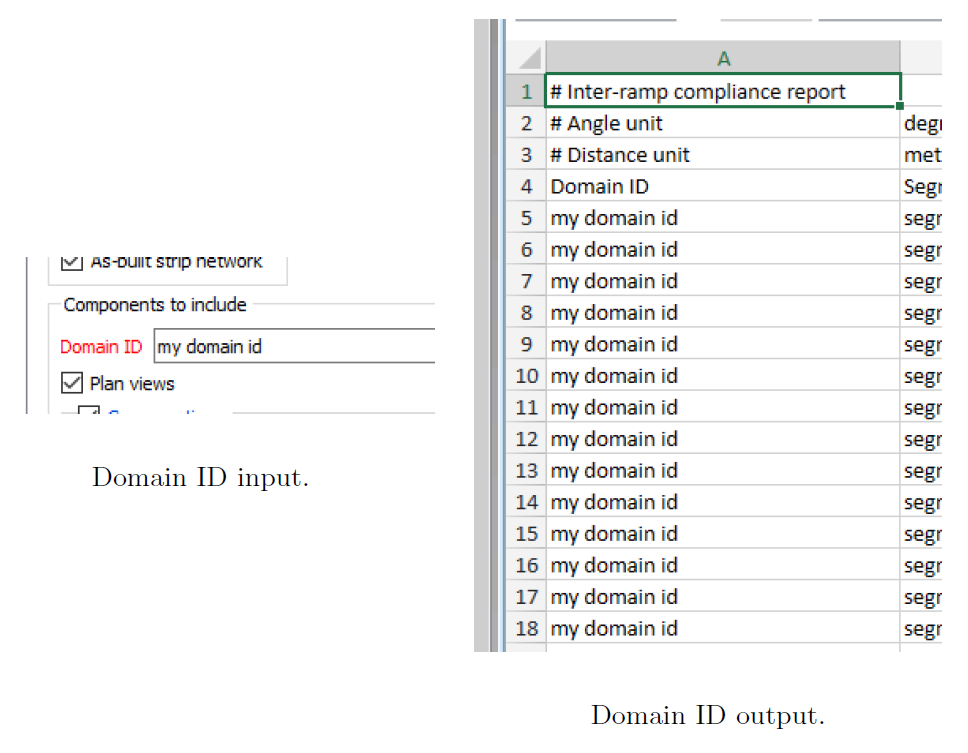
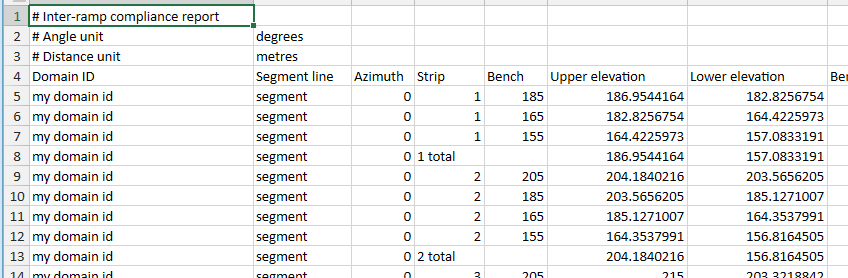
Domain ID
The Domain ID specified will be populated the domain ID column in the report CSV.
Plan views
If the plan views was enabled then plan view images will be generated for the final report document.
Cross sections
If the cross sections was enabled then cross section images will be generated for the final report document.
Cross sections every x strips
Cross sections every x strips is used to control the number of cross section images that should be generated for the final report.
Max text size
Max text size sets the maximum size of the cross section label text. The maximum text size is also limited by the width of the strips.
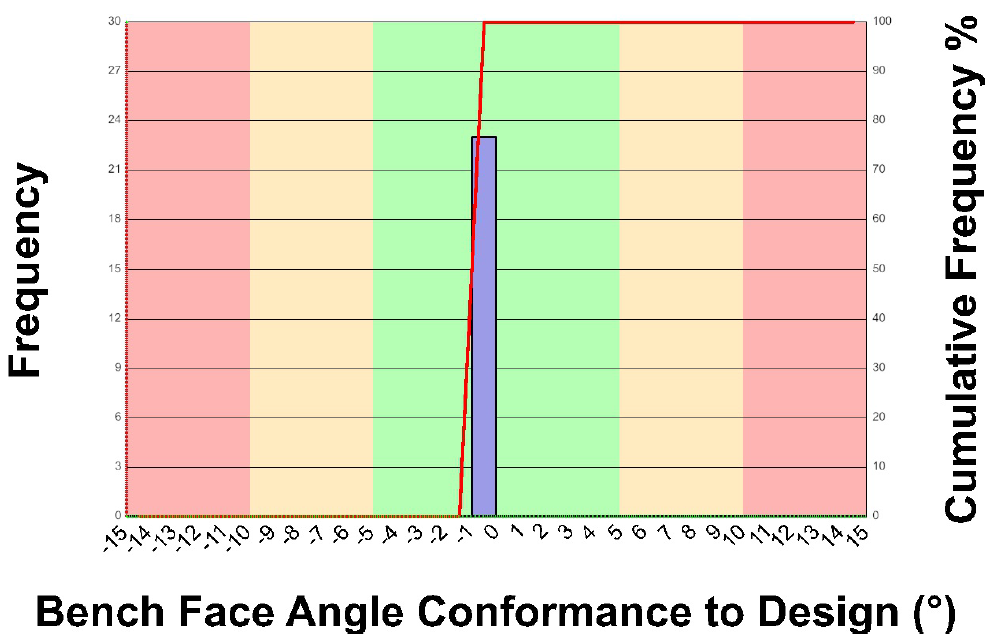
Bench face angle chart
Bench face angle chart turns on/off the bench face angle chart in the final report document.
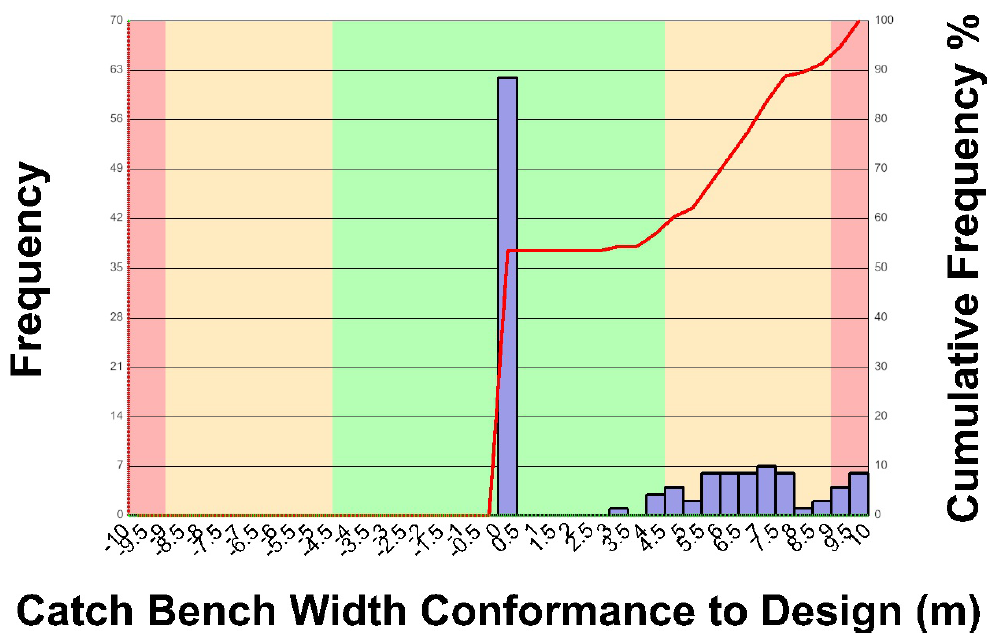
Catch bench width chart
Catch bench width chart turns on/off the catch bench width chart in the final report document.
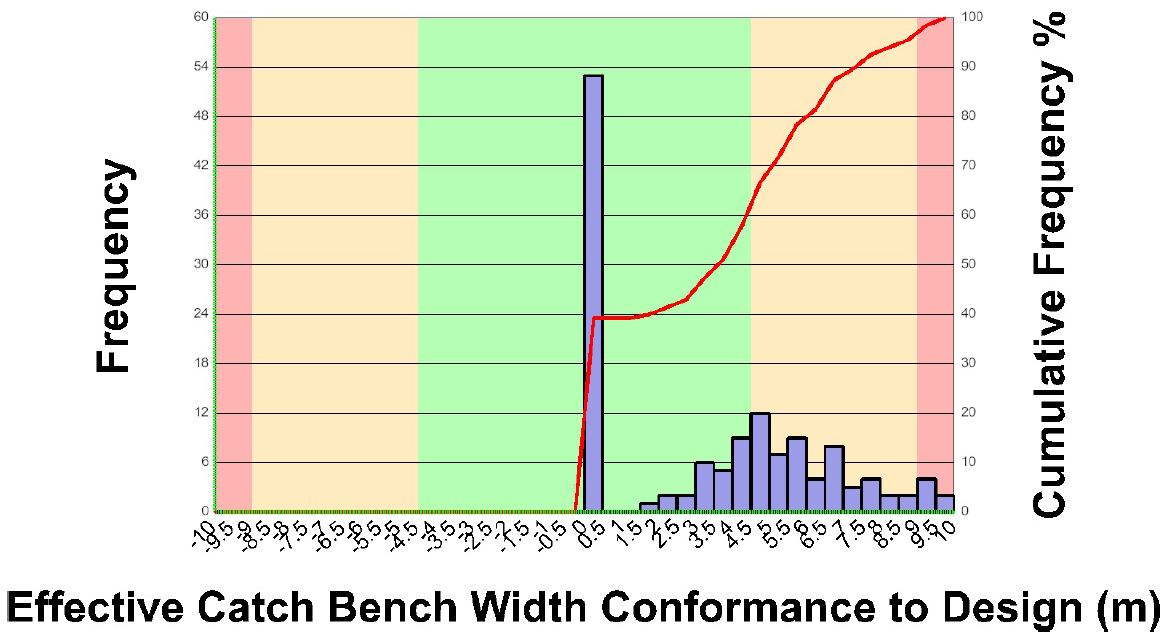
Effective catch bench width chart
Effective catch bench width chart turns on/off the effective catch bench width chart in the final report document.
Summary table
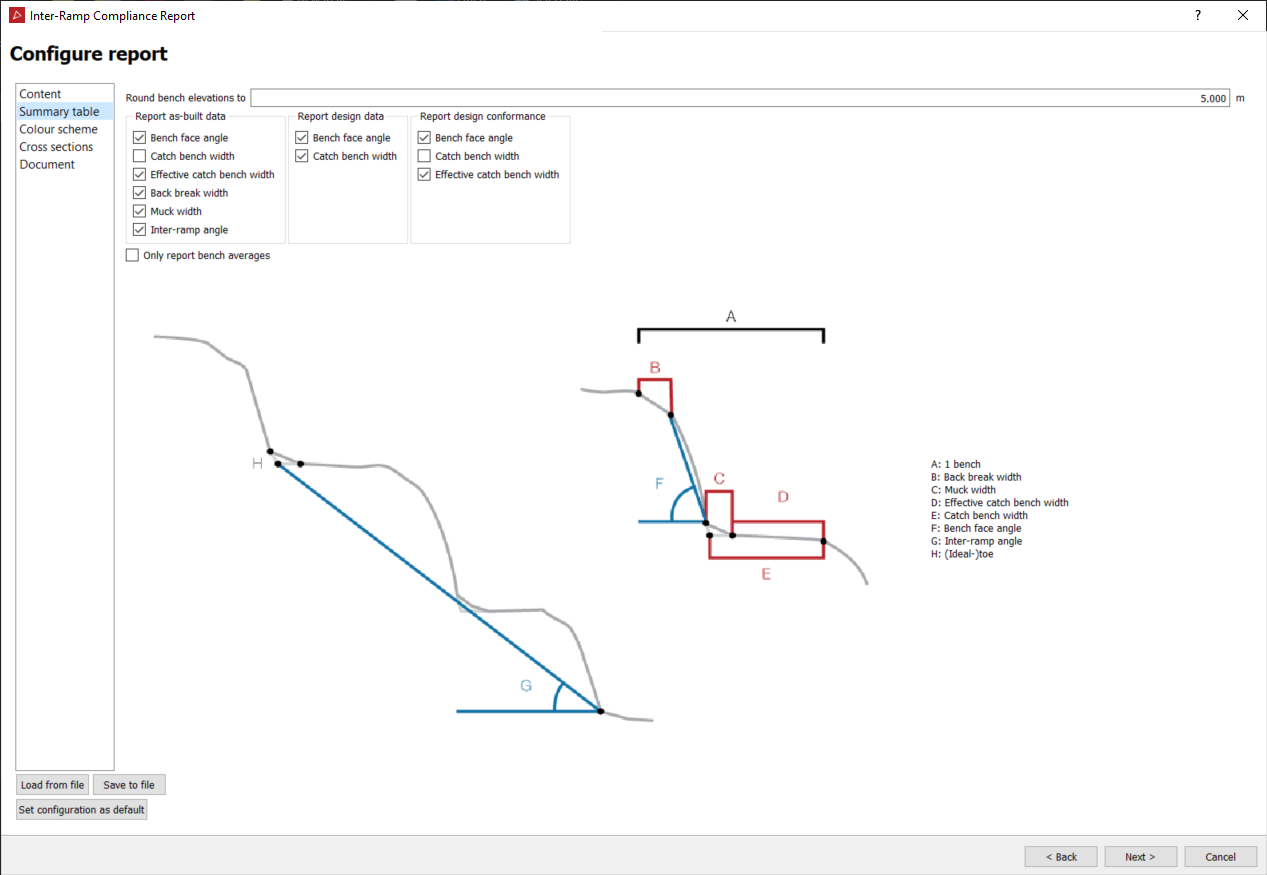
Round bench elevations to
The bench column values of the CSV output are the elevation of the centroid of the bench tops, rounded to the value specified in 'Round bench elevations to'.
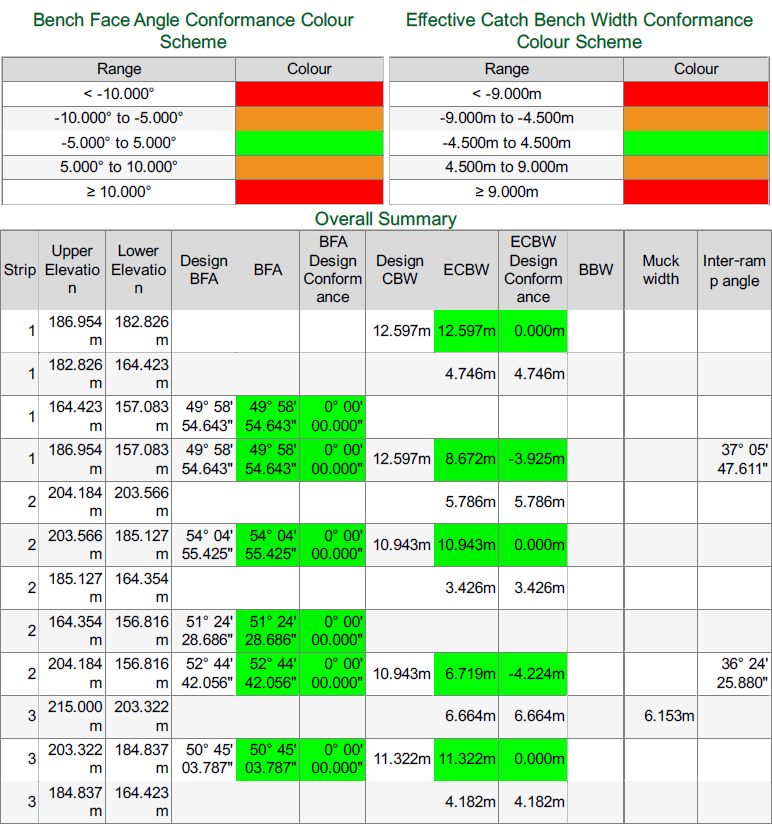
Summary table features
Report bench face angle (Average BFA),report catch bench width(Average CBW), report effective catch bench width (Average ECBW), report back break width (Average BBW), report muck width (Average muck width) and report inter-ramp angle (Inter-ramp angle) are all features toggles for the summary table in the final report document. These settings do not affect the CSV output.
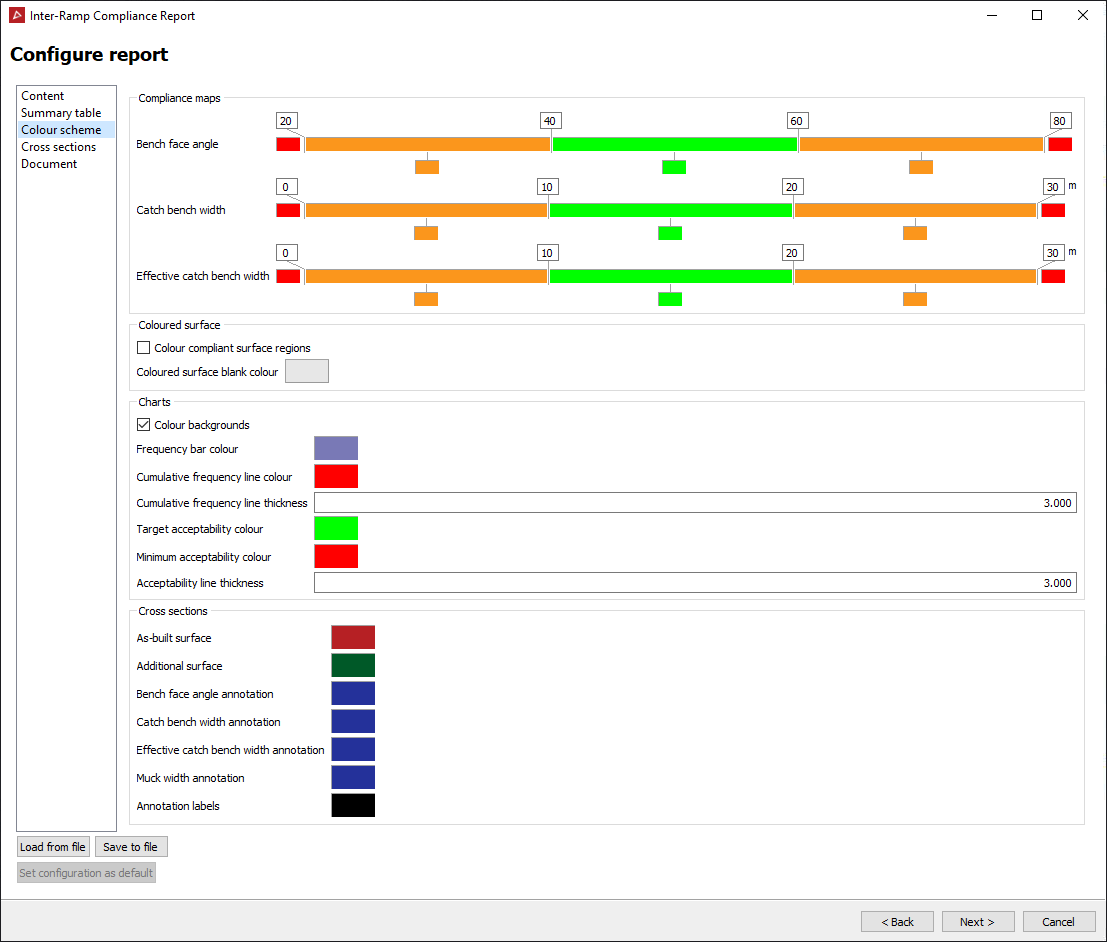
Colour scheme
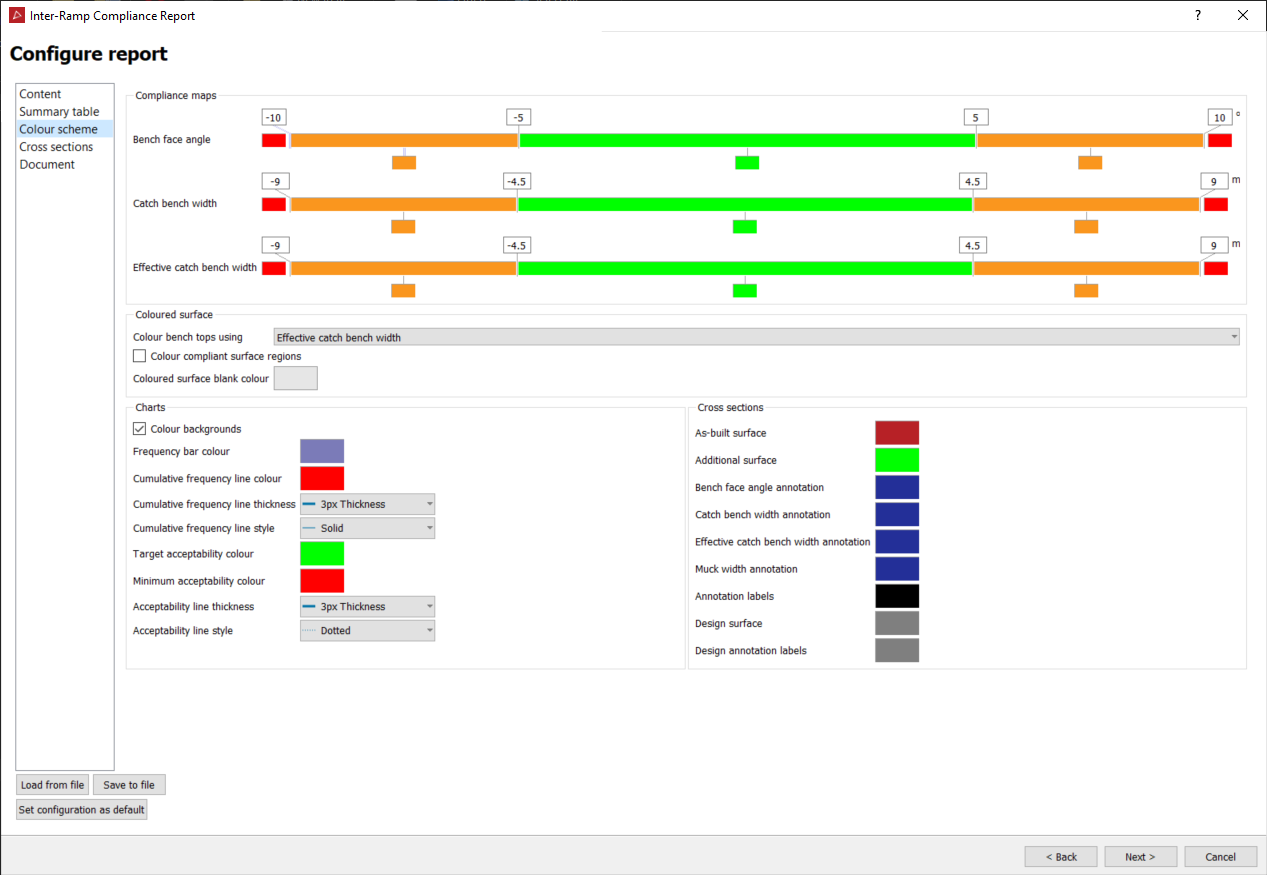
Compliance maps
Whenever the IRC report needs to colour something by compliance, it uses the bench face angle,catch bench width and effective catch bench width colour maps here to get the colours.
Coloured surface
When generating the colouredsurface,if colour compliance surface regions is disabled, then values that fall within the compliantinterval (middle interval if there’s an odd number of intervals, middle 2 intervals if there’s an even number), are coloured by the coloured surface blank colour instead. When generating the coloured surface, coloured surface blank colour is to colour regions of the surface that would otherwise not be coloured.
Charts
Enabling colour backgrounds puts coloured rectangles in the background of the charts, coloured by the compliance maps. Frequency bar colour, cumulative frequency line colour, cumulative frequency line thickness, target acceptability colour, minimum acceptability colour and acceptability line thickness adjust their respective graphics in the report charts.
Cross sections
As-built surface, Additional surface, Bench face angle annotation, Catch bench width annotation, Effective catch bench width annotation, Muck width annotation and Annotation labels adjust the colour of their respective objects in the cross section images.
Cross sections
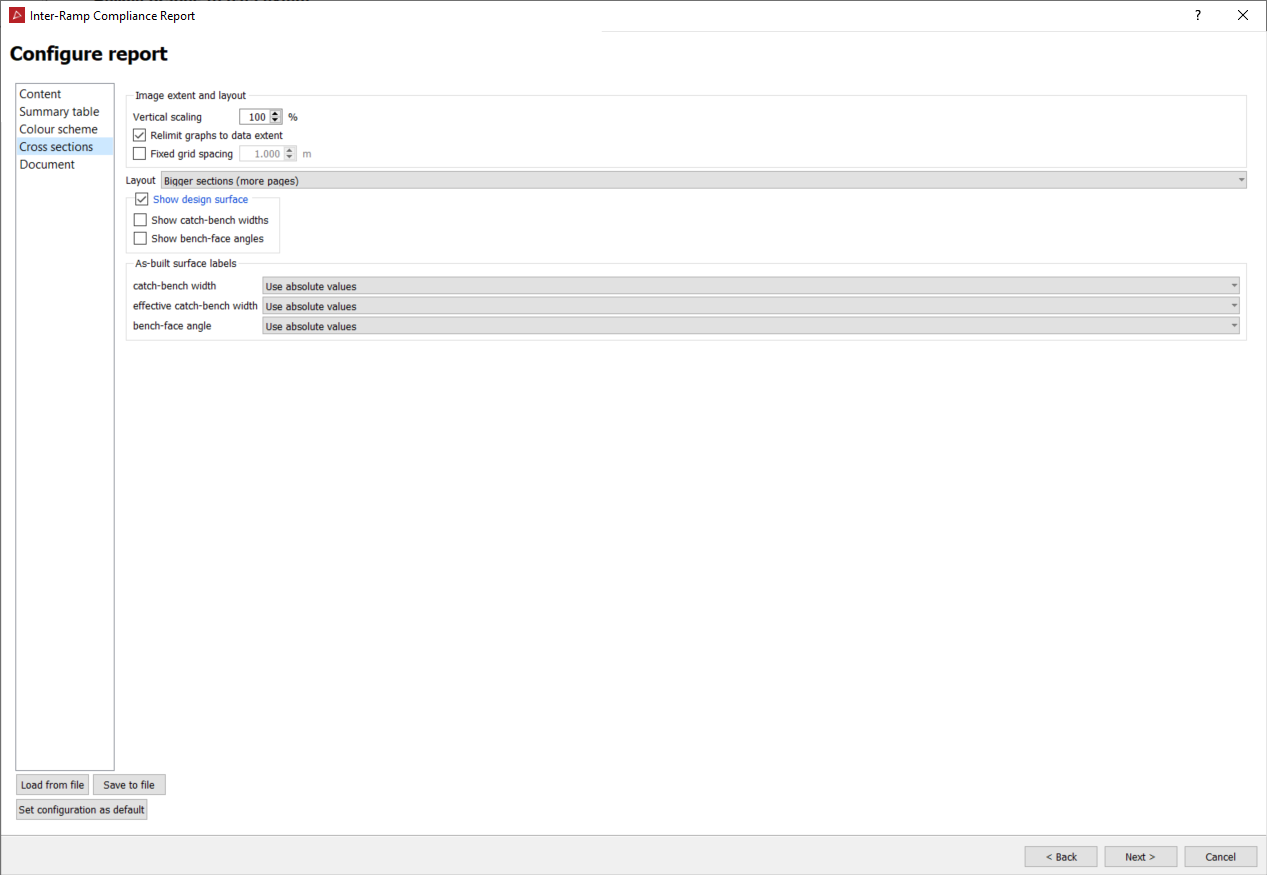
Vertical scaling
Vertical scaling allows you to squash or stretch the cross sections images vertically.
Relimit graphs to data extent
Check relimit graphs to data extent to fit the cross section grids to the extent of the data in the cross section.
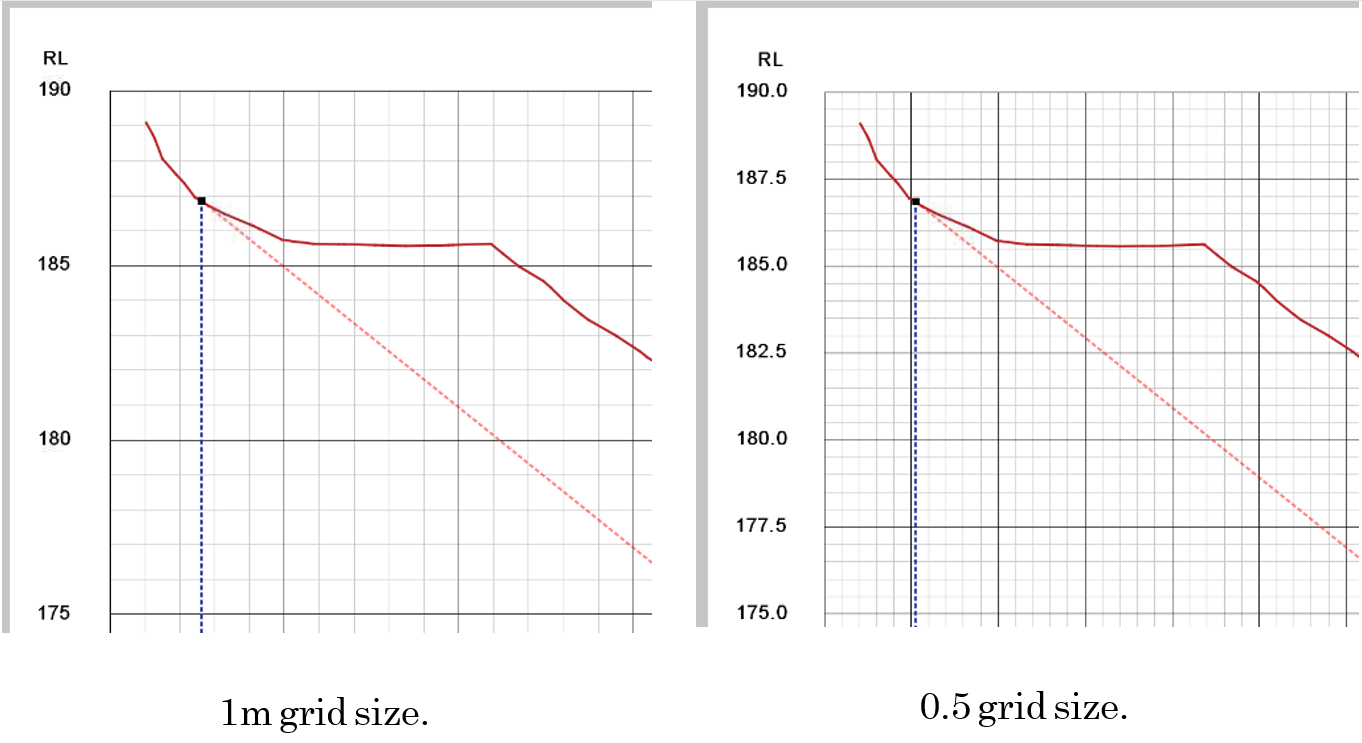
Fixed grid spacing
Fixed grid spacing allows you to manually specify the grid spacing in the cross sections.
Layout
Layout allows you to control the overall size of the cross sections in the final report document.
Layout bigger
Layout smaller
Document
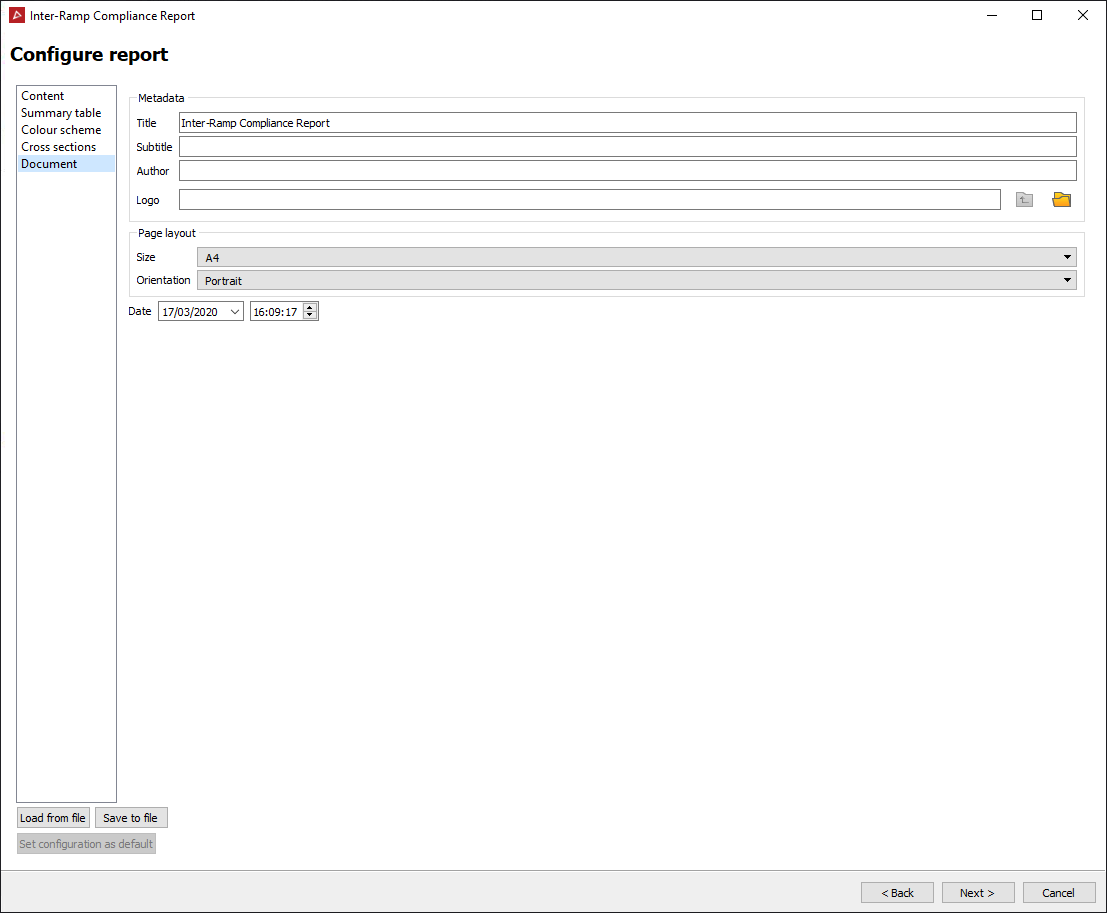
Metadata
This allows you to specify the title, subtitle author of and a logo for the final report document respectively.
Page layout
Page layout specifies the page layout of the final report document.
Date
Date is the generation time and date to put into the report. Defaults to the time and date that the report tool was opened.
Click Next to proceed to Review report images.
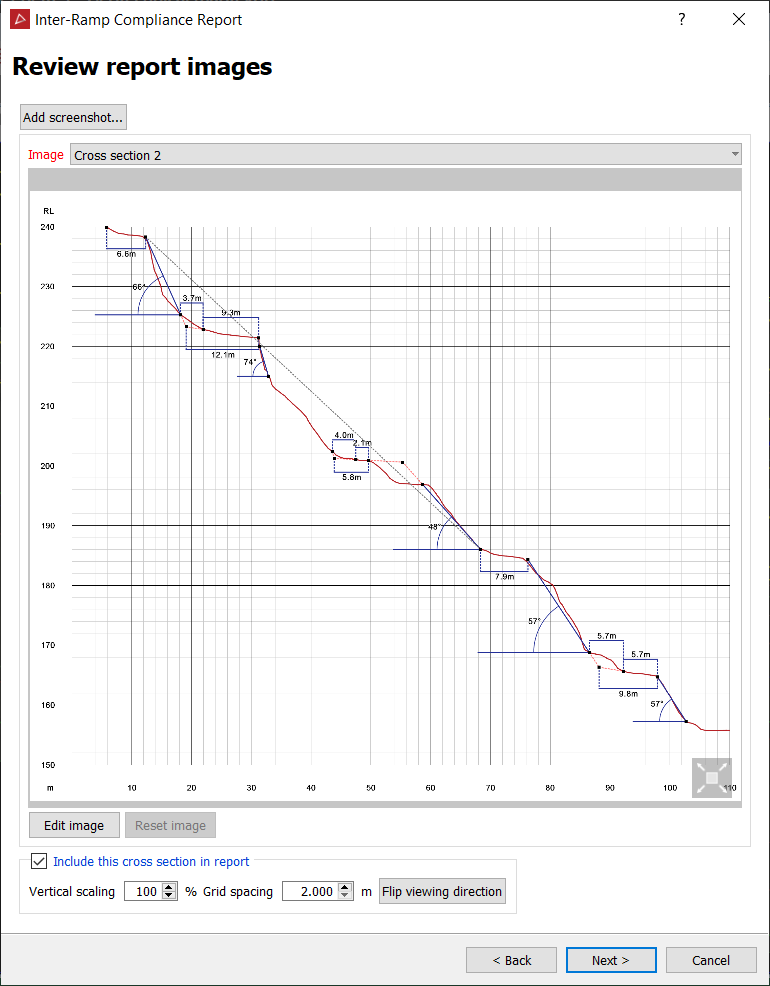
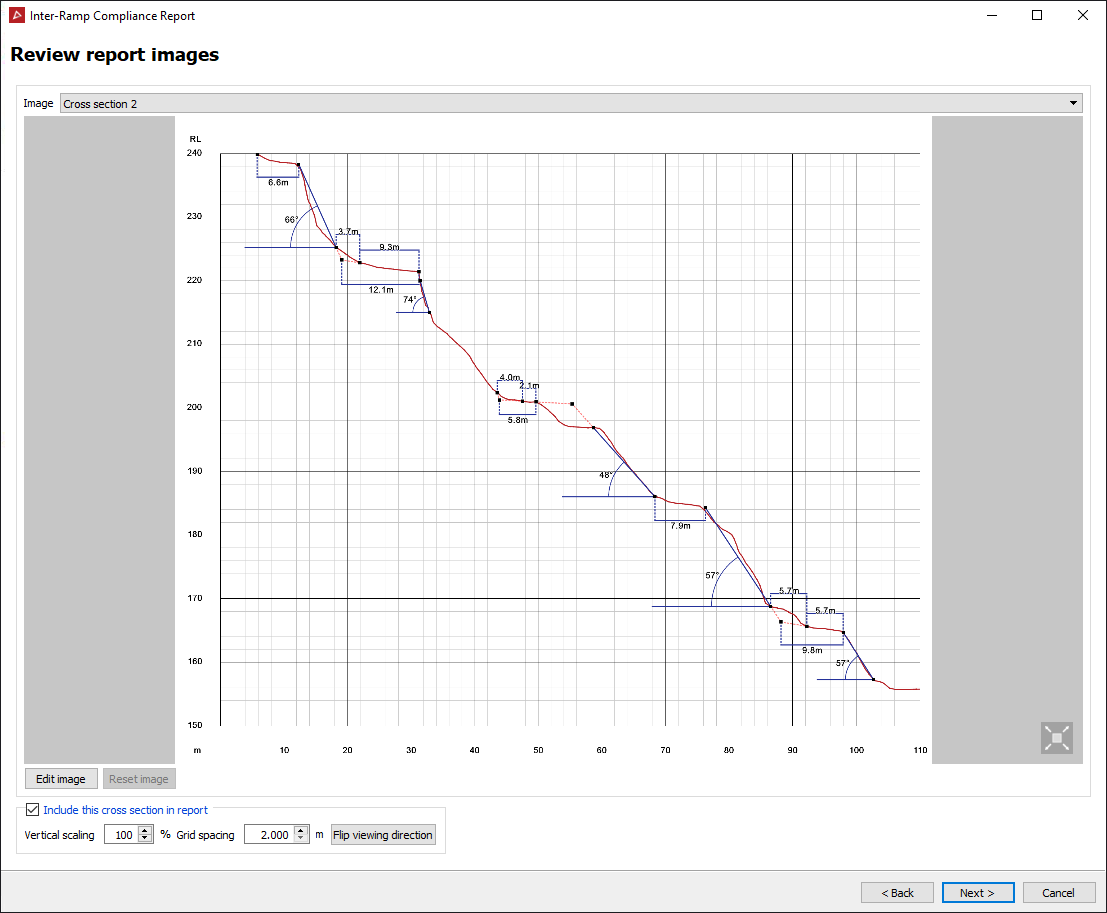
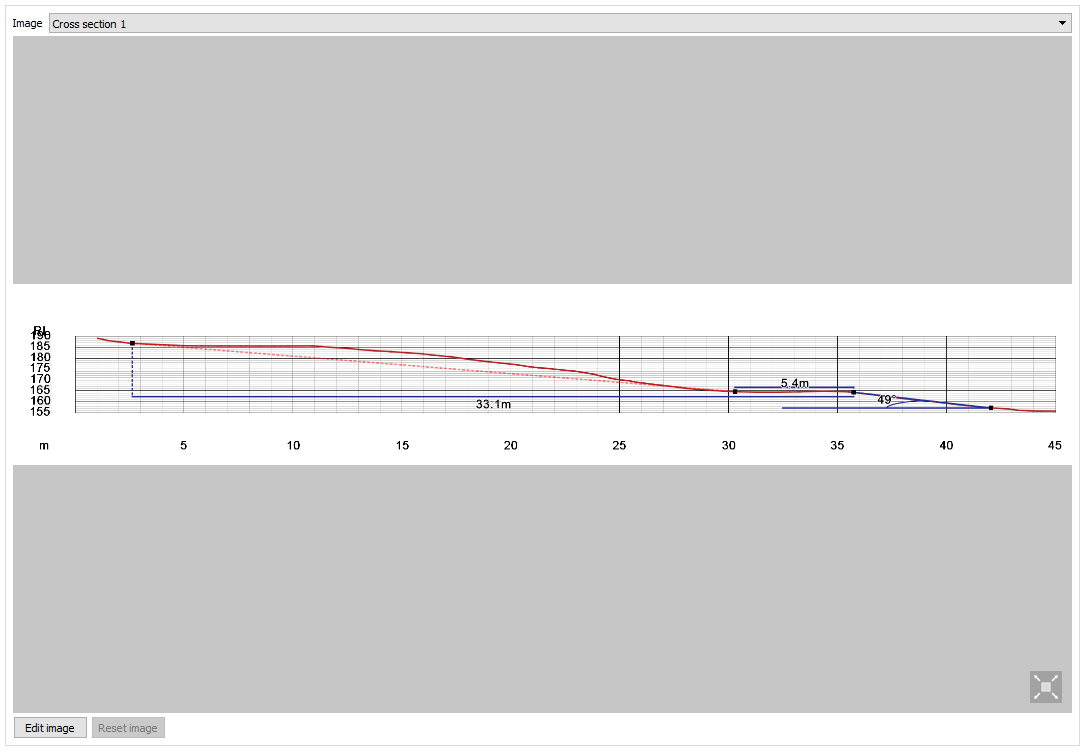
C. Review report images
Plan view
Plan view lets you look at the plan view image that will be put in the final report document. You also have the option to edit this image with the edit image button.
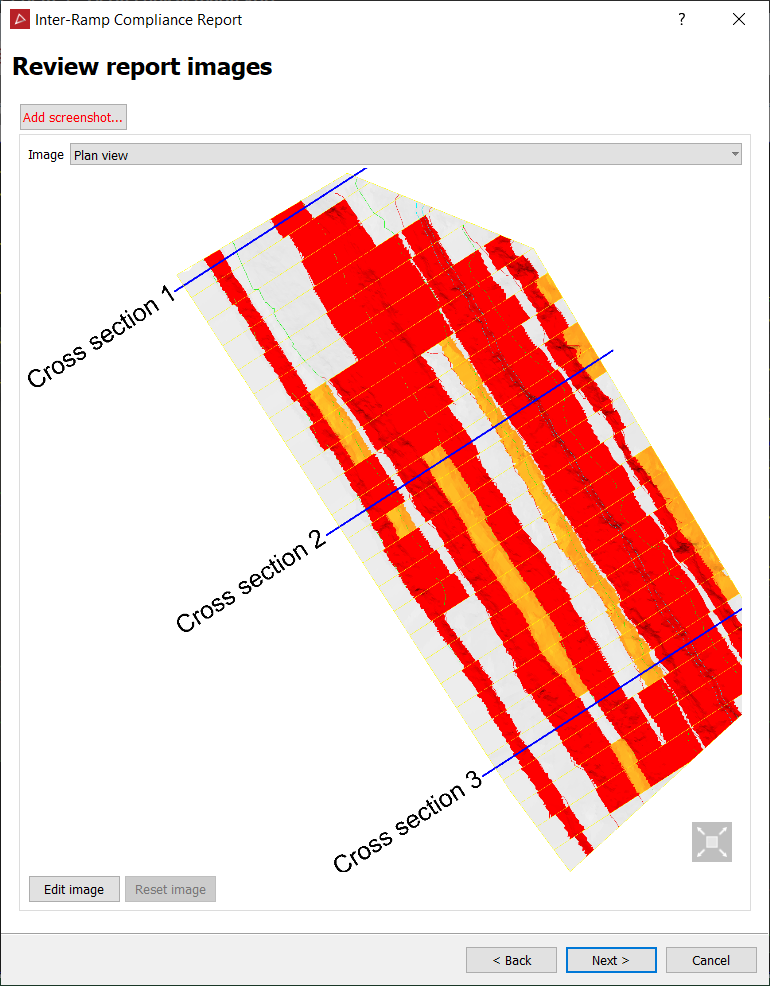
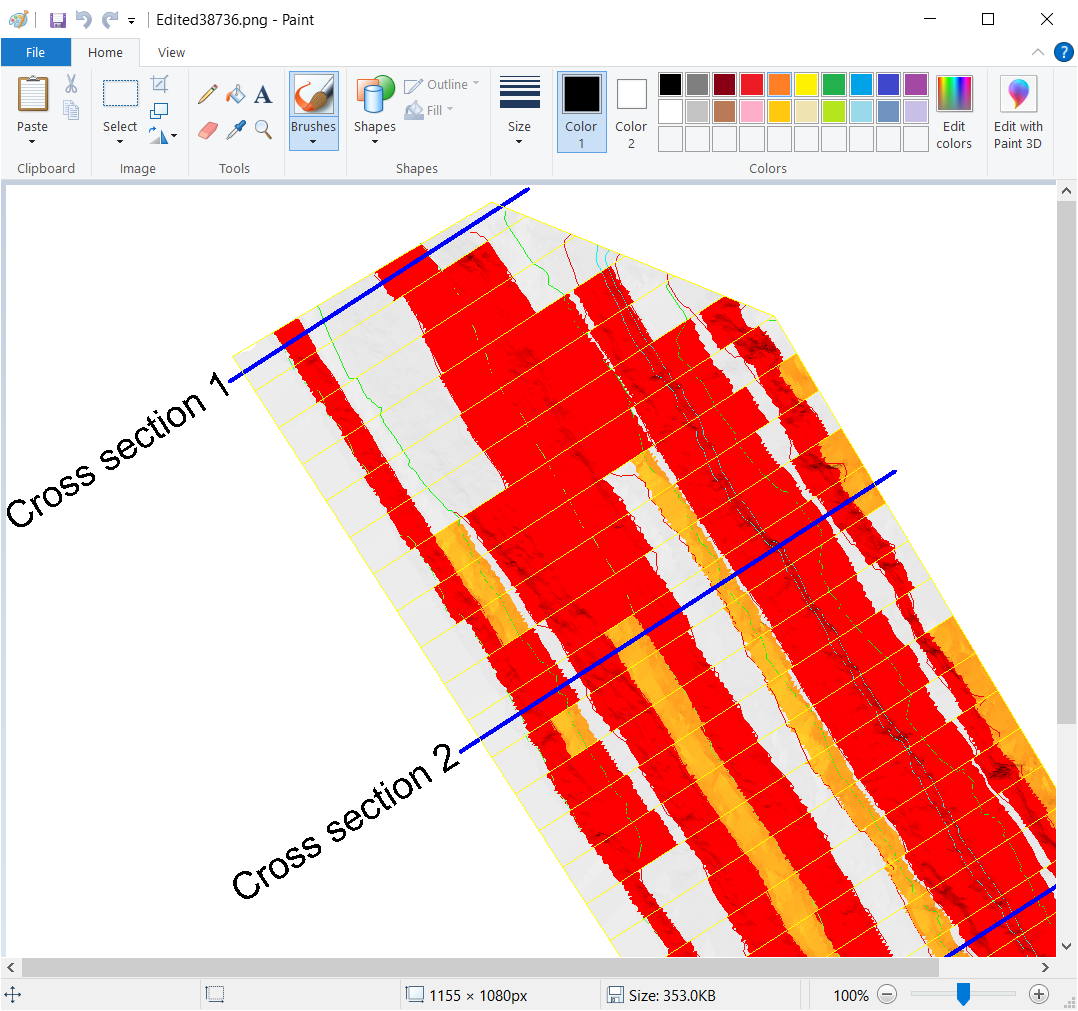
Edit image
Edit image will open your system image editor and allow you to modify the image. Any modifications will appear in the report.
Click Next to proceed to Preview report.
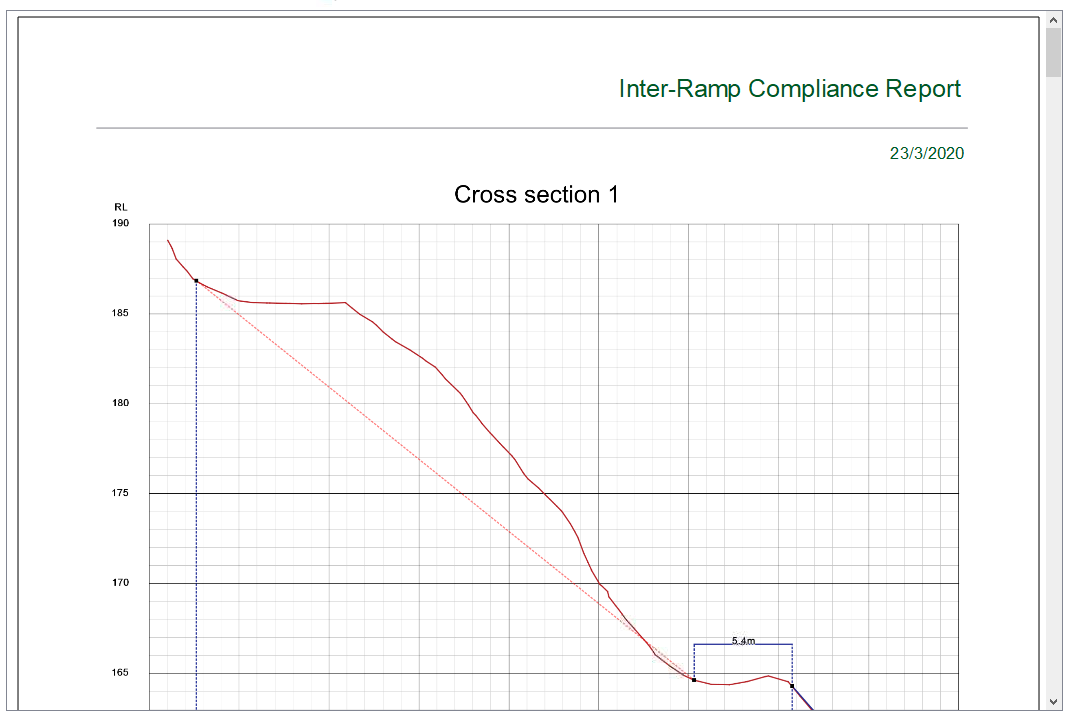
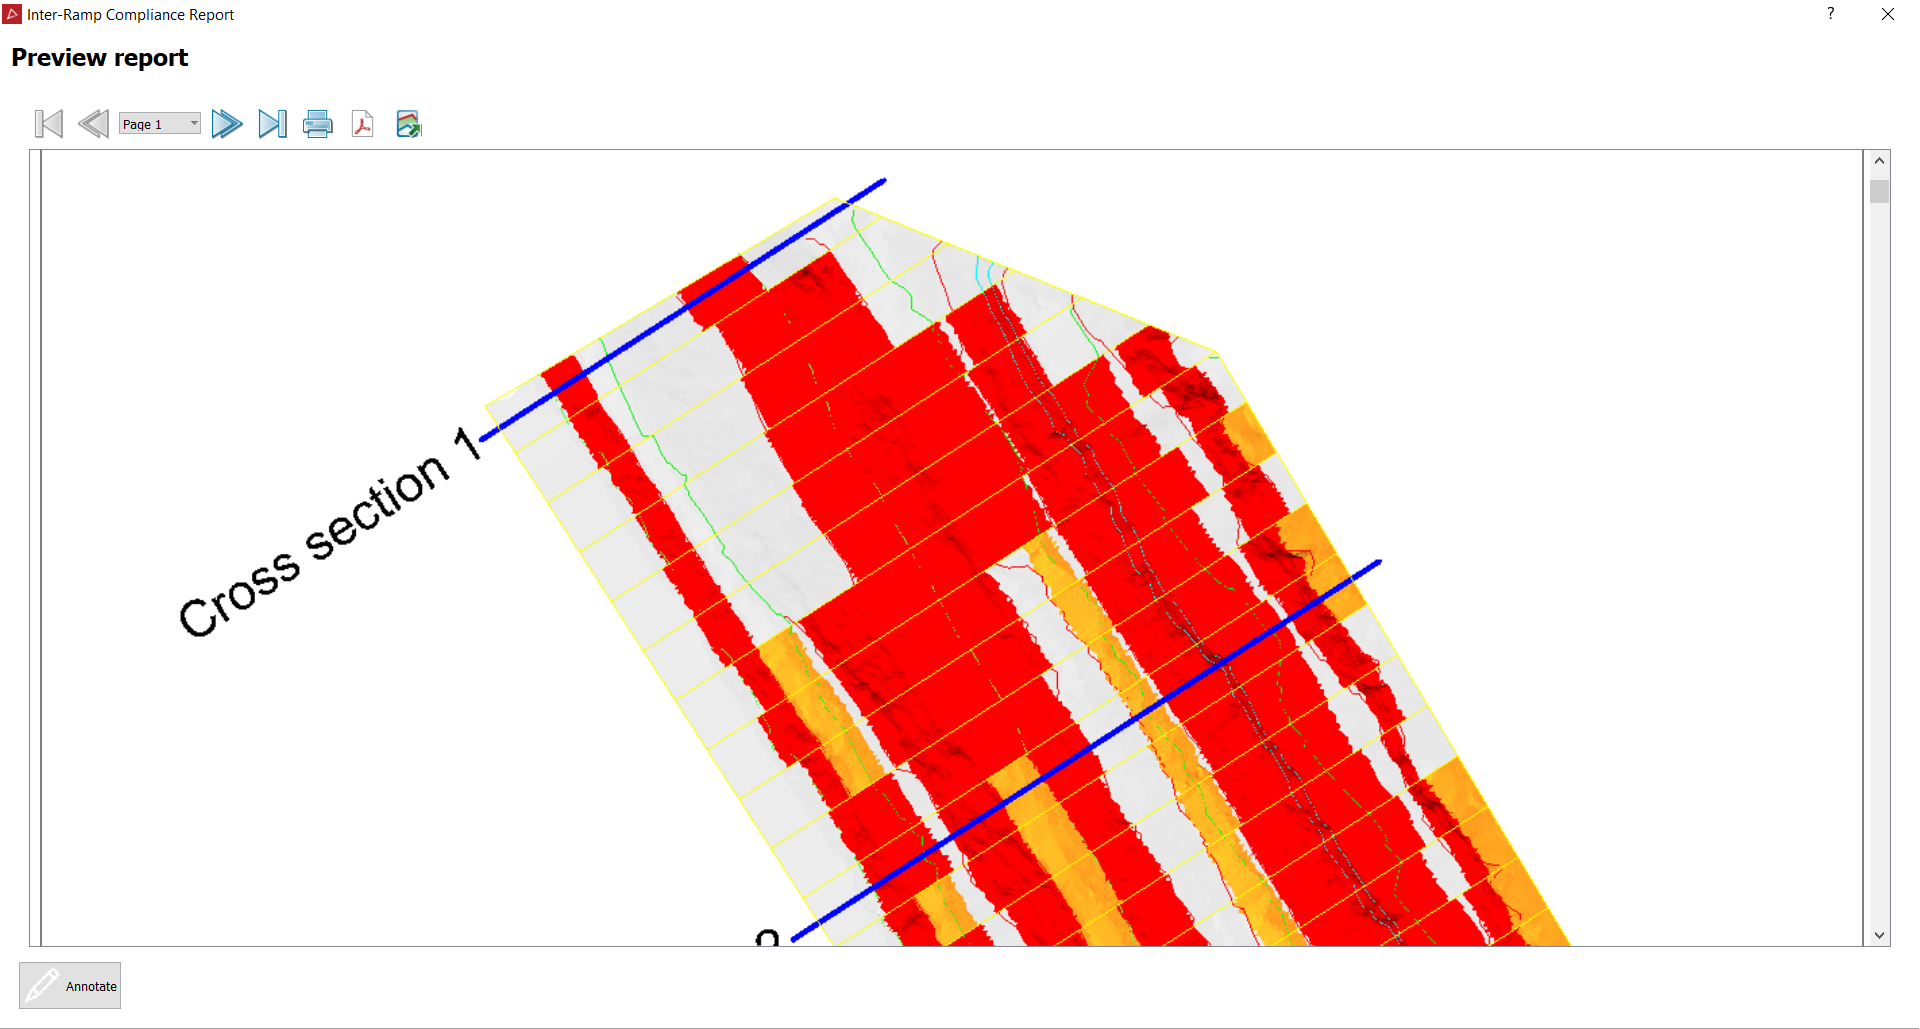
D. Preview report
This section has an interactive view of the final report document. At the top are the viewer controls, as well as options to print, save PDF and save CSV . The CSV output will contain all statistics calculated by the IRC report, as well as the summary information shown in the PDF report.
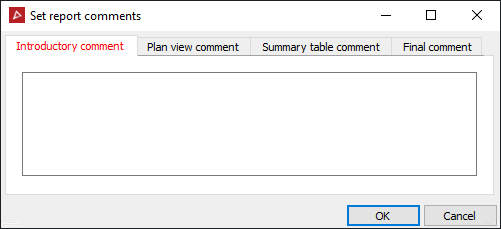
Annotate
The annotate button at the bottom of the preview report section allows you to put your own annotations or comments into the report document.
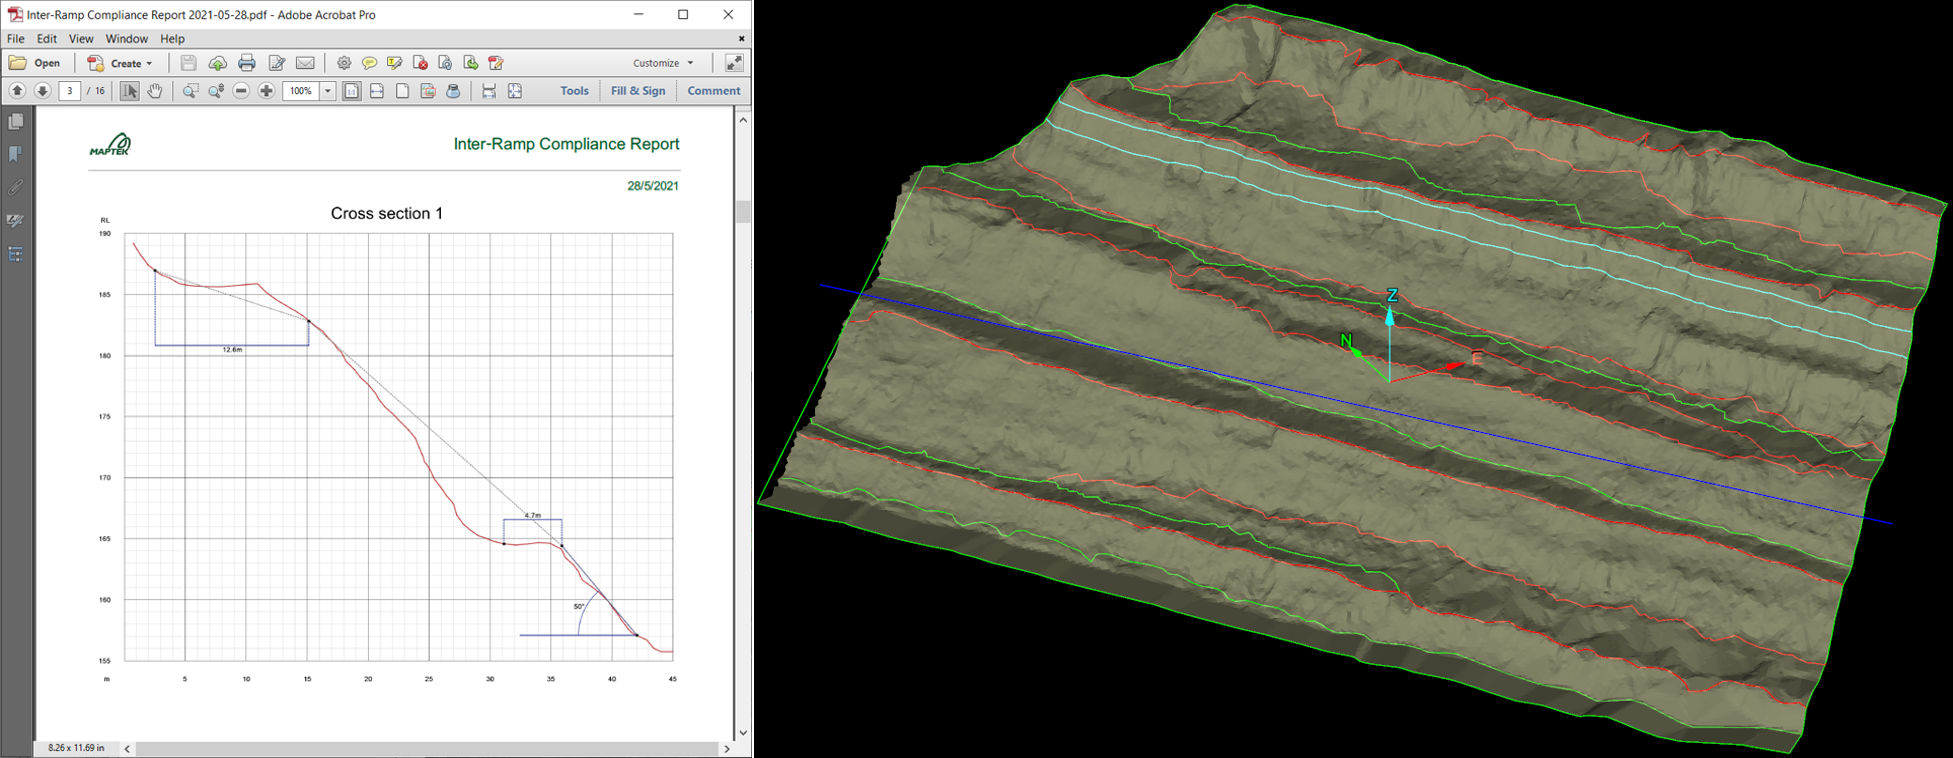
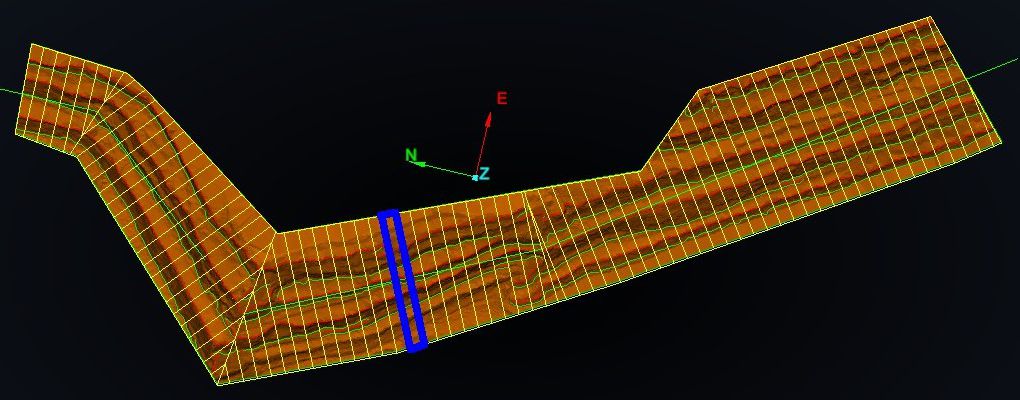
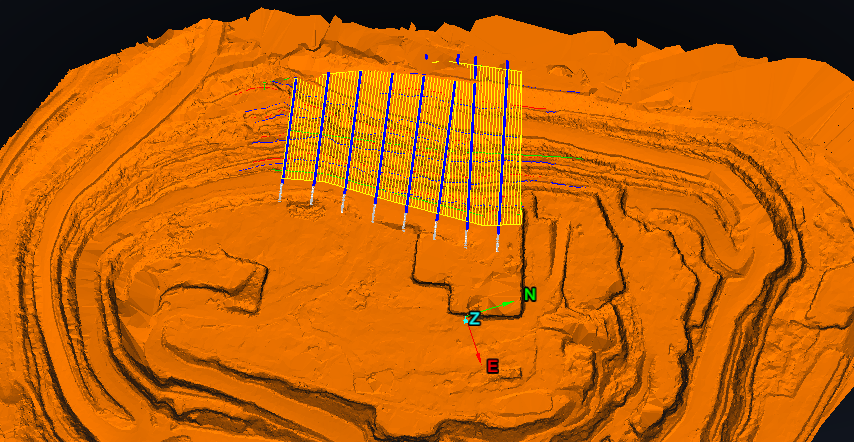
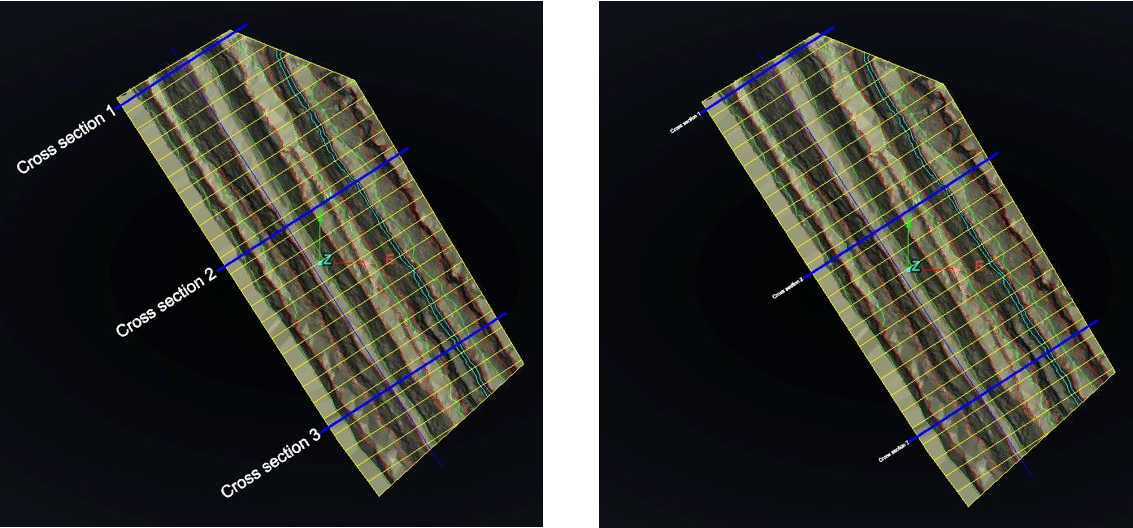
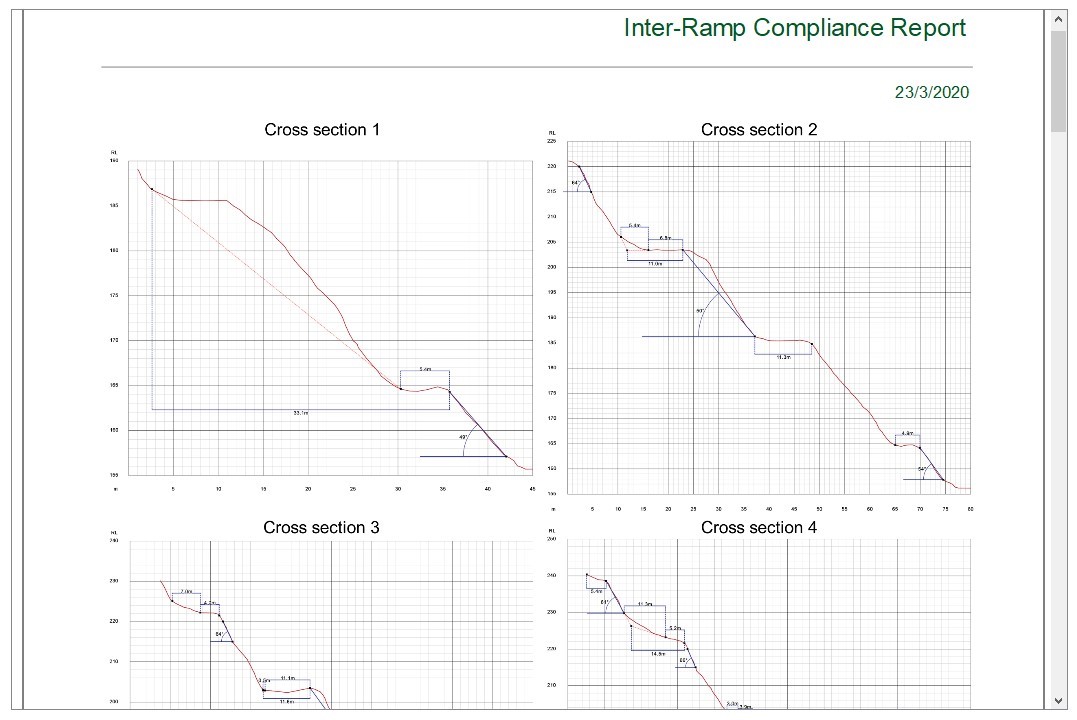
Example output:
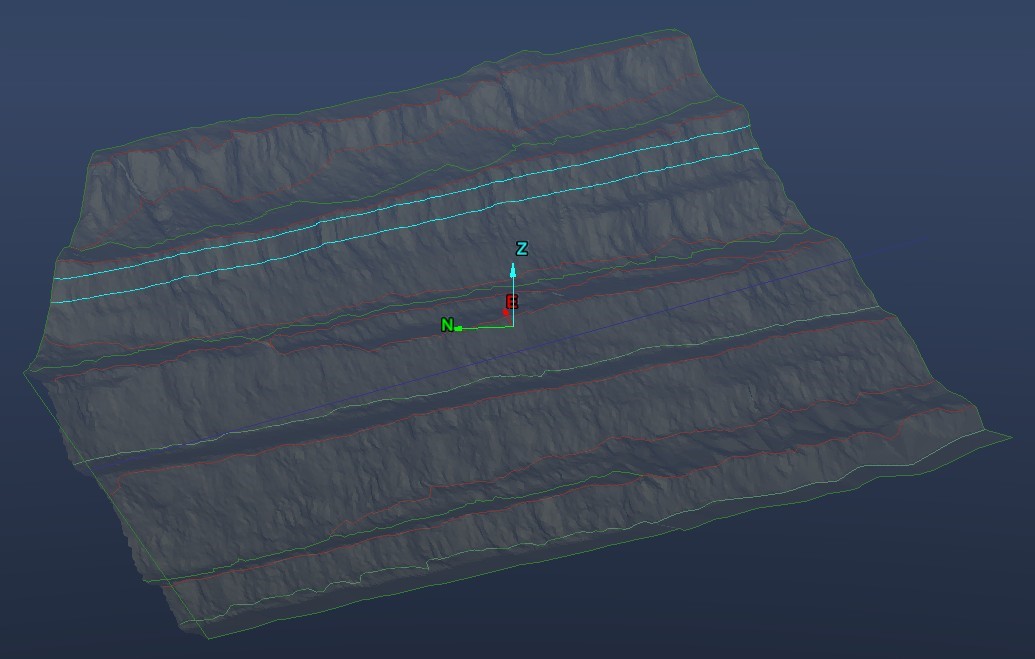
Apart from the CSV or PDF files produced by the reporting tool, coloured 3D elements are created in relevant CAD and Surfaces containers and can be selected for viewing in the 3D view window which can also be superimposed over the bench surfaces with the colours displaying levels of compliance.