Volume Reporting
The Volume report tool accepts an as-built stockpile surface and base surface and generates a report to calculate the volumes of the individual piles.
-
On the Query ribbon tab navigate to the Reporting group and select
 Volume.
The Volume report tool will open and guide you through the steps required to produce the report. -
Specify report data - select as-built stockpile surface and base surface, as well as polygons defining perimeter of each pile.
-
Configure report - adjust the look of the report and the data that will be displayed. Subsections include:
- Content
- Summary table
- Document
-
Select stockpiles for report - an interactive report window in plan view allows you to select and deselect piles.
-
Review report images - allows editing of report image of final plan view in Microsoft Paint program.
-
Generate report.
-
Preview report and save or print - examine the final output, add annotations and save as PDF, CSV or print out. Click Finish to end the process.

The View showing an example of an as-built stockpile yard with polygons indicating where the perimeter around each pile is.

|

|
||
| Specifying the data | Configuring content of report: | ||
| Base surface: import the surface that represents the base of the stockpile. | Content: set base colour and whether to include a summary table. | ||
| Stockpile surface: import the surface that represents the stockpile. | Summary table: select fill or cut mass type for the report and the material density. | ||
| Region polygons: import the polygon to define the region for the calculation. | Document: enter title, subtitle, author, logo and page layout. | ||
| Configure document size and page layout | |||
|

|

|
||
| Configuring summary table. | Interactive selection of piles and total area. | ||
| Edit image: opens the windows default image editor. | |||
Last stage of the report, displaying stockpile layout and associated summary table.


You can add additional comments to the final report before it is exported with annotate.


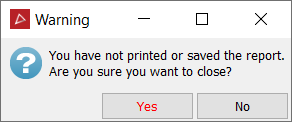
If the results have not been saved or printed, you will be warned before exiting the tool.