Rose Diagram
Source file: rose-diagrams.htm
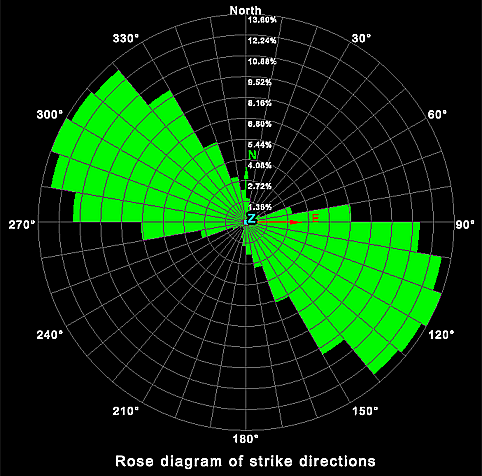
The rose diagram tool plots the frequency of data against the direction of the data. Rose diagrams help to identify directional trends in the data.
Before creating a rose diagram, you must prepare stereonet data from discontinuities. See Data preparation in Create Stereonet.
-
Once you have the data prepared, follow these steps to create the rose diagram:
-
Highlight all the created discontinuities in the project explorer.
-
On the Geotechnical tab, in the Analyse group, click
 Rose Diagram.
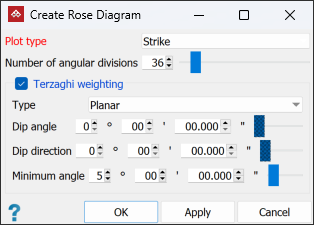
- Select
the Plot type from the drop-down
list:
- Strike direction plots the strike direction of the planes.
- Dip direction plots the dip direction of the planes.
- Trend direction plots the trend direction of the planes.
-
Specify the Number of angular divisions required in the diagram (range 2-360).
-
Select Terzaghi weighting if desired.
Terzaghi weighting uses the measurement orientation to counteract sampling bias. You can apply weighting as either of the following types:
-
Select either Planar or Linear from the Type drop-down.
-
Planar gives bias to discontinuities less likely to intersect the specified plane.
-
Linear gives bias to discontinuities less likely to intersect the specified line.
-
Set the Dip angle and Dip direction (for planar type) or Plunge and Trend (for linear type).
TipFor planar type, create a discontinuity object of the whole slope face with the dip and strike
 Query tool, then drag the discontinuity object into the dip fields of the Stereonet Contours panel.
For linear type, create a discontinuity object of the linear feature, then drag the object into the plunge and trend fields of the Stereonet Contours panel.
-
Set the Minimum angle as the lowest angle between the measurement orientation and the discontinuity that may be used for weighting.
-
-
Enter the angle of the Dip angle and Dip direction or use the slider.
-
The Minimum angle is the lowest angle between the measurement orientation and the discontinuity that will be used for weighting.
-
The
rose diagram components are saved in a custom container ![]() inside the
inside the geotechnical
container ![]() .
.
|
|
|
The direction of the data is displayed around the circumference of the diagram and the frequency of the data is displayed on the radius. |