Cell Maps
Source file: cell-maps-group.htm
The Cell Maps tools enable you to arrange discontinuity objects in cells around a pit, and then produce a report detailing various important characteristics within user defined cells.

|
|
Create Cell Create an empty cell. |
|
|
Create Cell Run Create a cell map from toe and crest lines. |
|
|
Assign to Cells Organise discontinuities into appropriate cells, according to location. |
|
|
Create Mean Discontinuity Query mean discontinuities. |
|
|
Set Face Mean Orientation Calculate the mean dip and dip direction of a surface bounded by a cell. |
|
|
Set Minimum Dip Set the minimum dip of a cell by specifying a plane or feature. |
|
|
Report Generate a cell map report. |
Create Cell
Create a single cell ![]() that can be used to organise cell runs, such as from a specific pit or area. A cell can contain other pit and
wall features for other cell mapping tools.
that can be used to organise cell runs, such as from a specific pit or area. A cell can contain other pit and
wall features for other cell mapping tools.
-
On the Geotechnical tab, in the Cell Maps group, click
 Create Cell.
A new empty cell will be created in thegeotechnicalcontainer. -
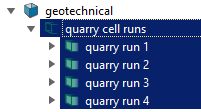
Select all cell runs to be grouped and drag them into the new cell.
-
Rename the new cell appropriately for the chosen cell runs.
|
|
|
|
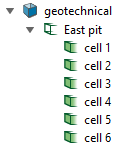
Example of all cell runs selected and placed inside the new cell object East pit |
|
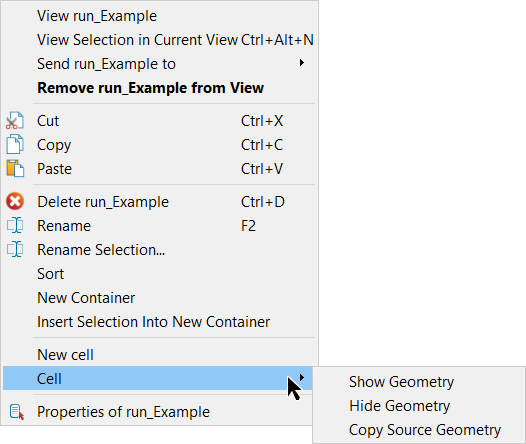
Right-click on cells to access the context menu, which includes operations such as:
-
New cell: This is the same as Create Cell.
-
Cell > Show geometry: Show the selected cells in view.
-
Cell > Hide geometry: Hide the selected cells from view.
Note: Show and Hide apply to all view windows in which the cells are loaded and are independent of the visibility editor.
-
Cell > Copy Source Geometry: Create a copy of the cell run geometry in the
geotechnicalcontainer.
Create Cell Run
Build a series of cells along a crest line and associated toe line. These cell runs can be used in analyses that focus on specific areas or groups of cells.
Before creating a cell run, you will need to draw lines representing the design toes and crests of the pit. Use one of the lines drawing tools in the Draw group of the Create tab.
Note: Cell runs can be grouped into a higher level cell container. These could represent the cell runs of a specific pit or specific area. Further processing can be easily carried out on all pit cells simultaneously in these grouped cell run collections. See Cell Maps, above.
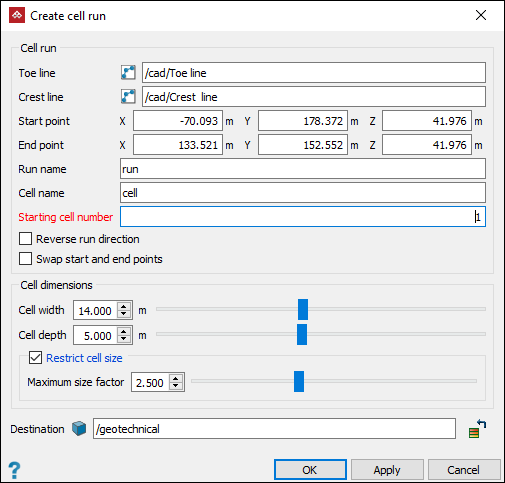
Create a cell run ![]() as follows:
as follows:
-
On the Geotechnical tab, in the Cell Maps group, click
 Create Cell Run.
The Create cell run panel will open.
-
Drag the design toe line
 into the Toe line field or enter its name.
 -
Drag the design crest line
into the Crest line field or enter its name.
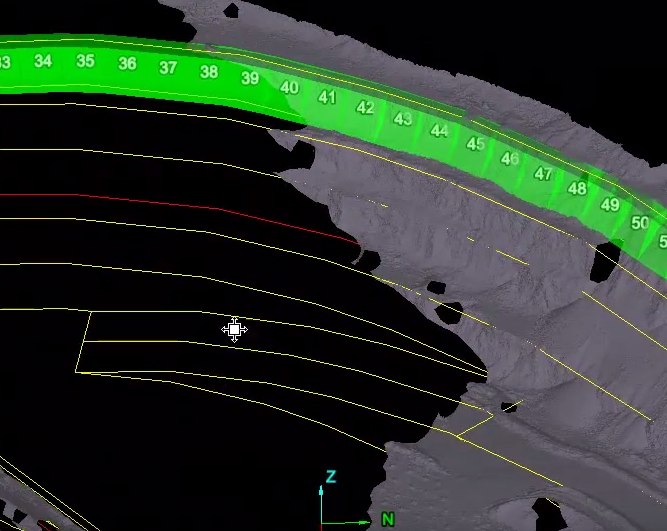
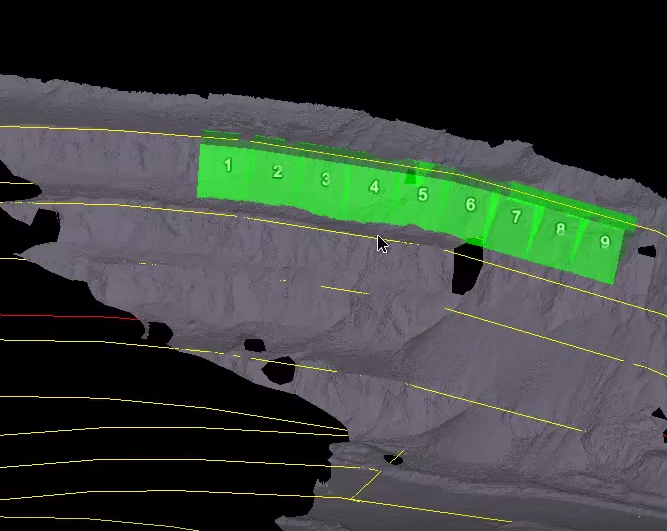
A visualisation for the run will appear as sequentially numbered green translucent boxes representing the cells. -
You can customise the cell layout, as required, by adjusting the following optional settings. Cell visualisation will update in real time.
- Click along the cell run to select a specific Start point and an End point. Alternatively, enter coordinates manually.
- Change Run name and/or Cell name.
- Change Starting cell number.
- Select Reverse run direction to reverse cell numbering.
- Select Swap start and end points to change the of the numbering sequence on the cells.
- Cell dimensions:
- Adjust Cell width and Cell depth.
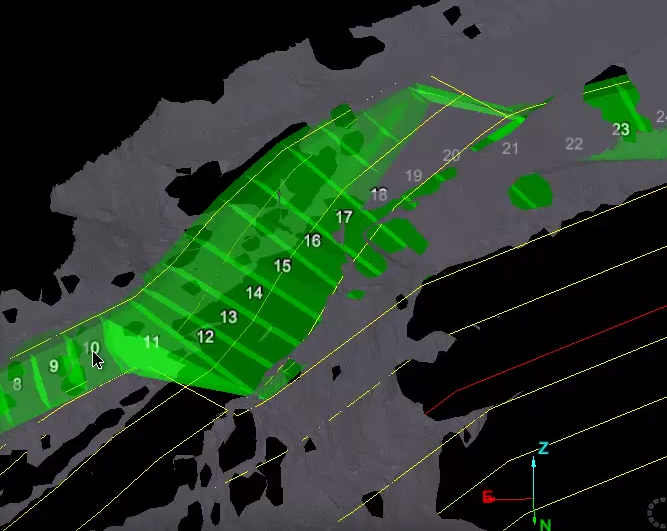
- Restrict cell size. Choose whether cells will be created between the crest and toe line if they are more than Maximum size factor times larger than Cell width or Cell depth. Enter a value for the Maximum size factor.
- Select Destination container for the cell run.
Default container is
geotechnical.
-
Click OK or Apply to complete.
Results are saved into the destination container as a cell run object.
|
spacer |
|
spacer |
|
|
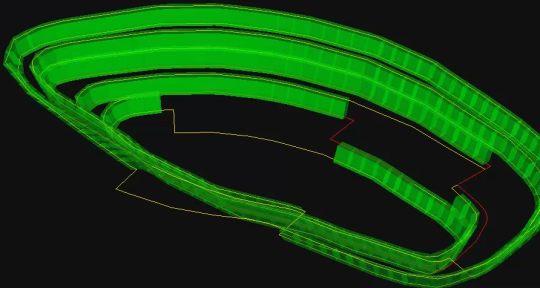
A cell run created using top toe and crest lines in a pit configuration. |
|
A cell run created using top toe and crest lines in a pit configuration. |
|
A cell run with unrestricted cell size. With restriction, longer cells (cells 10, 11, 12, etc.) would not be created. |
|
|
|
|
Four cell runs organised under one main cell object for a pit. See Create Cell. |
|
Assign to Cells
Discontinuities are assigned to cells that contain them when superimposed in 3D space. The result is that individual discontinuities appearing within a cell will be either copied or moved to the cell object itself.
Assign discontinuities to cells, as follows:
-
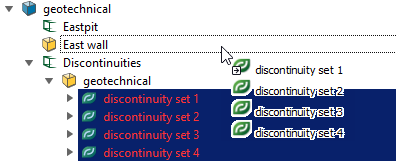
Select the discontinuities
 or the discontinuity sets
  to be assigned.
 -
On the Geotechnical tab, in the Cell Maps group, click
 Assign to Cells.
(Alternative 1: Right-click after selecting all discontinuities, then select Assign to cell map... from the context menu. )
(Alternative 2: Select all discontinuities in the project explorer, then drag them onto the main cell object containing all relevant cell runs.) -
Drag all relevant cells and cell runs to the Cell map field. Alternatively, select them in the project explorer, then click
 . Click
  to remove selections.
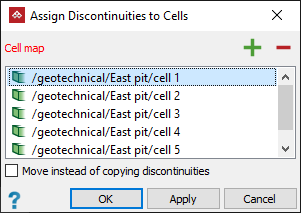
-
Select Move instead of copying discontinuities if desired. Otherwise, discontinuities will be copied into cells.
-
Click OK or Apply to complete. Discontinuities are assigned to their equivalent cells and will be visible in the view window.
Note: Discontinuities
can still be readily manipulated and moved around as desired, even into
different cells.
|
|
|
Close up view of discontinuities sitting inside the cells. |

Tip: Alternatively, select and drag all discontinuities onto main cell object.
Create Mean Discontinuity
Create
mean discontinuity will create a single discontinuity representing
the mean orientation of a selected discontinuity
set. The new mean discontinuity
will be placed in the geotechnical
container.
You can select multiple discontinuity sets to be processed simultaneously. All other (individual) discontinuities, if selected, will be ignored. Cell arrangements will be ignored.
This tool allows to select and group closely packed discontinuities into discontinuity sets and then replace them with a single (average) discontinuity. This results in a more evenly distributed representation of discontinuities, particularly for the purpose of kinematic analyses with stereonets. Otherwise, closely clumped discontinuities can produce undesired bias.
Create a mean discontinuity as follows:
-
Select the discontinuity sets
to be averaged. Note: If a selection contains other individual discontinuities and grouping in cells, these are ignored.
-
On the Geotechnical tab, in the Cell Maps group, click
 Create Mean Discontinuity.
 -
Select OK or Apply to complete.
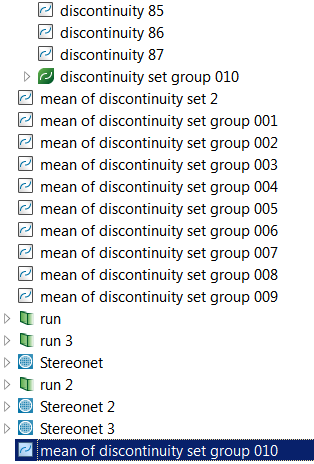
New discontinuities will be created with the name mean of discontinuity set.

|
spacer |
|
spacer |
|
|
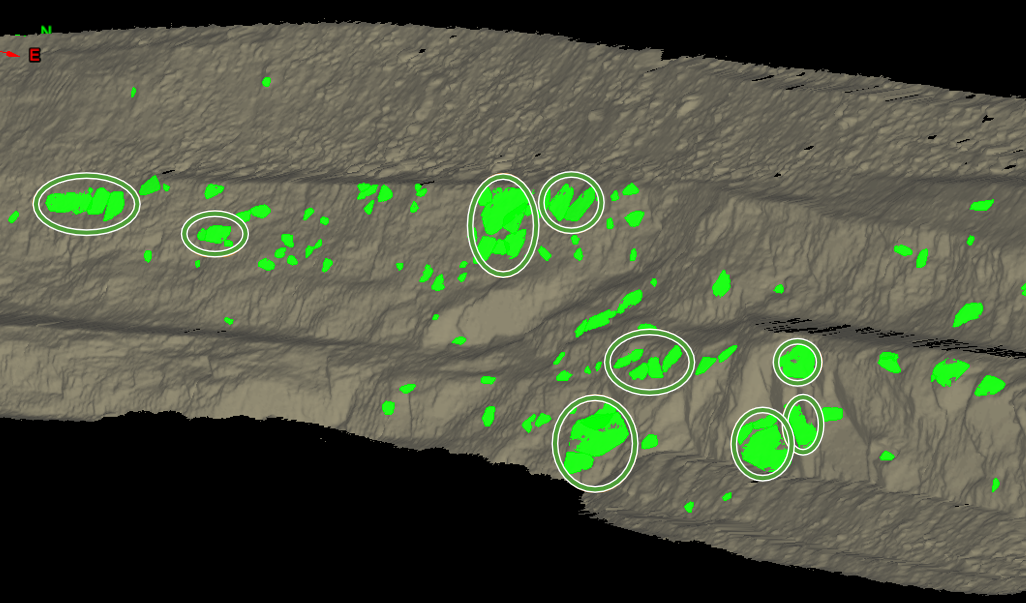
Initial distribution of discontinuities. |
|
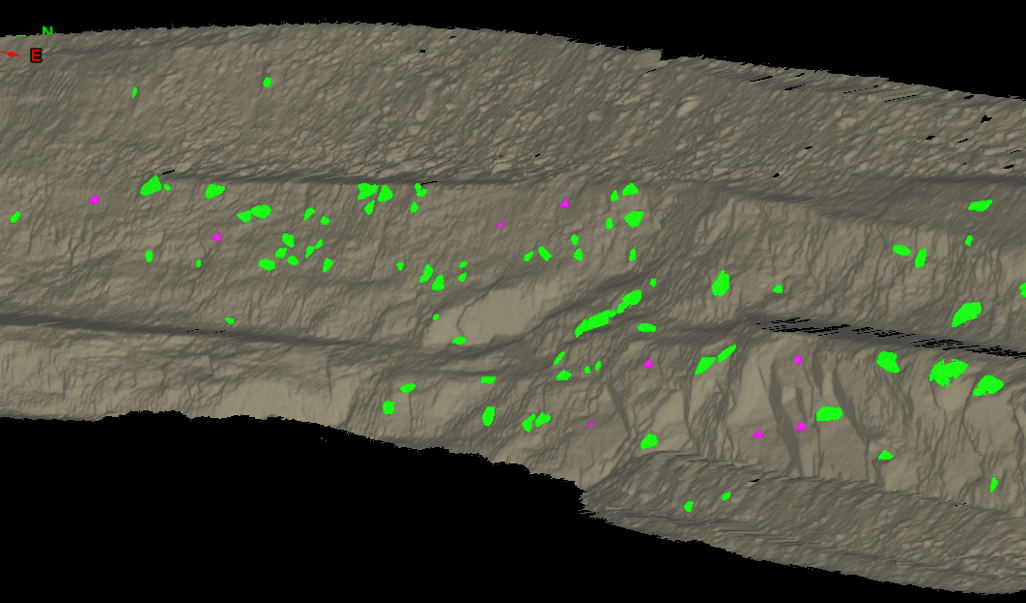
Discontinuities to be grouped together are moved into discontinuity sets. |
|
Result after discontinuity sets have been replaced with a mean discontinuity object (pink triangles). |
|
spacer |
|
|
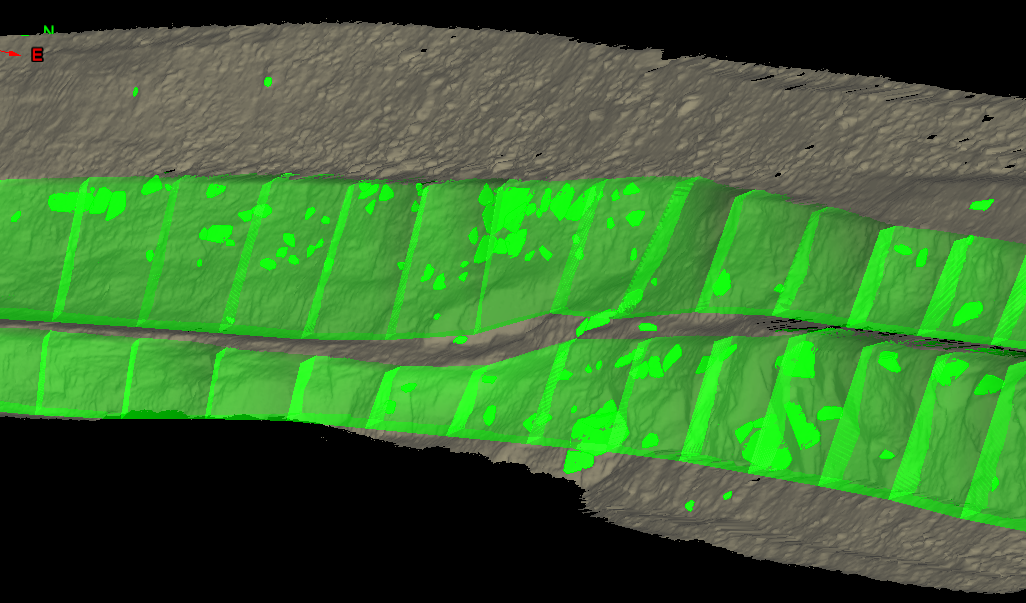
Initial example above - shown in cell runs. |
|
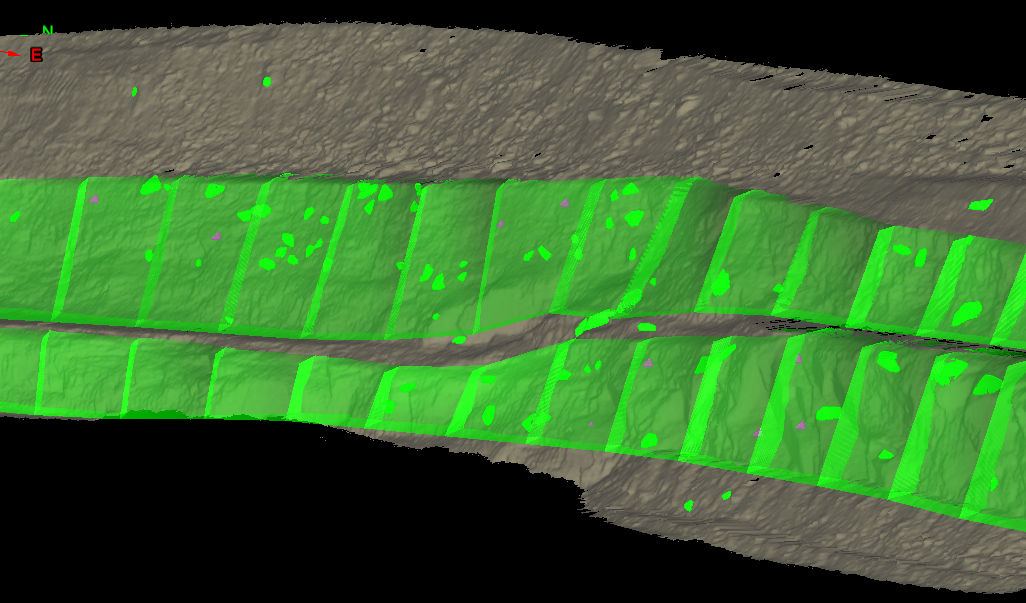
Result, as above, after creating mean discontinuities to replace discontinuity sets - note that results are independent of cell runs. |
Cell Face Mean Orientation
This tool uses the section of pit face or wall contained within a cell to calculate a mean face orientation. The mean orientation value is then assigned to the cell. This quantity and others can be retrieved using the cell map report tool. See Cell map report.
Calculate mean orientation as follows:
-
On the Geotechnical tab, in the Cell Maps group, click
 Set Face Mean Orientation.
 -
Select the surface

 to calculate cell face mean orientation and drag it into the Surface field.
 -
Add and cell runs to the cell map field by selecting them in the project explorer followed by the
to add or use the to remove selections. Alternatively, drag the cells into the field box.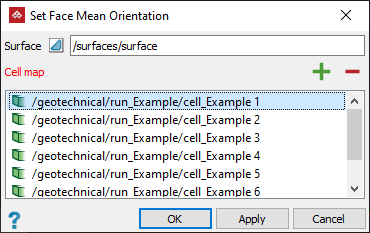
-
Click OK or Apply to carry out the process.
The results are displayed in the report window.
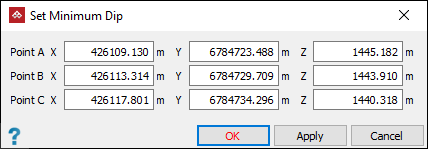
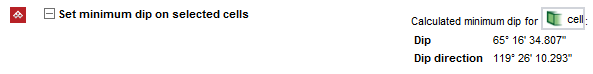
Set Minimum Dip
This tool allows you to set a minimum dip value for a cell. You can enter values or select three points on the pit wall or surface that represent the plane of the minimum dip value. This quantity and others can be retrieved using the cell map report tool.
Set a minimum dip as follows:
-
Select the cell
 to be assigned a minimum
dip value.
to be assigned a minimum
dip value. -
On the Geotechnical tab, in the Cell Maps group, click
 Set Minimum Dip, or
right-click on the cell for the context menu and navigate to Cell then select Set Minimum Dip....
Set Minimum Dip, or
right-click on the cell for the context menu and navigate to Cell then select Set Minimum Dip....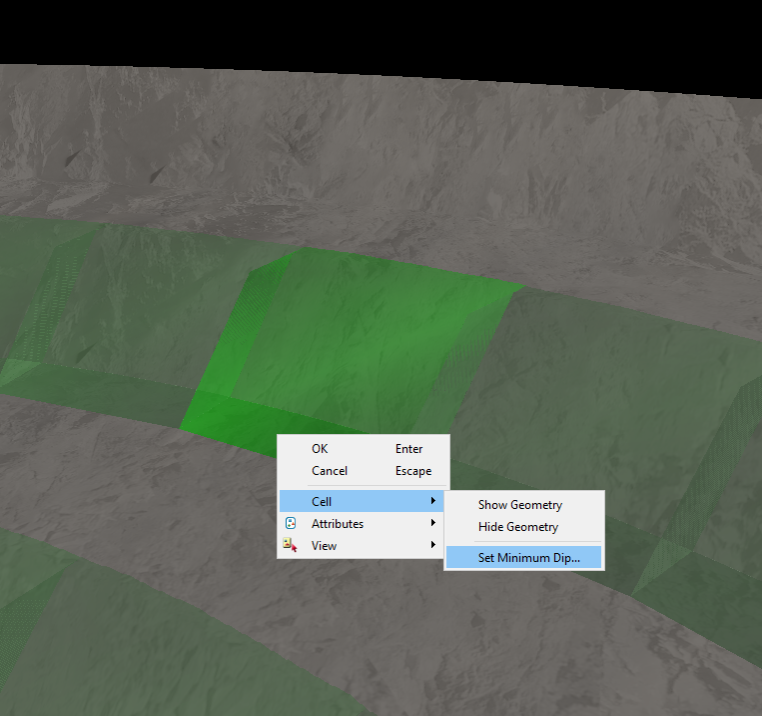
-
Click OK or Apply to complete.
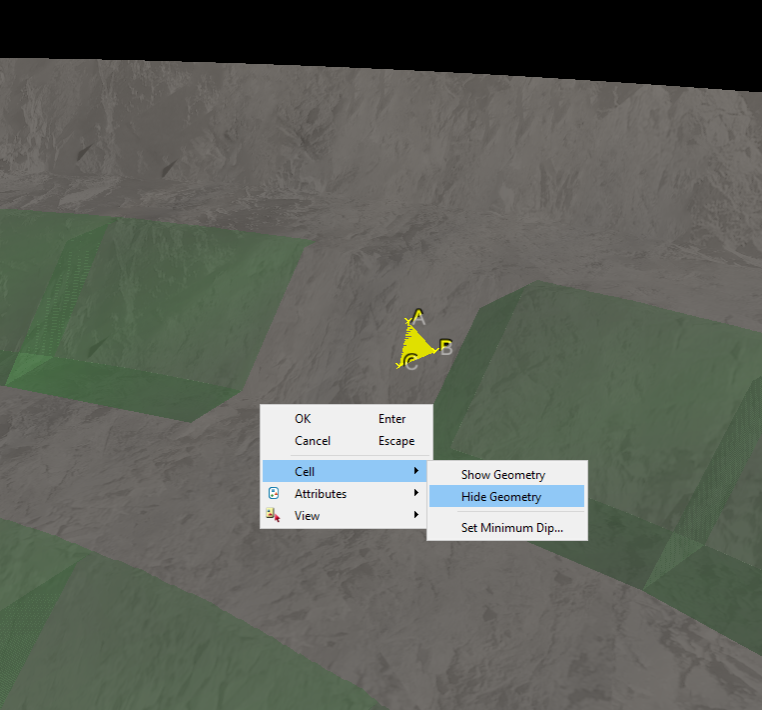
A panel will open with fields for the coordinates of three points. Enter coordinates or select each field and click on the part of the pit surface you want to use to define the plane of minimum dip.
Note: You can also Hide Geometry to assist the process of clicking on pit surface points by right-click on the cell for the context menu and selecting Hide Geometry.
Results are
displayed in the report window.
The minimum dip is also included
in a cell map report.
Tip: To view geometry of the cell again, right-click on the cell in the project explorer for the context menu and select Show Geometry.
Cell map report
Cell map report produces a report detailing various important characteristics of the selected cells.
Create a cell map report as follows:
-
Select the cells
to be included in
the report. -
On the Geotechnical tab, in the Cell Maps group, click
 Report.
 -
You can write out the data to a text file or PDF document. The PDF will also allow the inclusion of a cell map image.
-
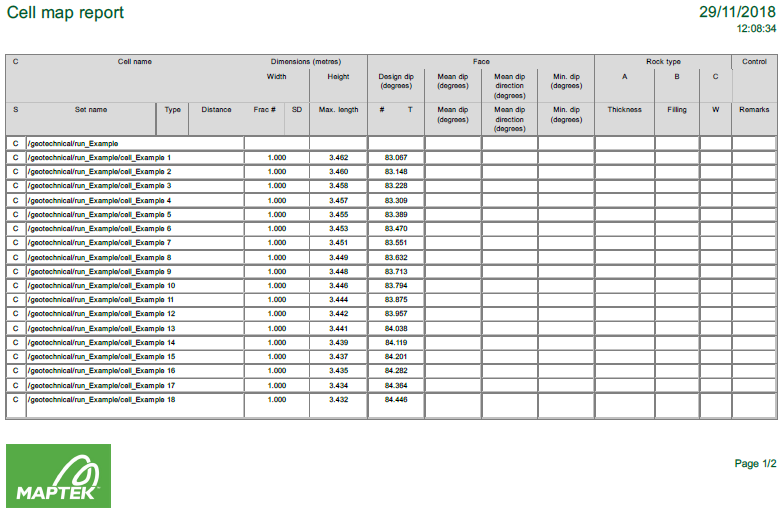
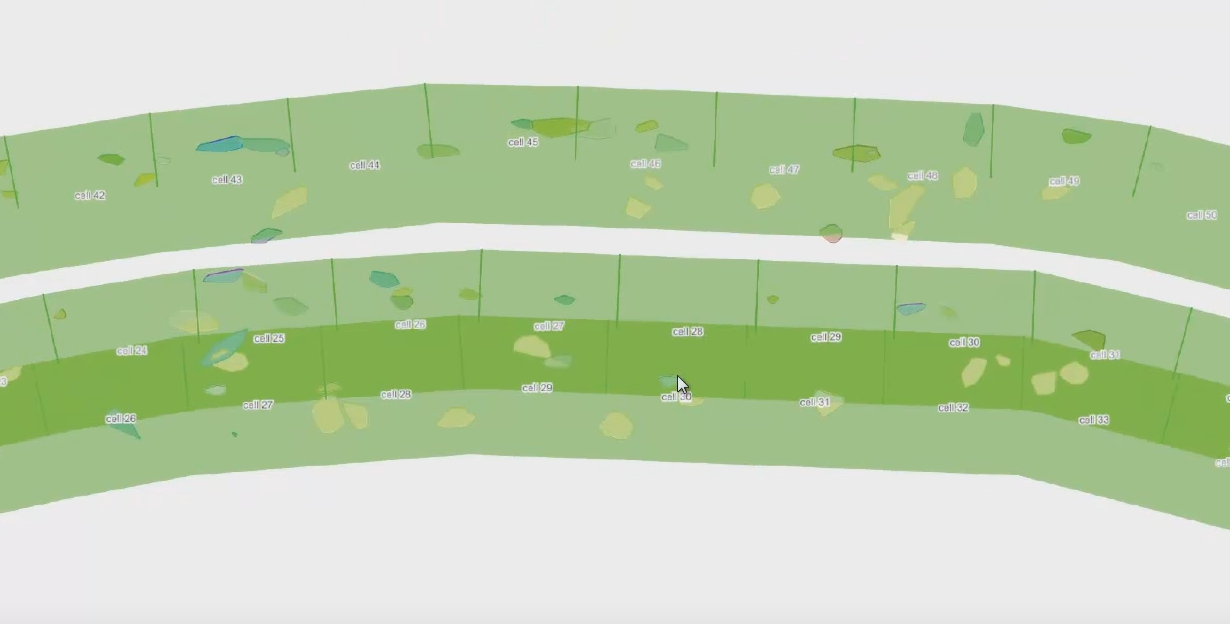
Click OK or Apply to commence generating the report. The report will contain the cell map image (if selected) and a table listing characteristics of each cell that has been selected.
If the cell map report transaction is launched with a view window active, the PDF report image will be generated using the viewpoint of the active view, including any other objects present in the view, otherwise by default it will show just the cell map selection in plan view.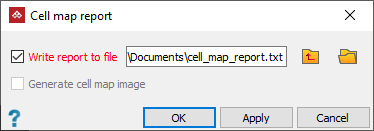
Tip: If you clear Write report to file, the report will be displayed in the report window only.
|
|
|
Cell map image is an option for including in the report. |
|
|
|
Example of a table in the Cell map report, listing various characteristics about each cell. |