Distance from Objects
Source file: distance-from-objects.htm
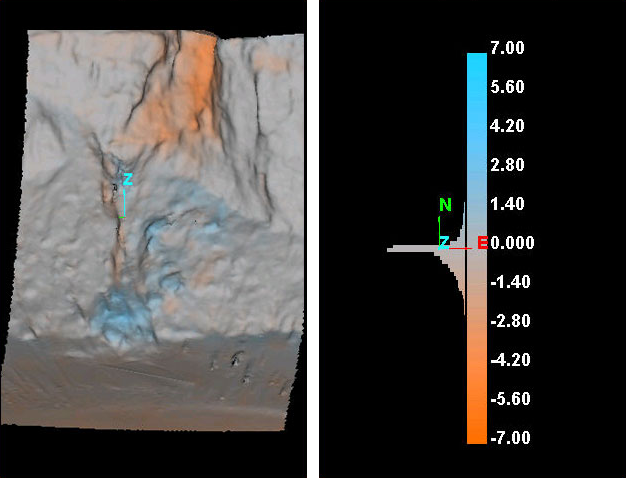
Distance from Objects compares objects of interest to base (reference) objects and applies colours by the distances between the objects, according to criteria specified in the colour scheme editor.
Colouring by distance is useful for comparing as-built surfaces against design models to highlight non-conformance. It can also be used to identify changes between scans of the same area, such as a slow moving failure in an open pit mine.
To colour by distance, proceed as follows:
-
On the Home tab, in the Colour group, click
 Distance from objects.
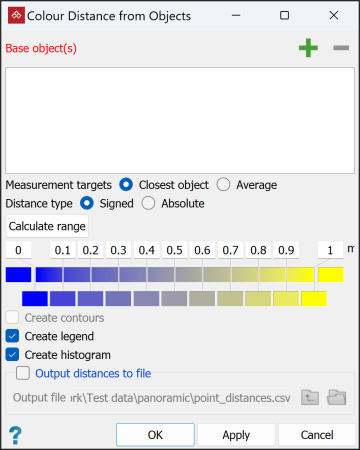
-
Populate the Base object(s) field with at least one reference object.
-
Select the objects of interest in the project explorer or view window.
-
From Measurement targets, select one of the following options:
-
Closest object to colour object points by distance from the closest base object.
-
Average to colour object points by the average distance to all base objects.
-
-
From Distance type, select one of the following options:
-
Signed to colour by distance and vertical direction from a base surface.
-
Absolute to colour by the distance only.
-
-
Adjust the colour scale as required. See Modifying a colour scale for detailed instructions.
-
Select Create contours to make contours of selected surfaces based on the distances from the base objects. The contours will be spaced according to the colour band interval. The contours will be saved in the
contourscontainer and loaded into the active view window.Note: Create contours is only available when at least one surface is selected as an object of interest.
-
Select Create legend to make a legend indicating the colour scale. Double-click on the legend in the project explorer to view it.
-
Select Create histogram to make a graph displaying the distribution of data in front of and behind the surface. The chart will be placed in a secondary container called
colour by distance from objects legend. Double-click on the container to view the chart. -
Select Output distances to file to save a CSV file listing the points of the selected surface and the distances from the base objects. Browse to and enter the Output file name and path.
-
Click OK or Apply.