Volume
Source file: report-volume.htm
The Volume reporting tool uses as-built stockpile surfaces and base surfaces to calculate the volumes of the individual piles and output the results in a report.
|
|
|
View showing an example of an as-built stockpile yard with polygons indicating where the perimeters around the piles are. |
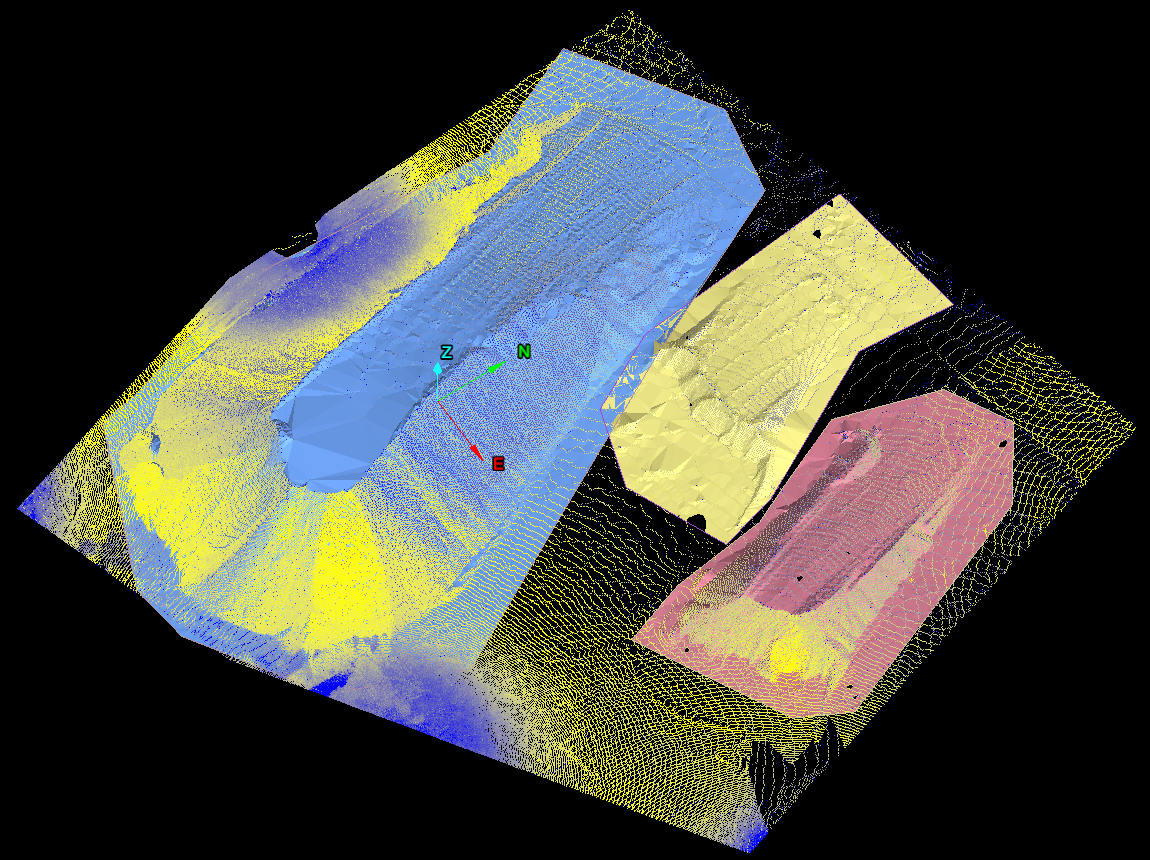
Tip: Define each stockpile perimeter with a polygon of a different colour. These colours will be used in the report to tie the images of the piles to their corresponding data.
-
On the tab, in the Reporting group, click
 Volume.
The Volumetric Report tool will open on its Specify report data page.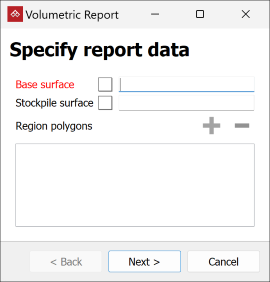
-
Drag the base and stockpile surfaces

 into the corresponding fields. Add polygons
  defining the perimeters of the piles.
Tip: You can drag in individual or multiple polygons, or containers of polygons.
Tip: Keep all relevant polygons together in one container. You can then drag the whole container into the Region polygons field.
-
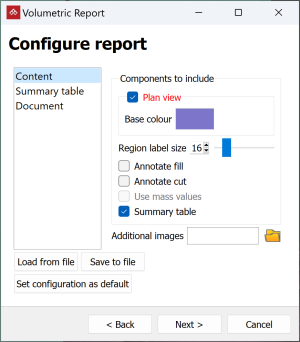
Click Next > to open the Configure report page.
Adjust the look of the report and the data that will be displayed with the following criteria:-
Content. Set base colour and whether to include a summary table. Import additional images to include.
-
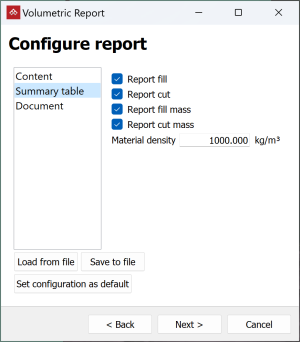
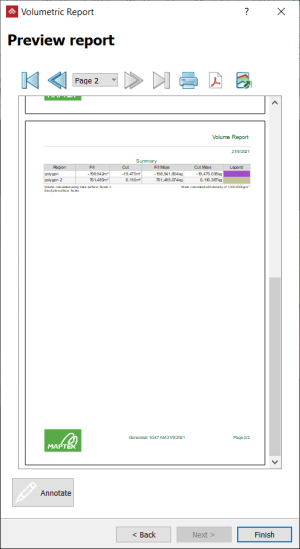
Summary table. Select the details to summarise from fill, cut and masses for the report. Enter the material density if reporting masses.
-
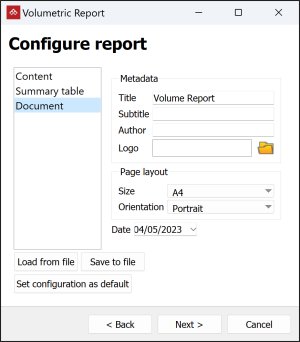
Document. Enter metadata to include (report title and subtitle, author's name, and logo) and a page layout. Change the date if necessary.
-
-
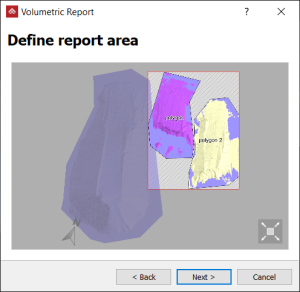
Click Next > to open the Define report area page. An interactive report window in plan view allows you to select and deselect piles. Select the area containing the stockpiles to report.
-
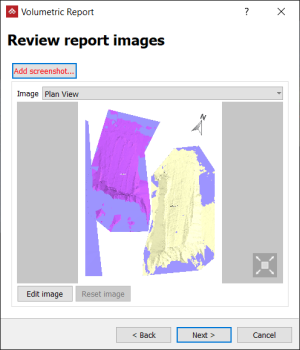
Click Next > to open the Review report images page. Review the report images and make any final adjustments, if needed. To do this, click Edit image to open the Windows default image editor.
-
Click Next > to open the Preview report page.
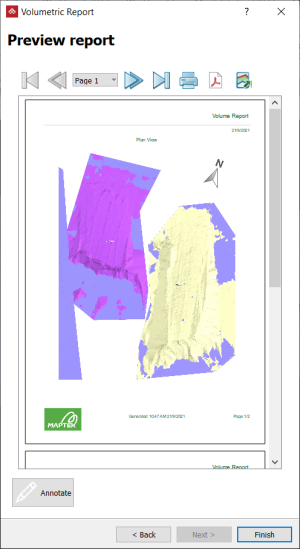
-
Click < Back to make any further changes.
-
Click Annotate to add comments to each section of the report before publishing.
-
Click the
 button to print the report.
-
Click the
 button to save the report as a PDF.
-
Click the
 button to save the report as a CSV or text file.
-
-
Preview the report and save or print; examine the final output, add annotations and save as PDF, CSV or print out. Click Finish when done.
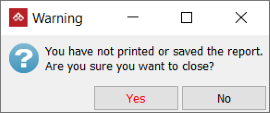
Note: If the results have not been saved or printed, you will be warned before exiting the tool.