Threshold
Source file: threshold-colour.htm
The Threshold tool enables you to highlight data with attributes above or below a specified value. This is useful for highlighting a specific change that is of interest. For example, data above or below a specific elevation can be coloured. The attribute used can be intensity, range, height, or another user-defined property.
-
If you have previously coloured an object by distance (see Distance from Objects), the Attribute list will also include Distance from objects.
-
Any user-defined attributes with integer-type tags will also be available on the Attribute list.
Follow these steps to apply threshold colouring:
- Select the object or data to be coloured.
-
On the Home tab, in the Colour group, click
 Threshold.
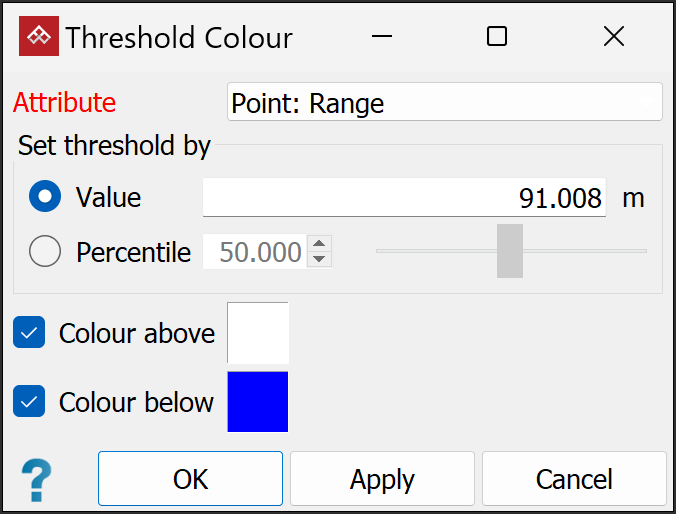
-
Select an attribute by which to colour from the Attribute drop-down list (Intensity, Range, or Z coordinate (height)).
-
Enter a Value or Percentile. If a single scan is selected, the Value field is automatically completed with a value denoting the 50th percentile.
- The Value option displays data above the entered range in one colour and below in another.
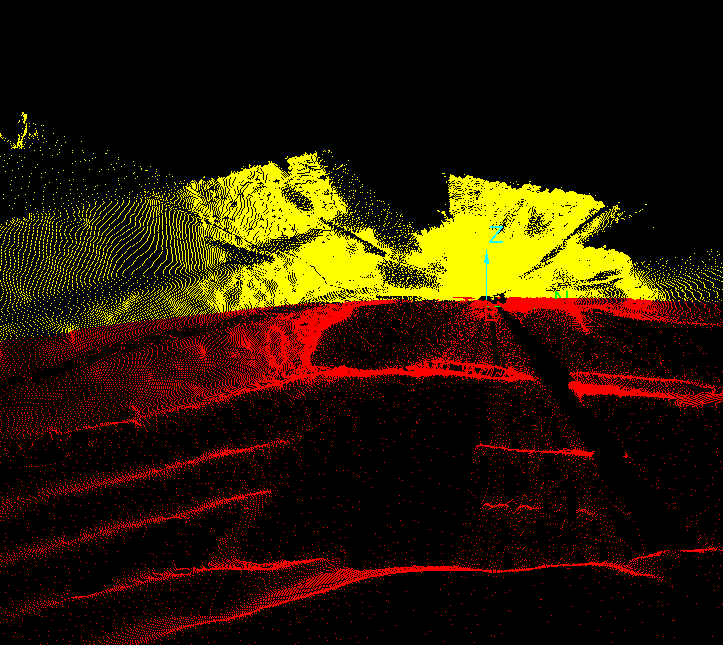
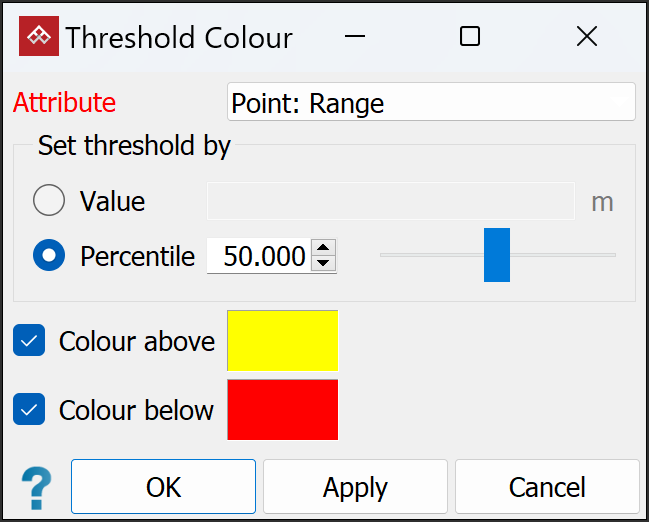
- When Percentile is selected, the percentage
of data points above and below the selected percentage is displayed in different colours. For
example, with the image below, the selected attribute was Range,
with a Percentile of
50. It shows that 50% of the scan points (in red) are closer to the scan origin point. -
(Optional) Choose to Colour above, Colour below, or both, then click in the colour boxes to select suitable colours.
Note: Only
the visible points are coloured. If the scan has been filtered, the invisible
points will remain unchanged. Click ![]() Show All from the Filter group of the Position and Filter tab to re-display filtered points.
Show All from the Filter group of the Position and Filter tab to re-display filtered points.
|
|
|
Example of Threshold Colour (left) with settings (right) |
|
