To obtain (query) the dip and strike
Dip and strike query displays the dip (angle of descent) and strike (angle of intersection with a horizontal plane, relative to north) of a feature.
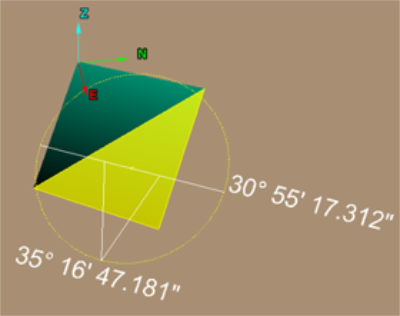
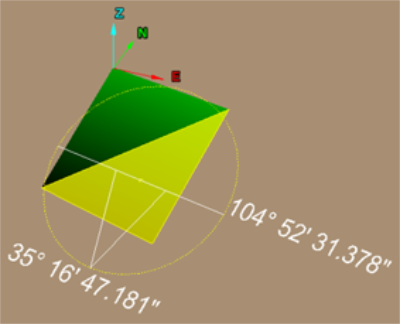
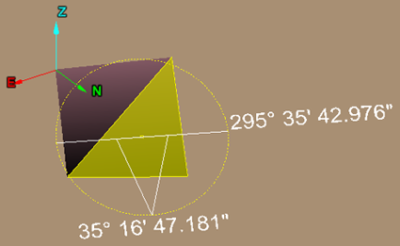
Samples showing various orientations of a single plane, with respect to North. The plane has only been twisted around the Z axis. Note the number on the right indicating Strike angle. The Dip angle remains constant.
Dip and Strike defined
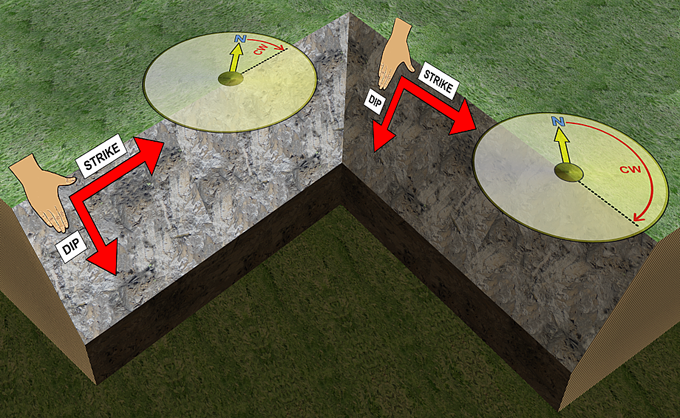
Dip and Strike has to be defined in order to ensure consistent results. Different methods are available for defining Dip and Strike. The approach used in this software is based on the 'American Right Hand Rule method'.
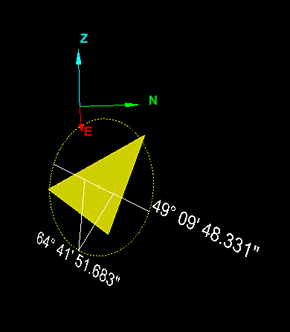
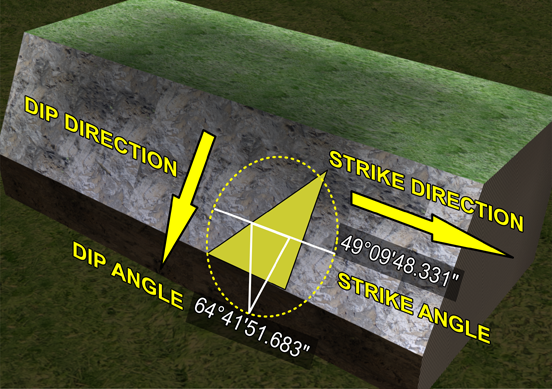
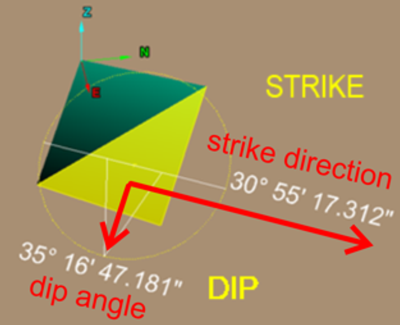
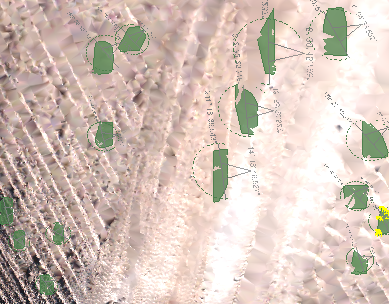
This software identifies Dip and Strike of sloping faces by highlighting segment(s) and drawing a yellow circle around these. A white horizontal line is also drawn with a 'V' shape pointing down in the direction of the Dip. The Strike angle (clockwise from North) is identified on the side of the circle in the direction of the Strike Direction. The Dip angle (down from horizontal) is specified at the bottom of the shape.
Steps to determine Dip and Strike
The basic approach is as follows:
-
Place right hand palm down.
-
Point the fingers down the slope. This is the Dip Direction. The Dip Direction is measured clockwise from the North direction.
-
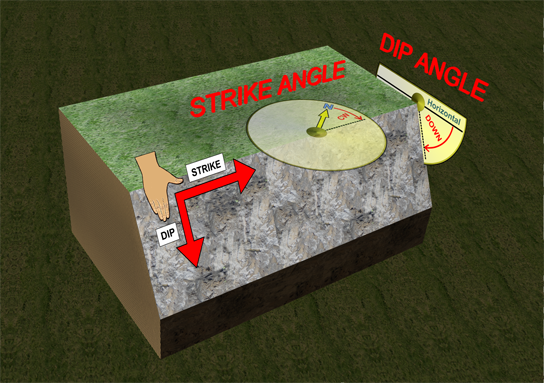
The right thumb will point in the direction of the Strike. The Strike angle is measured clockwise from the North direction.
A Strike angles for each face determined clockwise from North.
The Dip angle is the angle measured down from a horizontal line to the slope/dip line.

Example depicting the Dip and Strike along with elements showing the full derivation.
Steps to Query Dip and Strike
-
Select the primitives to be queried (points, edges, facets or cells).
-
From the Geotechnical ribbon tab navigate to the Dip and Strike group and select
 Query.
The dip and strike is calculated for the selections displayed on the screen.
- Click
the arrow (or Enter or Space)
to display the result in the Report
window.
Each query also creates a discontinuity object in the geotechnical container. - Continue selecting primitives to be measured.
- Click the
 to complete the operation.

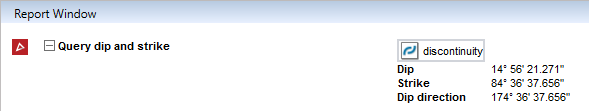
A
summary list of all queries is displayed in the Report
window.
The question mark opens the Help document and displays this article.
Example of what to expect in the Report Window
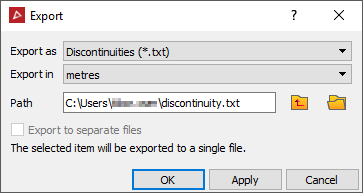
EXPORTING DISCONTINUITIES
Discontinuities can be exported as text files as follows:
-
Select the discontinuities to export
-
From the Home ribbon tab navigate to the Data group and select
 Export.
 -
The discontinuities can be grouped into one file, or exported to separate files.
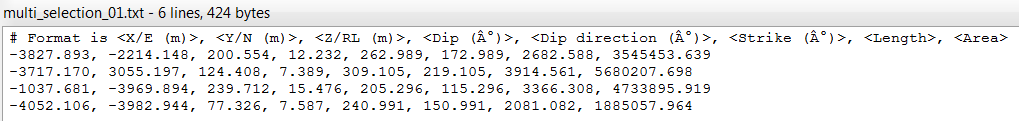
Resulting text file of group export.