Query Waviness
Source file: query-waviness.htm
Waviness in
discontinuity analyses is results from repeating features of flat and
steeper areas perpendicular to the slope in the dip direction (forming
a wavy pattern), and effectively providing greater resistance to sliding
than a completely flat, steep face. The Query
waviness tool provides a means of examining and quantifying the
roughness of a section of discontinuity, particularly with respect to
the waviness of the roughness. The process involves subdividing the section
into patches or cells of nominated sizes for a statistical analysis of waviness
plunge and trend, as well as overall discontinuity dip, dip direction
and strike. A series of cross sections through the region helps to visualise
and identify any wave-like patterns. The results can be saved in a PDF
document.
-
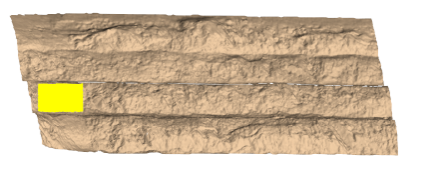
Select an area (using any suitable primitive) on a rock face surface for analysis.
-
On the Geotechnical ribbon tab, go to the Analyse group and select
 Query Waviness.
Check and adjust the settings you want to use.
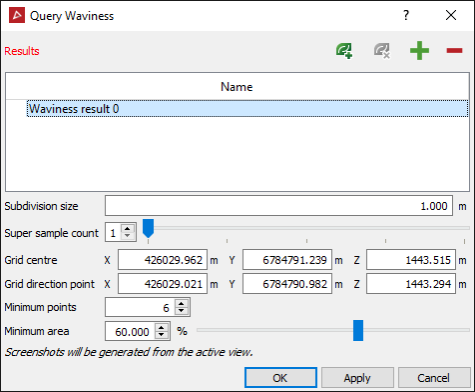
The following settings help to define the size and sensitivity of cells used to examine the variation of slope within the area of interest:
| Subdivision size | Nominate an appropriate size to divide the area into suitable cells for analysis. The smaller the size, the more sensitive the analysis. |
| Super sample count | A method to further refine analyses over the area. Extra subdivision cells are offset between the initial patches providing extra data. |
| Grid centre and Grid direction point | These identify the direction of slip and are usually auto-populated for a standard planar sliding case. For a wedge case, you can manipulate the line to coincide with the wedge centre line - which represents the direction of probable slip for a wedge block. |
| Minimum points | This figure specifies the minimum number of points required to make the individual plane in the cell. Otherwise the cell is ignored. |
| Minimum area | This figure specifies the minimum percentage of area required to make the individual (discontinuity) plane in the cell. Otherwise, if the resultant cell is smaller than this percentage, it is ignored. |
- Click
 to add any selected
areas to the Name list. As you
add the area of interest, the tool will generate images and display a
message. You can continue to add more areas, if desired. Use the minus symbol to remove entries.
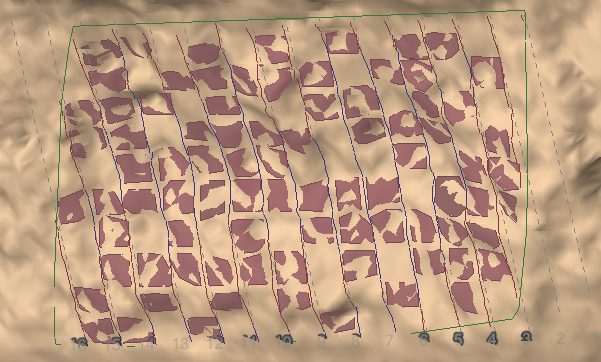
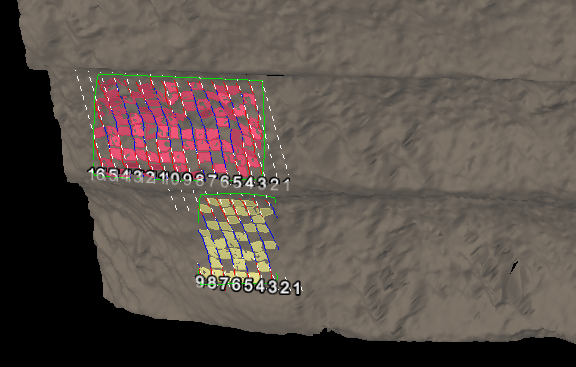
The remaining two symbols can be used for grouping areas into discontinuity
sets, or ungrouping them. Reports are produced for each area showing a
histogram and cross sections. These make up the content for saving to
PDF files if you choose. At this stage you can view the cells arranged
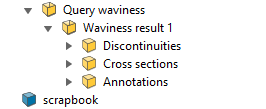
on the surface of the areas under investigation, in more detail. All objects
and elements making up the cell analyses are saved in the geotechnical
container.
to add any selected
areas to the Name list. As you
add the area of interest, the tool will generate images and display a
message. You can continue to add more areas, if desired. Use the minus symbol to remove entries.
The remaining two symbols can be used for grouping areas into discontinuity
sets, or ungrouping them. Reports are produced for each area showing a
histogram and cross sections. These make up the content for saving to
PDF files if you choose. At this stage you can view the cells arranged
on the surface of the areas under investigation, in more detail. All objects
and elements making up the cell analyses are saved in the geotechnical
container.
- If you want to create the waviness PDF reports, click OK or Apply to carry out the final step. Otherwise click Cancel to exit without creating PDF reports.
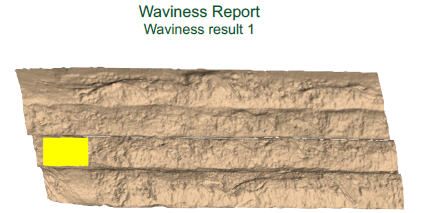
Waviness Report
The first
page of each Waviness Report identifies
the area on the rock face under investigation. The image is a screenshot
of the current view when you click the ![]() add button, but with a white background.
add button, but with a white background.
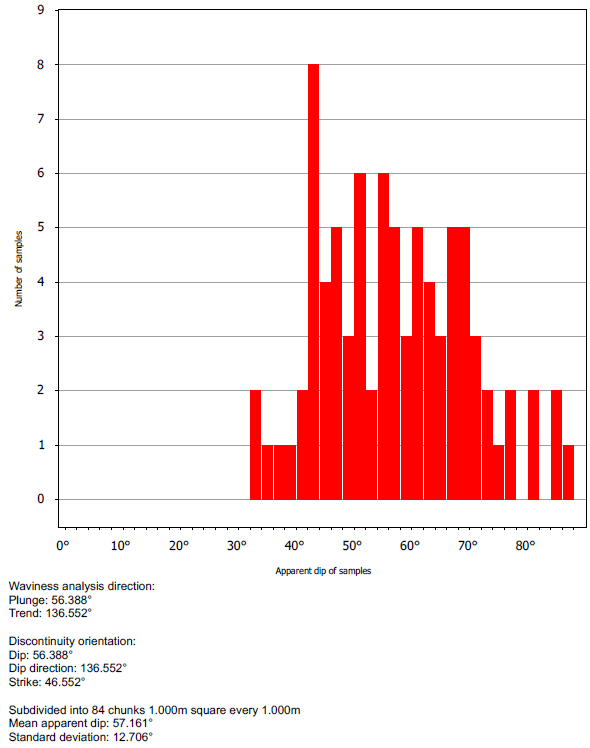
The second page presents a histogram of the apparent dip of the individual sampling cells used to break down the rock face under investigation. There is also a summary of statistical data drawn from the analysis.
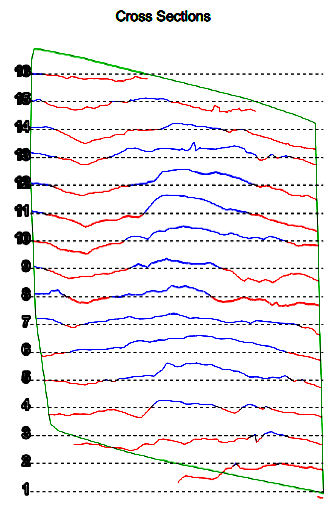
The third page displays cross sections which are taken vertically through the face and rotated left 90 degrees on paper, then displayed above and below each other in sequence from the original right to left (= top to bottom). The spacing of the cross sections is related to the subdivision size. The colour of the cross section line helps to identify whether the line is above (blue = further out) or below (red = closer in) the mean for that section.