Fragmentation Analysis
Source file: fragmentation-analysis-and-report.htm
Note: Fragmentation Analysands is an add-on that requires additional licensing, which may be obtained via your Maptek Account portal. Please see Licensing Applications in the Workbench help for details.
The Fragmentation Analysis tools enable you to analyse and report on blast fragmentation using automated rock size detection and analysis from muck pile scans.

|
|
Fragmentation Analysis Analyse sizes of rocks present in scans or point selections. |
|
|
Fragmentation Analysis Report Generate a rock size distribution report. |
Fragmentation Analysis
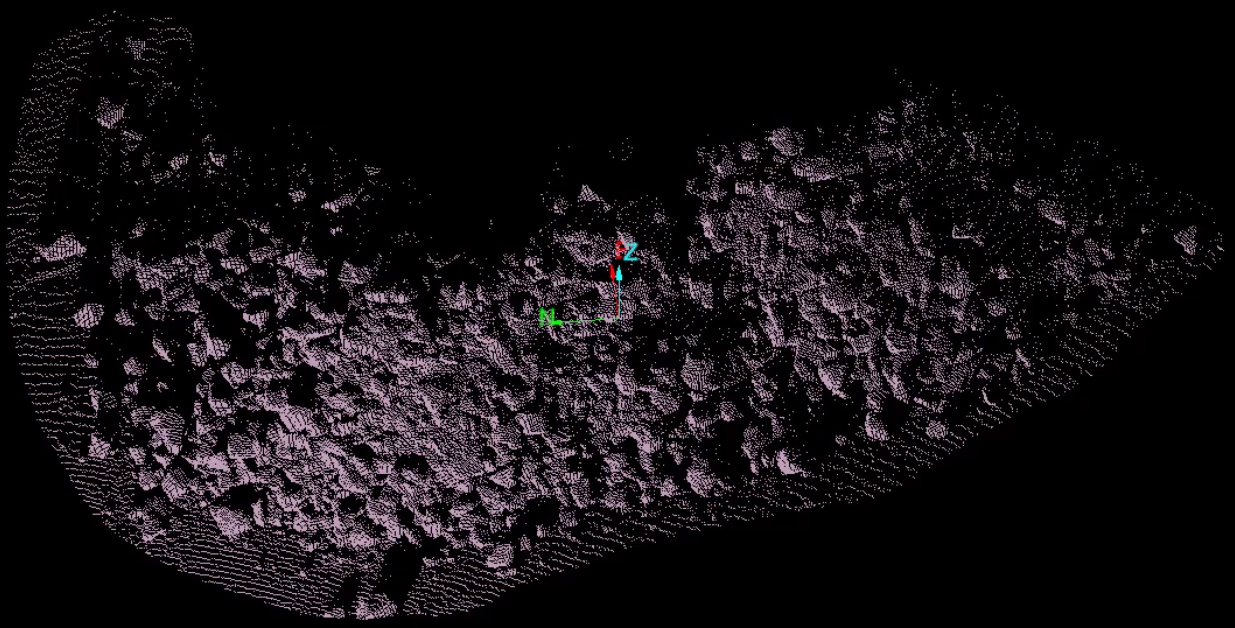
The Fragmentation Analysis tool breaks down a point set of a pile of rocks into individual rocks and fines.
Analyse fragmentation as follows:
-
Select the stock pile scan

 to be analysed.
 -
On the Query tab, in the Fragmentation Analysis group, click
 Fragmentation Analysis.
 -
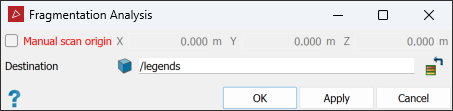
If the scan has no embedded scan origin, select Manual scan origin and pick a point in front of the dataset.
Note: Clear this option if only analysing a single scan. The tool will use the scan origin point.
Important: This option is required if there are multiple scans, or a non-scan point cloud to be analysed. Ensure that the selected origin point gives the best possible view into all voids between rocks.
-
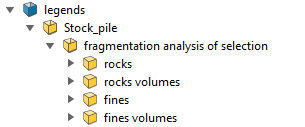
The default output destination is the
legendscontainer. To use a different output destination, drag that container into the Destination field. -
Click OK.
PointStudio analyses the fragmentations and stores the results in the destination container.
Note: Each time the tool performs an analysis it will create a new result set in the destination container.
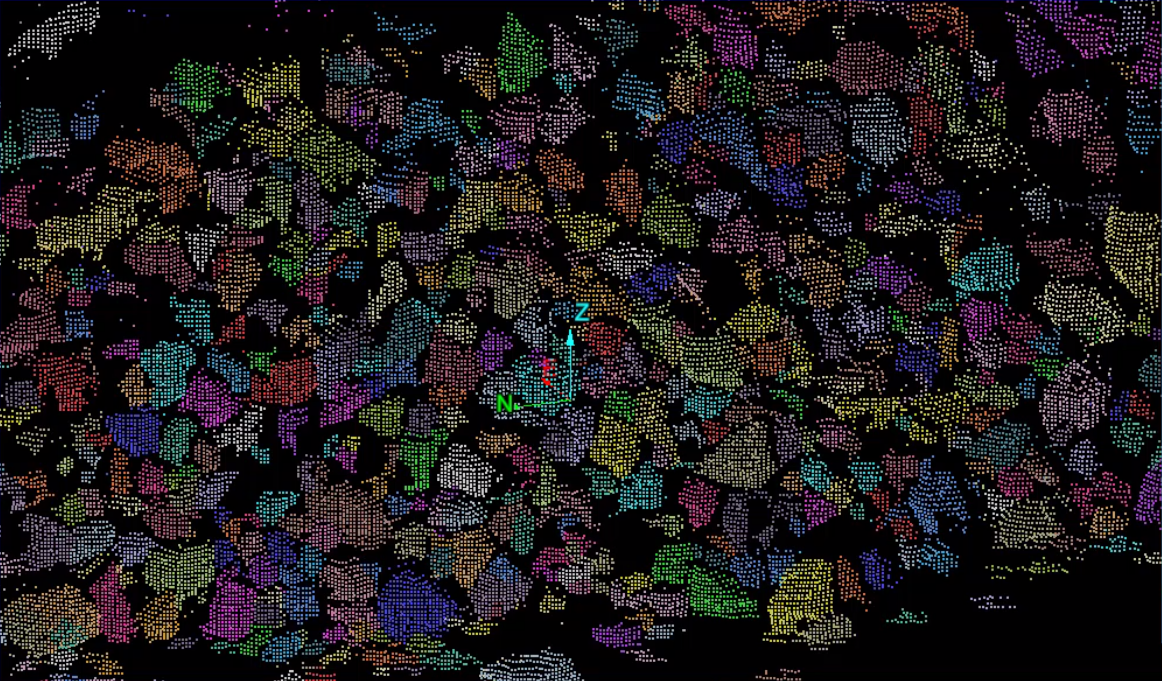
TipPress Ctrl+2 to randomly colour rocks according to size for a better visual representation.
-
Create a legend to suit the fragmentation analysis results. See Numeric Legend Editor. To determine the size range limits, measure a large and small sample rock in a view window, as below.
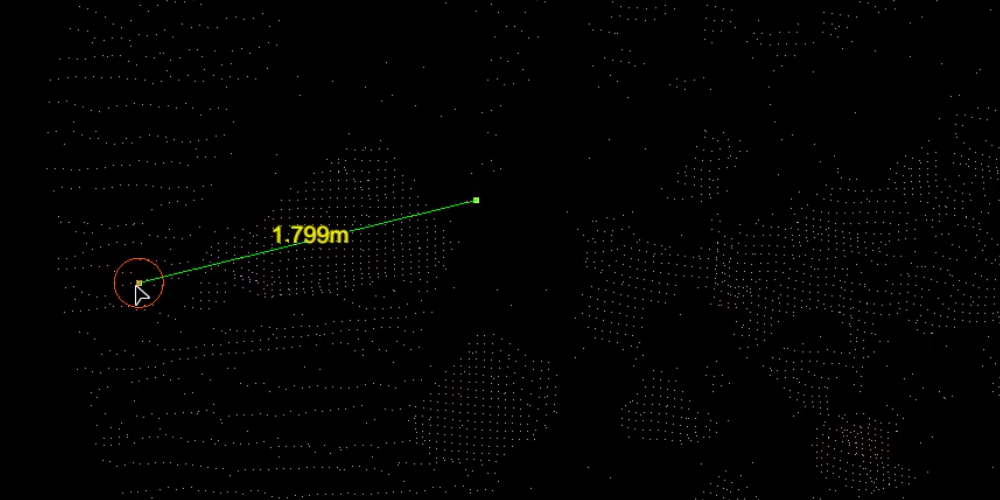
Find a large sample rock and measure its width to be used as an upper limit in creating a legend.
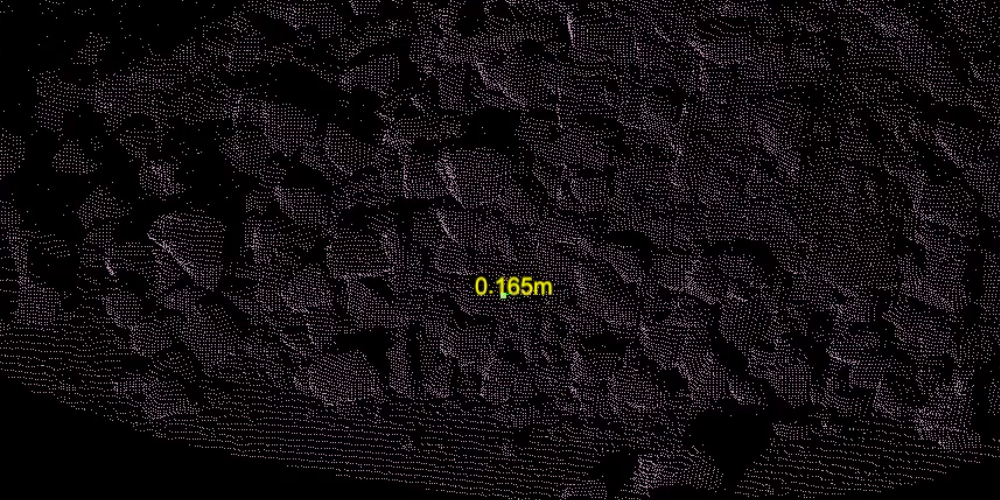
Find a small sample rock and measure its width to be used as a lower limit in creating a legend.
Fragmentation Analysis Report
The Fragmentation Analysis Report tool enables you to generate a report from the fragmentation analysis results, including images and graphs, that can then be exported to PDF or a CSV format.
To generate a fragmentation report, proceed as follows:
-
On the Query tab, in the Fragmentation Analysis group, click
 Fragmentation Analysis Report.
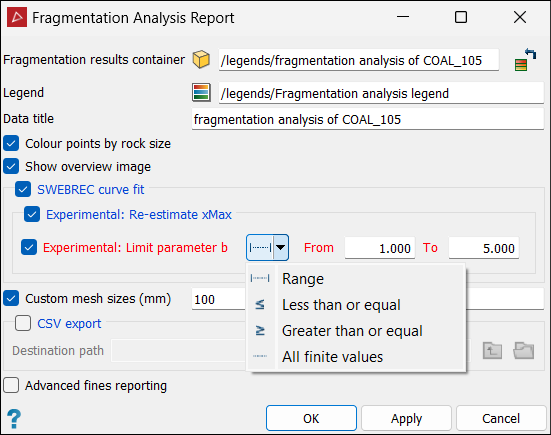
-
Drag the
fragmentation analysis of selectioncontainer into the Fragmentation results container field. -
For the Legend field, you can do either of the following:
-
Select the legend created above in the project explorer and it will be added to the Legend field.
-
Leave the field empty, in which case the report tool will generate a legend based on the range of data, using the spectrum colour scheme.
-
-
Select or clear the following options according to requirements:
-
If selected, Colour points by rock size will colour the rocks according to the legend scaling.
-
If selected, Show overview image will display a coloured representation of the selected area in the report.
-
-
(Optional) Select SWEBREC curve fit to display the fragmentation size distribution in a graph. Leave the Experimental: options cleared to use the standard SWEBREC formula.
Note: SWEBREC will only work if less than 50% of the analysed area consists of fines, and will work best at 25% or under.
If the SWEBREC curve is a poor fit to the data curve after generating the report, in some cases a better fit can be obtained using the experimental options, as below.
-
Select Experimental: Re-estimate xMax to re-estimate the size of the largest rock detected. This will also enable Experimental: Limit parameter b.
-
Select Experimental: Limit parameter b to constrain b, the curvature factor, of the SWEBREC curve. From the Limit parameter b drop-down list, select how to constrain b, then enter value limits.
Note: Use of these experimental options differs from the standard methodology for calculating SWEBREC parameters. The effects of these options should be confirmed by examining how well the generated SWEBREC fit (black line) follows the data (blue line).
-
-
(Optional) To report the percentage of rocks found that are smaller than a certain size, select Custom mesh sizes (mm) and enter a value.
-
(Optional) Select CSV export option if a CSV output is required, and assign the Destination path for the file.
-
(Optional) Select Advanced fines reporting to improve the accuracy of fines reporting.
Note: Advanced fines reporting uses a modelling algorithm that takes much longer to produce a more accurate result. If accurate fines reporting is not required, deselect to save processing time.
-
Click OK or Apply.
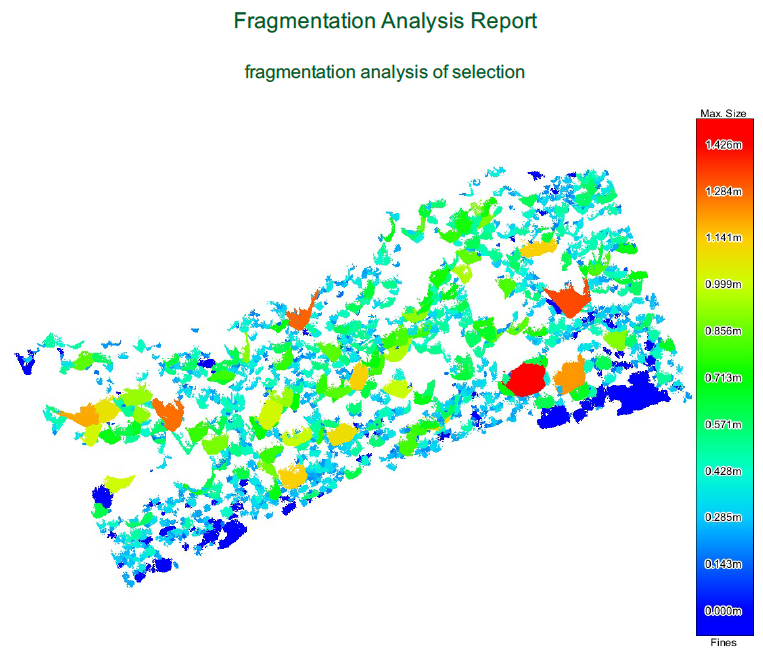
A report on the fragmentation analysis will be generated and displayed in a PDF view window.
|
|
|
A fragmentation analysis report (first page) graphically displaying the rock sizes and coloured according to the legend. |
|
|
|
A fragmentation analysis report (second page) that displays the details below, depending on options selected. |
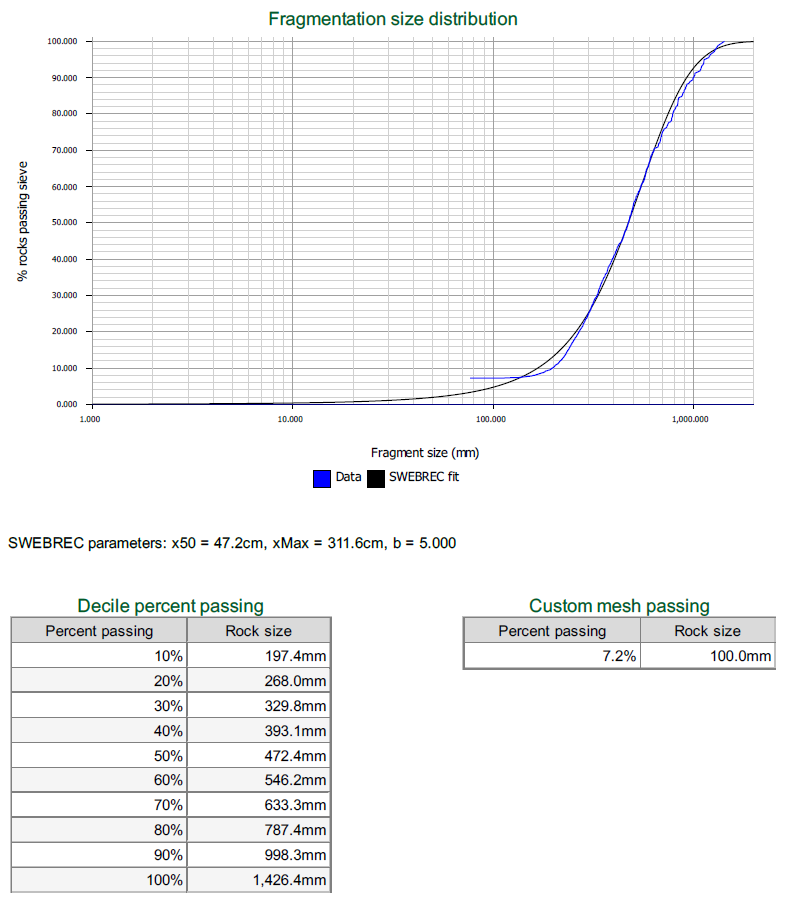
Reported fragmentation analysis details:
- Fragmentation size distribution as a SWEBREC curve fit graph and the parameters used for it.
- A Decile percent passing table showing the percentage of rock sizes found.
- A Custom mesh passing table showing the percentage of rocks that will pass through a custom mesh size.
The report can be downloaded by clicking ![]() or printed by clicking
or printed by clicking ![]() .
.
