Editing / Modelling a Fan Variogram
After an experimental fan variogram has been made, these options can be used to customise your settings and generate the model fan variogram.
Instructions
After an experimental fan variogram has been made, these options can be used to customise your settings and generate the model fan variogram.
To refresh the chart, click the ![]() icon in the upper right corner.
icon in the upper right corner.
Fan Settings
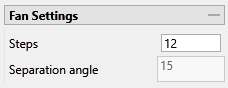
Enter the number of steps (or directions) into which the fan variogram will be divided. A variogram will be created for each step.
Note: This must be an even number. If you try to enter an odd number, the program will automatically round up to the next even number.
The separation angle is displayed automatically when the number of steps has been entered. It will show you the angle between each step.
Variogram Mode
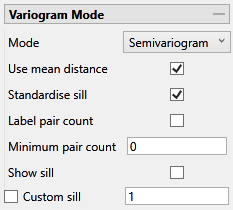
Mode
Note: The list of modes available for use depends on the type of variogram you are modelling. Depending on what type of variogram you are modelling, some of these modes might not be available.
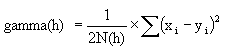
This is the standard semi variogram.
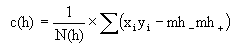
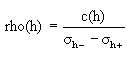
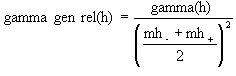
This is like the standard semi variogram, but divided by the mean of the data values.
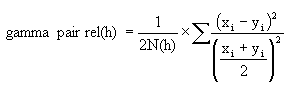
This is like the standard semi variogram, but each difference is divided by the mean of the sample values.
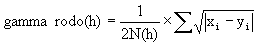
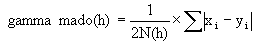
sqrt(Semivariogram) / Madogram
Transform data as 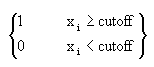 and compute the semivariogram
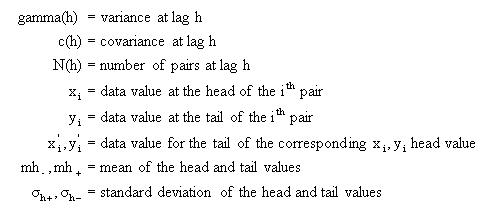
where:
You can adjust the remaining options in this section to your needs.
Use mean distance - Use the mean distance for the x coordinate of the variogram points.
Standardise sill - Select this check box if you want to standardise the variogram sill by dividing the results by the sample variance. This is useful when calculating a semivariogram because instead of reaching the sill at the sample variance it will reach it at 1.
Label pair count - Select this option to display the number of pairs used for each point on the graph.
Rotate pair count - This option displays when Label pair count is selected. Select this option to rotate the number labels of the pairs so that they are oriented 90 degrees upward.
Minimum pair count - Enter the lowest number of pairs that you want to be used to influence the variogram model.
Show sill - Select this option to show the sill.
Custom Sill - Select this option to enter your own value for the sill.
Fan Colour Scale - Use the drop-down list to change the colours used in the variogram.
-
Heat - The classic colours, default value.
-
Yellow to Red - The colours shift from white to yellow, then to red, and finally black. Colour blind friendly.
-
Greyscale - The colours shift from white to black. Colour blind friendly.
-
Blue Green Red - Discrete scale, values are split in three stages. Lower values are blue, mid values are green, and the higher values are red.
-
Greyscale Discrete - Discrete scale, values are split in three ranges using different grey colours. Colour blind friendly.
-
Contour - Draws the contours for different values of the fan. Uses the same colours and ranges as the Blue Green Red scale.
-
Greyscale Contour - Draws the contours for different values of the fan. Uses the same colours and ranges as the Greyscale Discrete scale. Colour blind friendly.
Constant Parameters
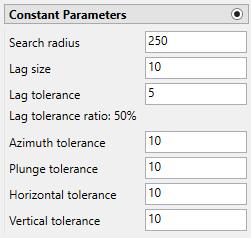
Constant Parameters allows you to use the same lag and tolerance parameters for all variograms. To set different lag and tolerance parameters for each variogram individually, see Directional Parameters below.
Search radius - The search radius should correspond to approximately half the distance of your data field. if the search radius is greater than the halfway point, then the search will over-extend the edge of the data.
Example: If the distance traversing your sample area is 500 feet, then set the search radius to 250 feet.
Lag size - The lag size is the search distance for each step from the origin. Set a lag size that coincides with your data spacing.
Example: If your samples are spaced 50 feet apart, then set your lag size to 50. If you have to err, do so on the side of too small.
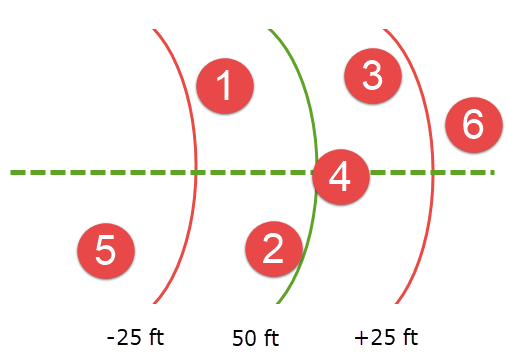
Lag tolerance - Enter the Cone tolerance settings. The tolerances are the angle limits between two samples and the centre line (range axis) of a variogram cone. Any two samples with an angle larger than this value are ignored.
Here, the dotted green line represents our search direction. The solid, curved green line represents a lag size (search distance) of 50 feet, and the red lines represent an area (lag tolerance) marking 25 feet on either side of our search distance. Samples 1, 2, 3, and 4 would be used in the calculation because they are located within the tolerance zone. However, samples 5 and 6 would be ignored.
Collectively, the azimuth tolerance, plunge tolerance, horizontal tolerance, and vertical tolerance are known as the Cone of Tolerance.
Lag tolerance ratio - This corresponds to the percentage of the lag size that is used by the lag tolerance.
Example: A lag size of 50 with a lag tolerance of 25 will result in a lag tolerance ratio of 50%.
Azimuth tolerance - The limit on the angle between two samples as measured in the plane of the plunge of the variogram.
Plunge tolerance - The limit on the angle between two samples as measured in a vertical plane in the direction of the azimuth.
Note: A combination of cone, azimuth and plunge tolerances is used if the azimuth angle tolerance and plunge angle tolerance are set to less than the cone angle tolerance.
Horizontal tolerance - The horizontal distance limit of sample pairs. Any acceptable sample must be within this horizontal distance from the centre of the variogram cone.
Tip: Set this value to a typical spacing (or larger) between your data, for example, if your data is on a 100 × 100 × 10 grid, set a horizontal distance of 100 and a vertical tolerance of 10. If you receive too few sample pairs, try increasing the tolerances to capture more data otherwise artefacts such as "hole effects" may occur.
Vertical tolerance - The vertical distance limit of sample pairs. Any acceptable sample must be within this vertical distance from the centre of the variogram cone. The vertical distance is measured from the plane of the plunge of the variogram cone.
Using too large of a cone can result in excessive mixing of samples from different directions. This can cause the apparent anisotropy to appear smaller than the true anisotropy.
Using too small a cone can result in rough variograms that are hard to interpret. The sample cone may be too small if the number of sample pairs for most lags is small compared to the number of sample points.
Note: For an omnidirectional variogram, use 90 for the azimuth tolerance and 90 for the cone angle tolerance.
Note: To disable the limit, set it to 90 degrees.
Note: If this is set to 0, then the tolerance is not used.
Directional Parameters
Directional Parameters allows you to set different lag and tolerance parameters for each variogram individually. To use the same lag and tolerance parameters for all variograms, see Constant Parameters above.
Click on the 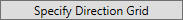 button to bring up the Variogram Directions input table.
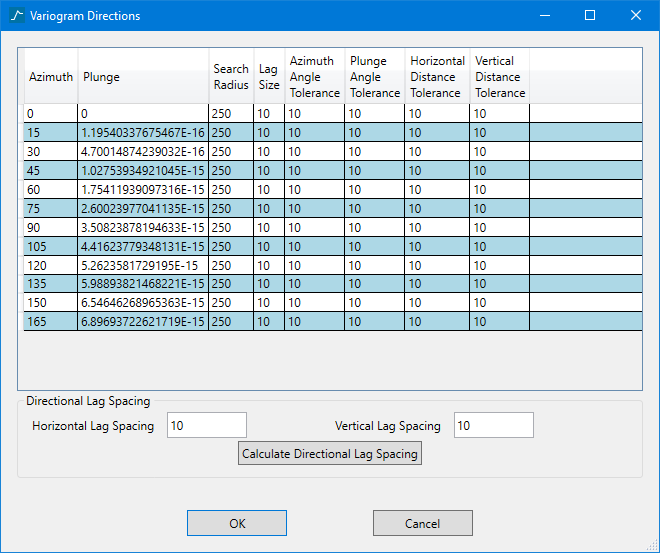
Editing table parameters
-
The table at the top is where the variogram parameters are entered.
-
Entering information into the cells and then pressing ENTER generates another row.
-
Highlighting one or more rows and pressing DELETE will delete the row(s).
-
If you do not wish to view the cones in Vulcan, click OK to accept and close the window.
Unfolding
The unfolding option is used in the case of deformed strata bound deposits. This can be applied to deposits where mineralisation is controlled by a structural surface that can be modelled. The specification file from a Grid Model is used.
Backtransform Normal Score
This option simulates the back transformation of the current variogram into the real variable, which is usually easier to model.
Down Hole
It is common practice to calculate a down hole variogram to acquire a nugget, and then use that nugget value while calculating a standard variogram.
Depth field - Set this to reflect which variable in the dataset corresponds to the depth field.
View Cones in Vulcan
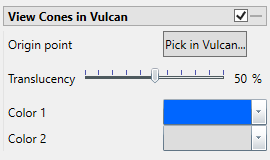
You can visualise the search ellipses by enabling the option to View Cones in Vulcan, or by clicking Display Cones from the Connectivity tab in the ribbon. The cones are interactive, therefore, any changes made in the variogram parameters will be automatically reflected in the cones seen in Vulcan.
Steps
-
Click the button labelled Pick in Vulcan.
-
In the Envisage workspace, click where you want the origin of the cones to be displayed.
-
Use the slider to adjust the Translucency of the cones.
-
Set the colours for the cone by clicking on Colour 1 and Colour 2, then selecting a colour from the palette.
-
To remove a the cone from the screen, disable the View Cones in Vulcan checkbox.
After you have set the parameters for a cone, it can be displayed using the icons found on the Connectivity tab on the ribbon.
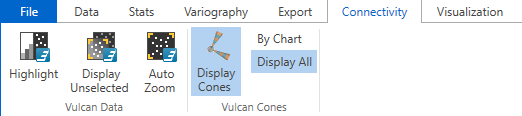
Click Display Cones, then select either By Chart or Display All.
By Chart - Only the charts that have the View Cones in Vulcan option enabled will be displayed.
Display All - All cones will be displayed regardless of whether or not the View Cones in Vulcan option has been enabled.
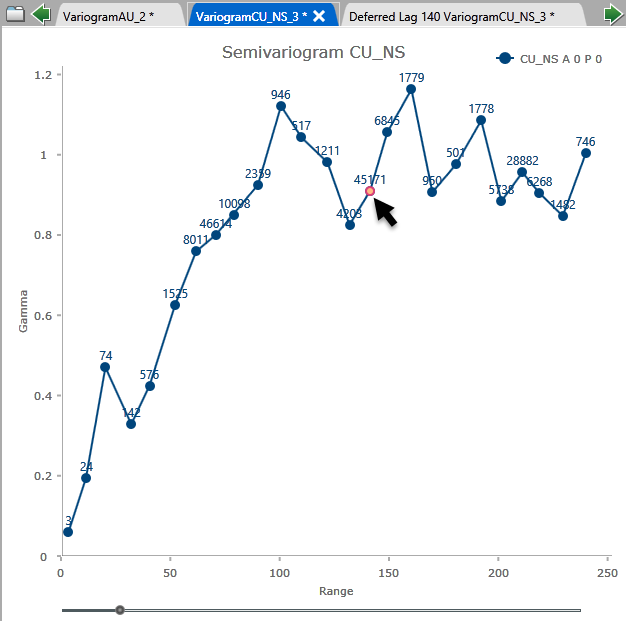
Create Deferred Scattered
Use this option to visualise the distribution of your data at each point.
Each variogram point is the average of a collection of points that have a distance (h) from the origin point. Therefore, each variogram point can generate a correlation between the origin point and the others inside the indicated neighbourhood.
-
Select a point from the variogram.
-
Click the Create Deferred Scatter button to create the chart.
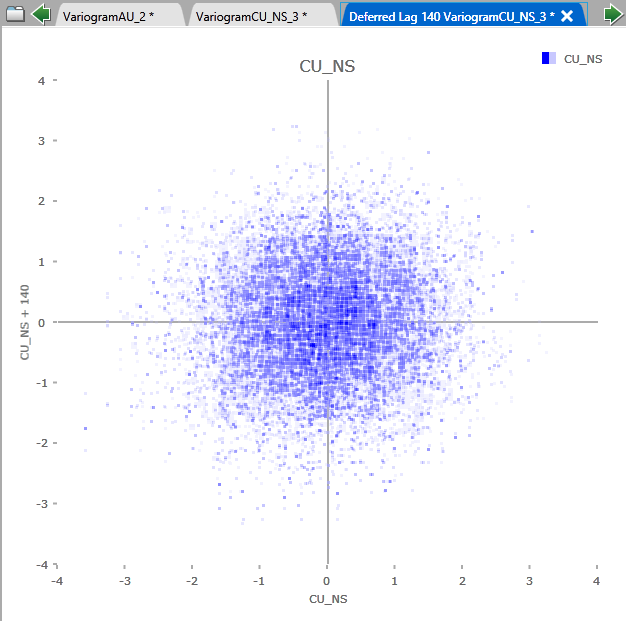
Chart Settings Tab
This tab contains the parameters for customising the look of the charts.
Annotations and legends
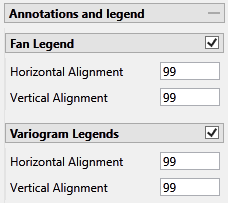
By default, the legends are automatically displayed. If you do not want to see the legend simply uncheck the checkbox in the upper right corner.
Horizontal and Vertical Alignment - Position the chart legend by left-clicking on it with your mouse and dragging it to the desired location. It is also possible to position the legends by typing in a number between 0 and 100 into the textbox.
Data
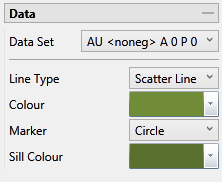
Data Set - The current data set that is being display on the chart is listed, showing the azimuth and plunge angle.
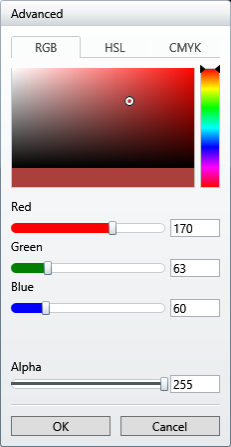
Line Type, Colour, and Marker - Click the arrow to display the colour palette, then select a colour.
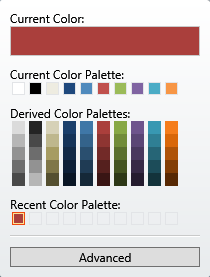
Clicking the Advanced button will bring up a dialog which will allow you to customise the colour to you exact specifications.
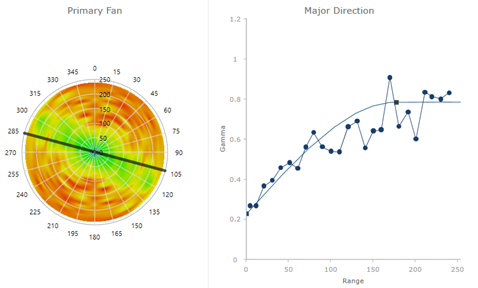
A separate colour for each variogram
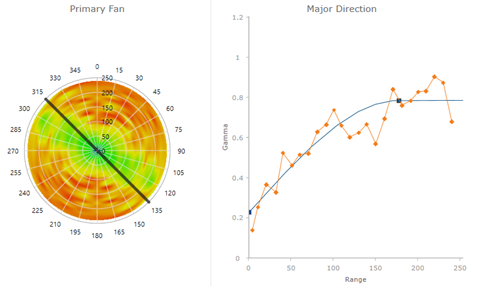
It is possible to select a separate colour for each variogram by selecting the data set from the drop-down list in Data Set, then selecting the colours and marker style. As you rotate the through the various angles of the Primary fan on the left using the angle selector, the variogram chart on the right will reflect the changes in colour.
Fan Axes
Decimal places - Enter the number of decimal places you want to be displayed in the fan numbers. This will only effect the display and not the variables themselves.
Colour Scale - See above.
Auto fit - Select this option if you want Vulcan Data Analyser to apply an autofit for you.
Minimum and Maximum gamma and range - You can use customised gamma and range entries to help make certain features stand out. Recall that gamma is represented on the standard variogram chart as the Y axis and the range is represented as the X axis. Begin by using the max gamma and range seen on the chart, then adjust slightly to bring out the contrast in colours.
Auto Interval - By default, the interval is set at four, but it can be adjusted to preference.
Axes
All axes controls share the same type of parameters, although only the Major Axes parameter control is shown here.
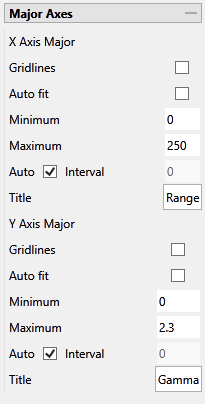
Gridlines - Select this option to display the gridlines at major intervals on the chart. You can elect to display gridlines for both axes or just one, depending on your needs.
Auto fit - Select this option if you want Vulcan Data Analyser to set the parameters for you automatically.
Minimum and Maximum Axes - If you want to customise the axes you may enter the minimum and maximum X and Y axes extents. The same is true for the intervals along the axes.
Auto Interval - By default, the axes intervals are set automatically based on the data. However, you may elect to set these based on your needs. To do so, simply deselect the checkbox and enter the new interval into the textbox.
Titles - By default, Range is the title given to the X axis and Gamma is the title given to the Y axis. However, you may change these if you wish.
Chart Layout
Use the slider control or click the arrows to adjust the size proportion of the fan chart width compared to the standard chart width.
Model tab - Contains all the parameters for setting up the sill, nugget, and any structures you wish to model.

