Geostatistical Modelling
Grade Interpolation - Kriging
The final step of an ore reserve estimation method is the grade attribute assignment and interpolation method. In geostatistical terms Kriging is considered as the most unbiased estimator, it is a process of finding optimal weighting factors for sample grades used in reserve estimation.
- Process of Kriging
- Kriging and Influence of Variographic Parameters
- Influence of Nugget Effect
- Influence of the Range of Variogram
- Influence of the Sill
- Influence of Anisotropy
- Conditional Bias in Kriging
- Krige's Smoothing Effect
Process of Kriging
Considering the fact that the samples closer to the centre of the block provide more information than those further away from it, the mathematical average of samples extended to the block may not be appropriate.
A more robust method of estimation is required to linearly combine the samples according to their distances. The estimator which satisfies these properties is called "Kriging" and is known as "BLUE", Best Linear Unbiased Estimator. The condition of unbiasedness introduced into a kriging system requires us to satisfy the assumption of intrinsic hypothesis or second order stationarity, where the orebody values do not present any drift. It should, however, be noted that in some circumstances, although no overall drift is present, the actual grade of ore varies significantly from one area to another, in which case application of the above kriging system although unbiased over the deposit can still have conditional biases in various grade categories, mainly due to some regression effect. This can be eliminated by introducing the mean grade of local areas into the kriging system. The kriging variance obtained by application of "kriging with known mean" is generally lower than that achieved by the use of "kriging with unknown mean".
Kriging and Influence of Variographic Parameters
The kriging variance and weighting configurations depend only on the structural model and the relative position of samples to one another and to the block, but not on the particular values of the data points.
The effect of the structural model or variographic parameters on the kriging system for a transitive variogram or spherical scheme model can be defined as follows:
Influence of the Nugget Effect
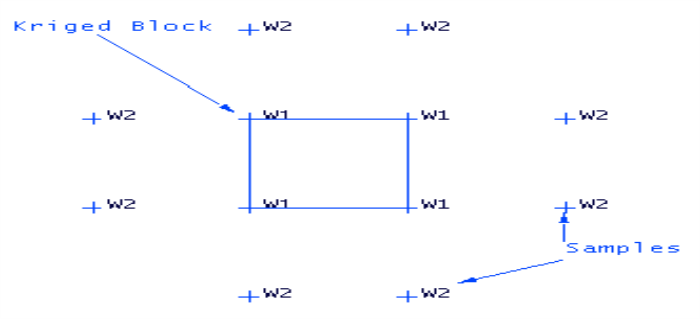
Consider a situation where a block of ore is to be estimated using 12 samples surrounding the block.
When there is no nugget effect, the weights associated with the closest samples to the block are greatest. The corner samples screen the panel from the influence of the exterior samples (that is, Screen Effect). The influence of more distant samples is therefore significantly reduced by the screen, this has the effect of virtually assigning the grade of the panel to the weighted grade of the four corner assays. In these circumstances, a considerable saving is achieved in kriging calculation by considering only the assays in or at the edge of the panel.
As the nugget effect increases, it has the effect of breaking up the screen, increasing the influence of exterior samples reducing the weighting to the samples close to the block. In more extreme cases where the variogram is characterised by a pure nugget effect, the best value that can be assigned to the panel is the mean value of all the samples that is, or the weighting coefficients assigned to individual samples will be equal.
Fig. 22a,b and the table illustrates the effect of increasing nugget value on weighting coefficient. The variogram assumed in this case is a spherical scheme model with a large range of influence. The symmetry of the samples relative to the panel reduces the number of coefficients to be determined to only two.
Influence of the Range of Variogram
Range of influence in spherical scheme models plays an important role in the estimation of block values. The greater the range, the greater is the distance in which the samples are correlated. The range of the variogram has a direct effect on the weighting coefficients assigned to each sample. If the range is short then the influence of assays near the block will decrease more quickly, hence samples close to the block will receive much more pronounced weight. As the range increases the weighting of the samples close to the block decreases.
| Nugget/Sill Ratio | Weighting (W1) | Weighting (W2) |
| 10 000 | 0.2010 | 0.0245 |
| 20 000 | 0.1646 | 0.0427 |
| 30 000 | 0.1415 | 0.0542 |
| 40 000 | 0.1255 | 0.0623 |
| 50 000 | 0.1138 | 0.0681 |
| 60 000 | 0.1048 | 0.0726 |
| 70 000 | 0.0977 | 0.0761 |
| 80 000 | 0.0920 | 0.0790 |
| 90 000 | 0.0873 | 0.0413 |
| 100 000 | 0.0834 | 0.0434 |
Figure 22a - Variation of Kriging Weights with Nugget/Sill Ratio
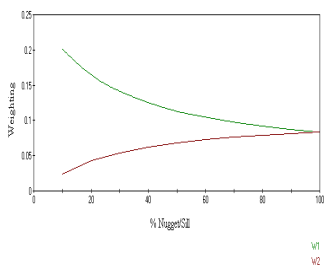
Figure 22b - Variation of Kriging Weights with Nugget/Sill Ratio
Influence of the Sill
The direct influence of the sill value in the Kriging system is only on the Kriging variance. However, the Kriging coefficients are affected by the ratio of the nugget over the sill value, that is, by Co/C. If the sill value is decreased the effect is as if the nugget value has increased and vice versa.
Influence of Anisotropy
Definition and type of anisotropies have been discussed in previous sections. The most common type of anisotropy is the geometrical anisotropy where the range of variograms in different directions are not identical. To correct for this type of anisotropy one has to stretch the sample distances in the direction of the shorter range by an isotropic ratio so that the two directional variograms will coincide. The effect of this type of transformation is to place samples which are in the direction of the shorter range further away from the block and reduce their influence.
Conditional Bias in Kriging
From a mine planning and production point of view, an estimation method is good if the predicted tonnes and grades, on average, reconcile well with the actual production. And of course, more often they do not. The Kriged grade of a block is said to be conditionally unbiased if and only if the expected distribution of point assays in the block and the estimates are normal. In most circumstances however, due to the lack of the presence of a normal distribution, the performance of ordinary Kriging (that is, Kriging with unknown mean) will result in conditional bias, where over-estimation of low values and under-estimation of high values occurs. The severity of the problem is linked to the degree of skewness in the assay distribution. This was identified by Krige 25 years ago, but was frequently ignored. Attempts were made to relate the problem to a simple dilution problem with a constant correction factor applied. Often this is also taken as an excuse to upgrade the low grade samples.
Krige in his exercise compared the true block values with Kriged block values based on sixty peripheral samples per block (Table 1) and determined the percent over or under-estimation of blocks for different categories of grade concentration ranges. In statistical theory this differential factor is the element resulting from regression of block values vs sample values. If the distribution of blocks and samples are normal, the regression line is a straight 45 degree line. However if they are log-normally distributed, the regression line will be represented by:
block value = a + b estimate
where a and b are constants.
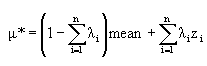
A serious drawback for implementing these solutions is that they require the knowledge of some real block grades. The solution to this problem was followed by obtaining some bulk sample information and derivation and projection of a correction factor or in other circumstances, substantial amount of information from blast hole information could give a good approximation of true block grades to be compared to the estimated block grade. However, when only sample values are available the question is how can the corrections be evaluated. The solution suggested by Krige is to incorporate the mean of the deposit into the Kriging system, a method of estimation named as Kriging with known mean. This has been briefly discussed in a previous section, where the estimated grade of a block *, with an optimal weighting configuration, is obtained without placing a constraint on the weighting coefficients:
Follow-up work carried out by M David has resulted in interesting achievements to further and further reduce the amount of bias introduced in the estimation process. Tables 2, 3 and 4 summarise the results of some of his work. In all cases the Kriging with known mean has produced superior results.
Table 2 - Krige's original example
Showing the joint distribution of means of 60 samples values per block and the true mean of block.
Table 2, 3, 4
Krige's Smoothing Effect
There is an unavoidable smoothing effect associated with the Kriging technique, in that as stated before, over-estimation of low grades and under-estimation of high grades may occur with deposits of positive skewed distribution (the opposite of this, under-estimation of low grades and over-estimation of high grades can also occur with variables of negative skewed distribution). As such the block Kriged values are less variable than the true block grades, although the mean of the distributions in both cases coincide.
The amount of smoothing increases as the mean of the local Kriging variance increases. This smoothing effect means that the histogram of the Kriged values displays more values around the mean but fewer extreme values.

