Kriging Neighborhood Analysis (KNA)
This tool provides a process for optimising parameters for block size, number of samples, and search radius to perform an estimate.
On the Block menu, point to Grade Estimation, then click Kriging Neighborhood Analysis.
The process of running the Kriging Neighborhood Analysis can be divided into two stages.
-
Define which data to use
This includes:
-
Setting up a Specification file
-
Selecting a Samples Database
-
Filtering the data
-
Making your Block Selection
-
Defining where to store the Output results
-
-
Define the parameters for optimisation
The optimisation analyses are meant to be run in order.
-
Find the best block size to use in your block model
-
Determine the optimal number of samples to use when estimating a block
-
Find the best search radius to use when looking for samples
-
Determine if any discretisation steps would be beneficial
-
When you have completed these optimisation analyses, you have the option of running an estimation using the optimised parameters.
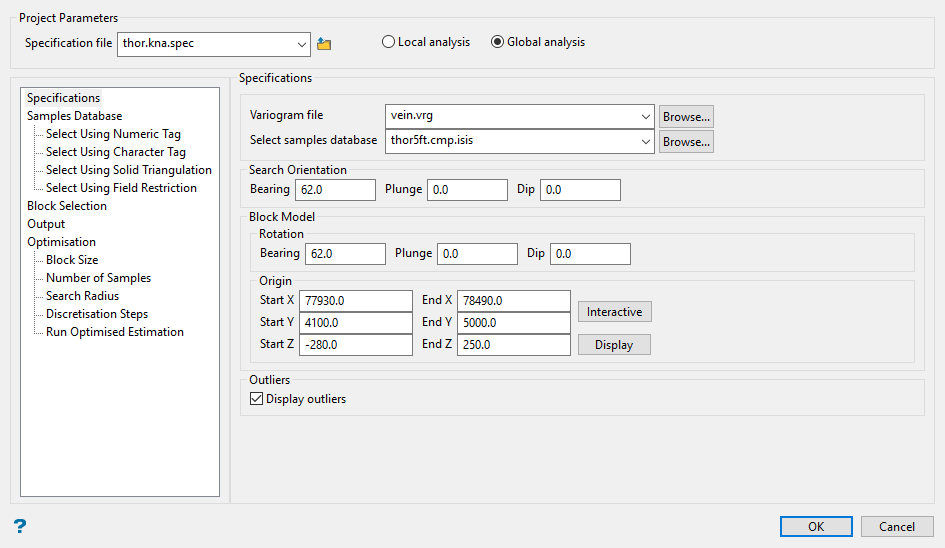
Specifications
Follow these steps:
-
Select the specification file from the drop-down list, or click the Browse
 icon to search for one that is not located in your current working directory.
 To create a new specification file, enter the name without adding the file extension (
.kna.spec). -
Select the type of analysis you wish to perform.
Local analysis - This option provides an optimal search strategy locally (only for a sector).
Note: Local analysis will create one block model with one block per step.
Global analysis - This option provides an optimal search strategy globally (considering the whole area of the drilling).
Note: This option could take a long time to process if you create a large block model with small block sizes.
-
Select the Variogram file (
.vrg). This is a mandatory field. -
Select samples database. This is a mandatory field.
-
Enter the values for the Search Orientation.
-
Enter the Block Model Rotation values.
-
Enter the Origin values for the block model.
Important: The difference between the end and start values cannot be equal to or lower than zero.
-
Click Display outliers to display the bounding box created by the starting and ending coordinates.
Note: This option is only available when using Global analysis. It is not available when using Local analysis.
The origin corresponds to the centroid of the block. You can enter the values manually or use the Interactive button to select the point from Vulcan.
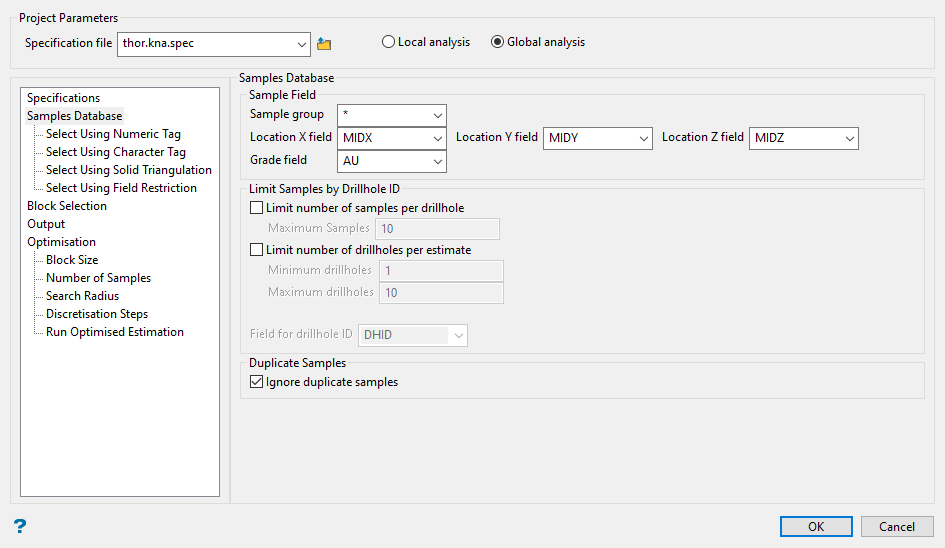
Samples Database
Follow these steps:
-
Set up the Sample Field by selecting a Sample group using the drop-down list.
Tip: Use a * (wildcard) to include all samples.
-
Select the location of the X Y Z fields.
-
Define the Grade field.
-
Enable Limit number of samples per drillhole if you wish to use a maximum number of samples allowed for each drillhole. (Optional)
-
Enable Limit number of drillholes per estimate if you wish to use a maximum number of samples for each estimation. (Optional)
-
Identify the Field for drillhole ID by selecting from the drop-down list.
-
Enable Ignore duplicate samples if you want to place restrictions on using a sample more than once.
-
If selected, the process will not discard any samples, but use all samples in the estimation.
-
If not selected, the process will stop and a message will notify you that duplicate samples were found.
-
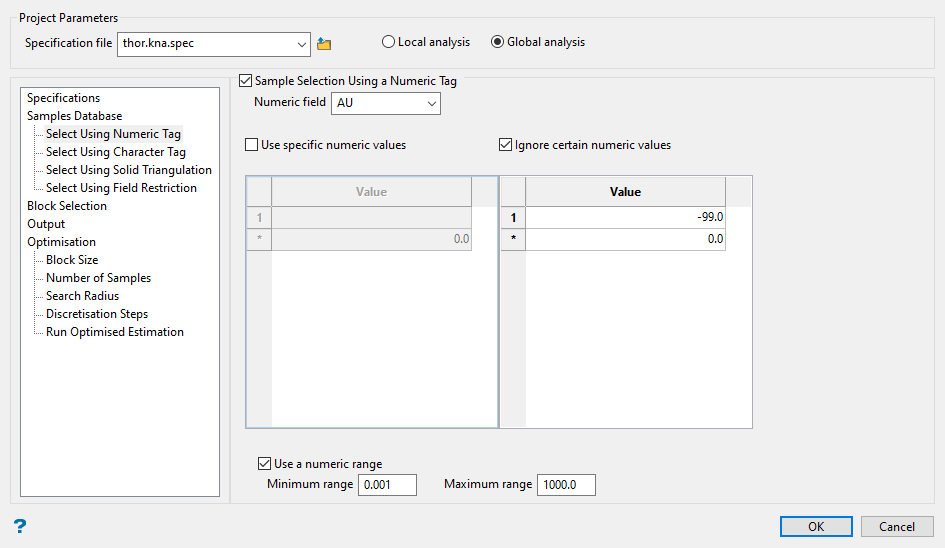
Select Using Numeric Tag
Follow these steps:
-
Enable Sample Selection Using a Numeric Tag to apply numeric restrictions to any field you select from the Numeric Field drop-down list. Only numeric fields will be shown in the drop-down list.
-
Enable Use specific numeric values to list the only values that will be allowed. Enter a numeric value into the Value field. You can enter one value per row, but may include as many rows as you need.
-
Enable Ignore certain numeric values to list the values that will be ignored. Enter a numeric value into the Value field. You can enter one value per row, but may include as many rows as you need.
-
Enable Use a numeric range to create a set of values. Enter a Minimum and Maximum value. The values entered will be included in the set.
Important: You can use specific values, ignore certain values, use a range of values, or a combination of two or more options together. However, a sample must meet all conditions to be used in the analysis.
Select Using Character Tag

Follow these steps:
-
Enable Sample Selection Using a Character Tag to apply character restrictions to any field you select from the Character Field drop-down list. Only character fields will be shown in the drop-down list.
-
Enable Use specific character values to list the only values that will be allowed. Enter the string without quotation marks into the Value field. You may include as many strings as you need.
-
Enable Ignore certain character values to list the values that will be ignored. Enter the string without quotation marks into the Value field. You may include as many strings as you need.
Important: You can use specific strings, ignore certain strings, or both options together. However, a sample must meet all conditions to be used in the analysis. The text strings are case sensitive and must be entered exactly as they will be found in the database.
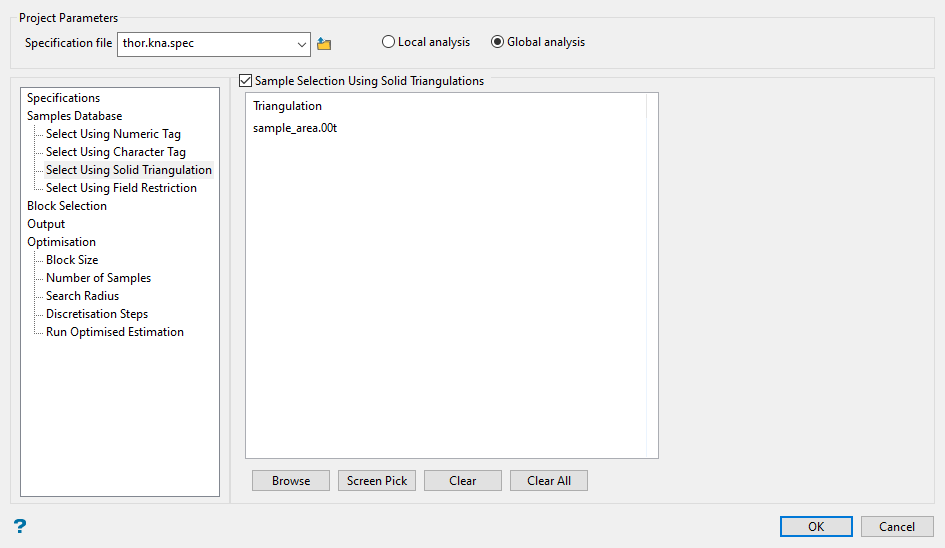
Select Using Solid Triangulation
Follow these steps:
-
Enable Sample Selection Using Solid Triangulations to limit samples by solid triangulation boundaries.
-
Select one or more solid triangulations.
-
Click the Browse button to search for any triangulation not found in your current working directory.
-
Click Screen Pick to select solid triangulations from the screen.
-
Click Clear to remove the highlighted items from the selection list.
-
Click Clear All to remove all items from the list.
-
Select Using Field Restrictions
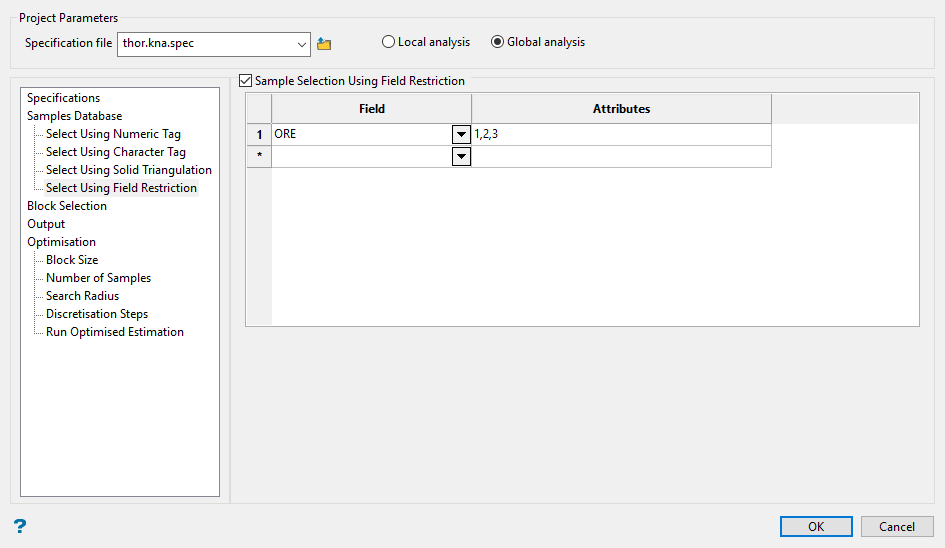
Follow these steps:
-
Enable Sample Selection Using Field Restriction to limit the samples to those with fields that match certain selection criteria. Select a Field from the drop-down list and enter applicable selection criteria in the Attributes column. (See Appendices > Operators and Functions)

Include spaces in the entries in the Attributes column only if spaces are included in the desired field values.
When entering a range, always enter the smallest number specified before the largest number.
-792&-720since-792is smaller than-720. This range is evaluated as-792.0 ≤ VALUE < -720.0.Note: The selection methods accumulate, that is if more than one method is chosen, then the samples must satisfy each selected method before being included. Within a method, however, selection is based on the OR selection criterion except for field restrictions, which allows AND/OR selection criteria.
Block Selection
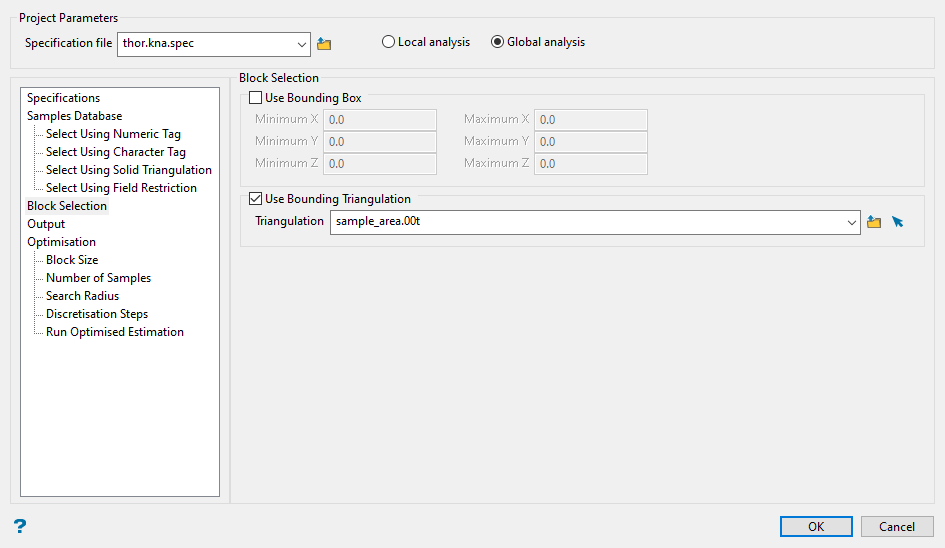
Follow these steps:
-
Enable Use Bounding Box to restrict the blocks by a box. If you select this option, you must enter the minimum and maximum coordinates for X, Y, and Z in the block model coordinates (X, Y, Z CENTRE).
-
If the block model origin is set at 0,0,0, then real world coordinates should be entered in the X, Y, Z minimum and maximum coordinates.
-
If the block model origin is set at real world coordinates, then enter coordinates for the bounding box that are offset a certain distance from the origin. The distance of offset will be determined by the dimensions of your bounding box. It will be the distance to the minimum and the distance to the maximum X, Y and Z from the origin of the block model.
-
-
Enable Use Bounding Triangulation to restrict the blocks by a triangulation. This is useful when, for example, you want to evaluate reserves within a particular solid triangulation such as a stope.
Note: This option is not applicable to open or surface triangulations
Output
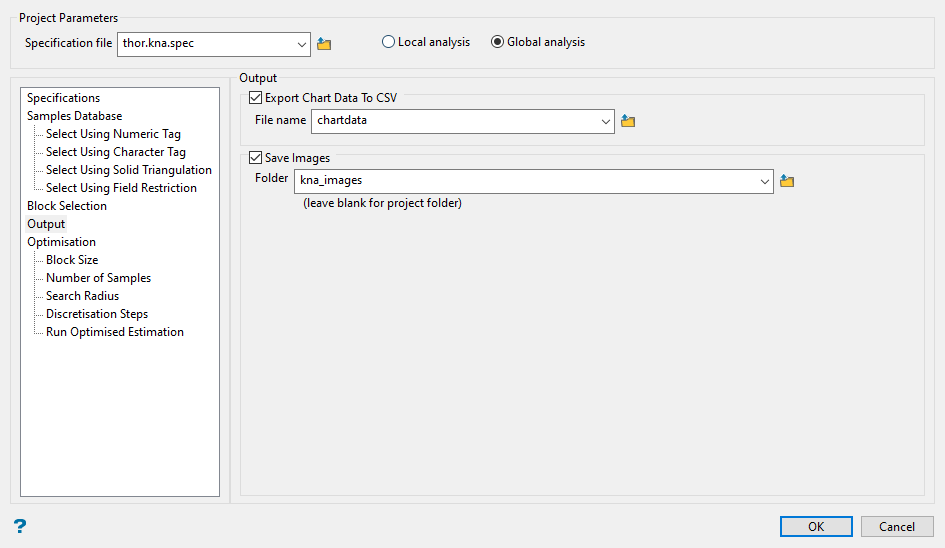
Follow these steps:
-
Enable Export Chart Data To CSV, then enter a file name. (Optional)
-
Enable Save Images, then enter or select a destination folder. You can select a folder from the drop-down list, click the Browse
icon to search for one that is not located in your current working directory, or create a new folder by entering a name in the space provided.NoteTo create a triangulation folder, add the extension (.tri) to the name. If you do not add the extension, then the folder will not display in the Triangulation folders listed in the Vulcan Explorer.
Optimisation
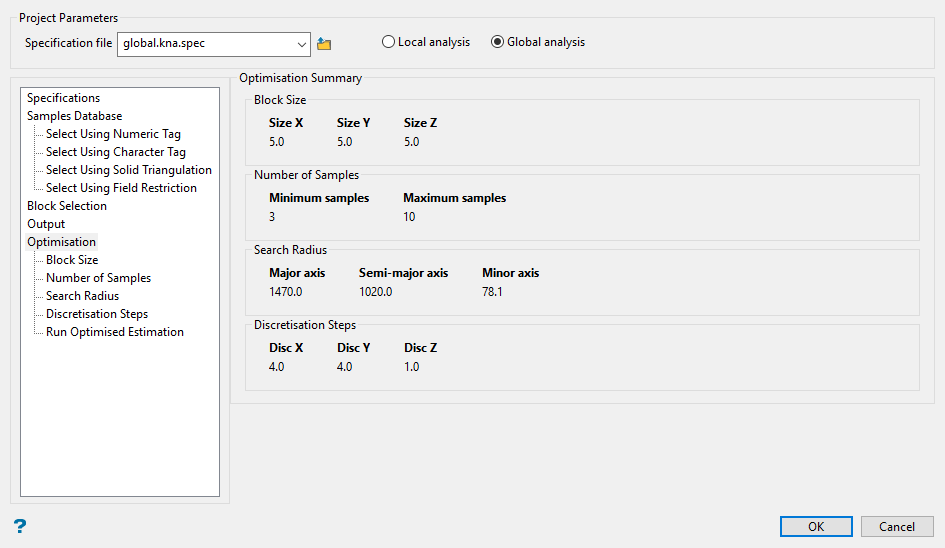
This pane shows a summary of the optimisation results. The values seen on this pane are taken from the values entered into the Optimal values found after each optimisation run.
Block size
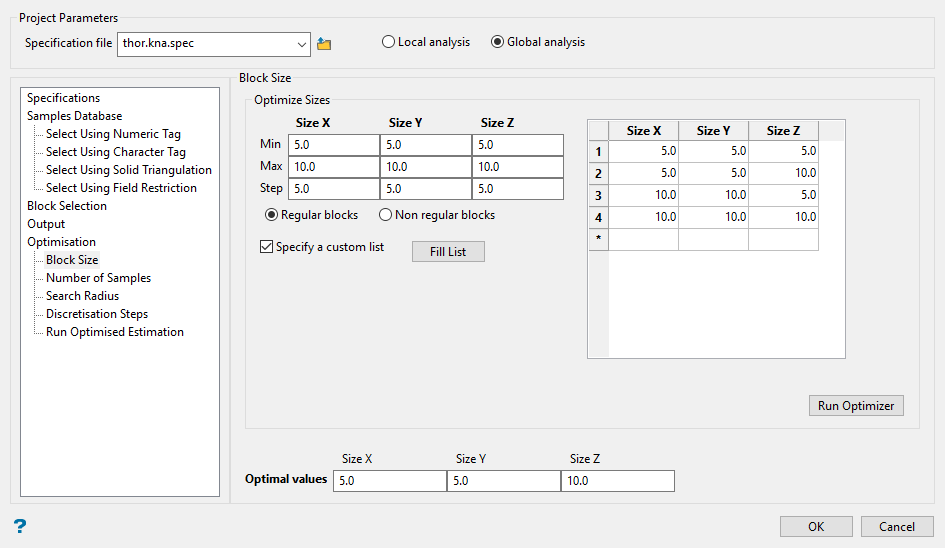
Use this pane to determine the best block size to use based on the sample data.
Follow these steps:
-
Enter the values for the Min, Max, and Step size for X, Y, and Z to evaluate.
-
Select Regular blocks (X equal to Y) or Non regular blocks (X not equal to Y).
-
Enable Specify a custom list to activate grid where the you can add items manually. By clicking Fill List, all possible combinations of X, Y, and Z sizes will automatically populate the grid.
TipYou can customise individual table entries by double-clicking on a cell.
Edit an entire row by using the right-click menu when hovering over any cell in the row.
-
Click the Run Optimiser button. You can see the progress by viewing the output sent to the Vulcan Console report window.
-
Enter the Optimal values for X, Y, and Z sizes after running the optimisation has completed and you have reviewed the results. These values will be shown on the Optimisation pane and used when using the option Run Optimised Estimation.
Number of samples
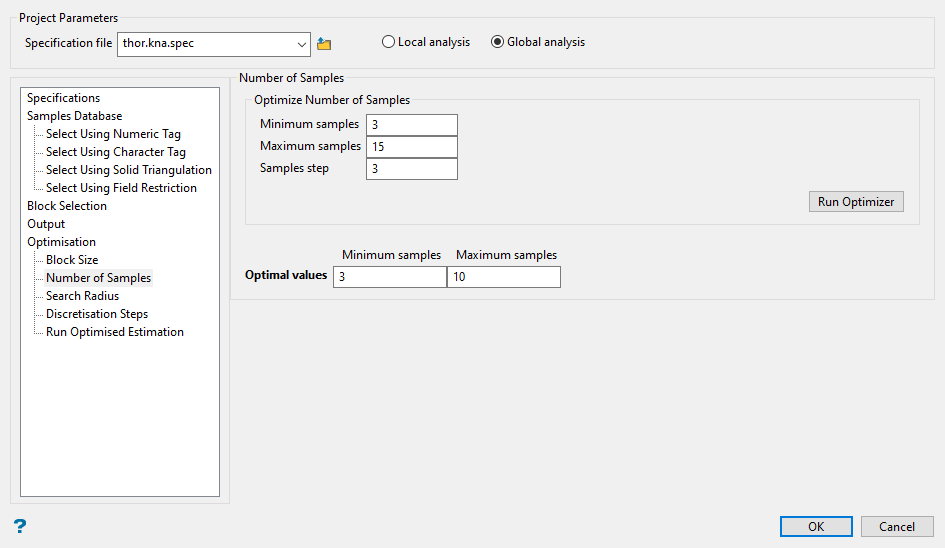
Use this method to determine the optimal number of samples per block to use.
Follow these steps:
-
Enter the Minimum samples. This is the minimum number of samples that will be used when estimating each block.
-
Enter the Maximum samples. This is the maximum number of samples that will be used when estimating each block.
-
Enter the Samples step. This is the amount the number of samples will increase for each iteration of the optimisation run, starting with the minimum amount and ending with the maximum.
-
Click the Run Optimiser button. You can see the progress by viewing the output sent to the Vulcan Console report window.
-
Enter the Optimal values for Minimum samples and Maximum samples after running the optimisation and reviewing the results. These values will be shown on the Optimisation pane and used when using the option Run Optimised Estimation.
Search Radius
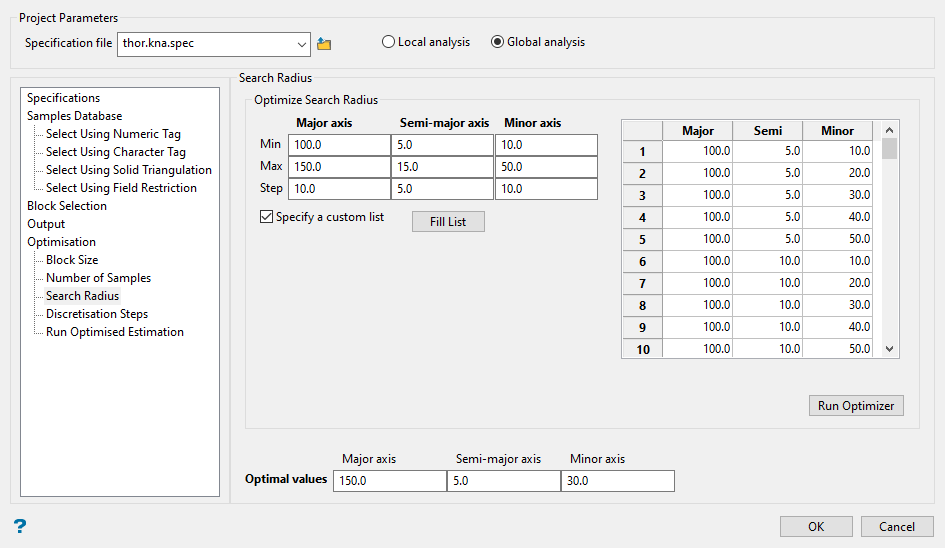
Use this method to determine the best search radius to use with your estimations.
Follow these steps:
-
Enter the Min search radius for the Major, Semi-major, and Minor axes. This is the minimum search radius that will be used when estimating each block.
-
Enter the Max search radius for the Major, Semi-major, and Minor axes. This is the maximum search radius that will be used when estimating each block.
-
Enter the Step. This is the amount the search radius will increase for each iteration of the optimisation run, starting with the minimum amount and ending with the maximum.
-
Enable Specify a custom list to activate grid where the you can add items manually. By clicking Fill List, all possible search radii combinations for the Major, Semi-major, and Minor axes will automatically populate the grid.
TipYou can customise individual table entries by double-clicking on a cell.
Edit an entire row by using the right-click menu when hovering over any cell in the row.
-
Click the Run Optimiser button. You can see the progress by viewing the output sent to the Vulcan Console report window.
-
Enter the Optimal values for the search radii after running the optimisation and reviewing the results. These values will be shown on the Optimisation pane and used when using the option Run Optimised Estimation.
Discretisation Steps
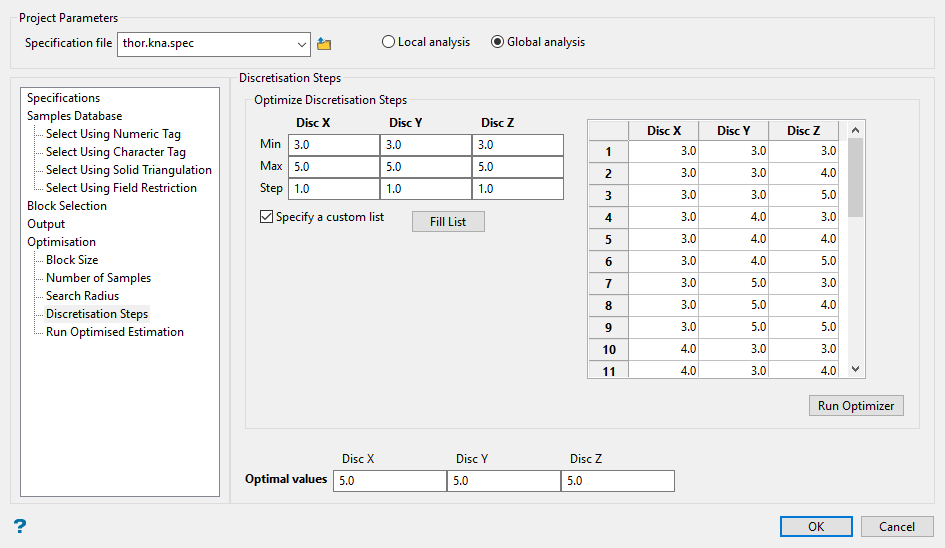
Use this method to determine the best discretisation step setting to use when running your estimations.
Follow these steps:
-
Enter the Min number of discretisation steps for each block in the X, Y, and Z, directions. This is the minimum number of discretisation steps that will be used when estimating each block.
-
Enter the Max number of discretisation steps for each block in the X, Y, and Z, directions. This is the maximum number of discretisation steps that will be used when estimating each block.
-
Enter the Step. This is the amount thediscretisation steps will increase for each iteration of the optimisation run, starting with the minimum amount and ending with the maximum.
-
Enable Specify a custom list to activate grid where the you can add items manually. By clicking Fill List, all possible combinations for the discretisation steps will automatically populate the grid.
TipYou can customise individual table entries by double-clicking on a cell.
Edit an entire row by using the right-click menu when hovering over any cell in the row.
-
Click the Run Optimiser button. You can see the progress by viewing the output sent to the Vulcan Console report window.
-
Enter the Optimal values for the discretisation steps after running the optimisation and reviewing the results. These values will be shown on the Optimisation pane and used when using the option Run Optimised Estimation.
Run Optimized Estimation
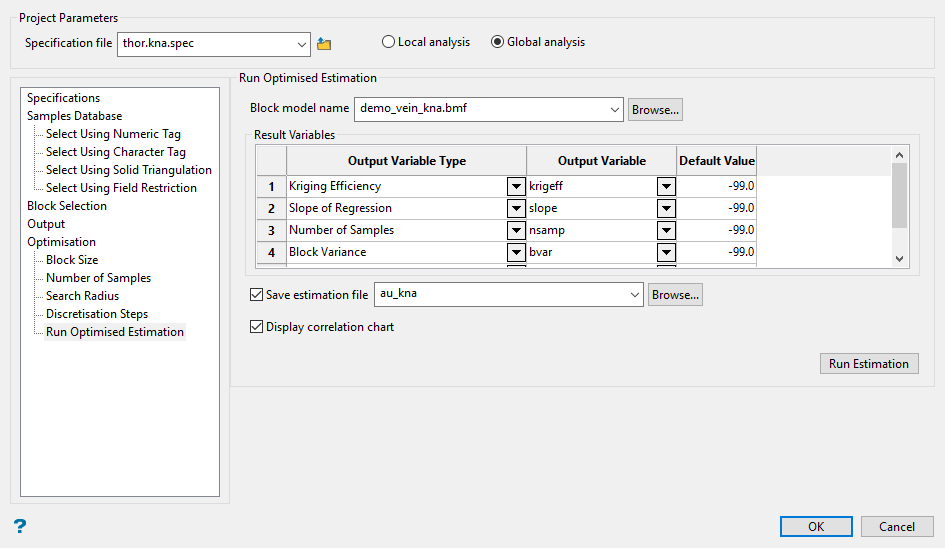
Select this option to run an initial estimation based on the optimal settings you have selected. This will create a new block model. The settings used can be viewed on the Optimisation pane. The block estimation file can then be opened and edited in the Estimation Editor to run a more complete estimation.
Follow these steps:
-
Select a block model. If you are using an existing block model, select it from the Block model name drop-down list. If you are creating a new block model, enter a name for the model.
Important: If you use an existing block model all the values in that model will be overwritten.
-
Select any Output Variable Type from the drop-down list. (Optional) You may select more than one.
-
Select or enter a name for each Output Variable.
-
Enter a Default Value.
-
Select Save estimation file if you want to save the estimation file (
*.bef). Enter a new name in the space provided, use the drop-down list to find an existing file, or click Browse to open an Explorer window. -
Important: If you use an existing estimation file all values in that file will be overwritten.
-
Select Display correlation chart to show the resulting chart when the estimation completes.
-
Click the Run Estimation.

