Minimum Burden Adjustment
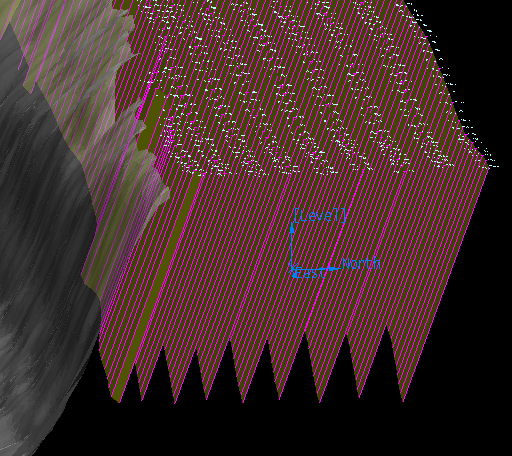
This tool permits adjustment of the burden before the blast to ensure there is sufficient to absorb the blast being applied. The actual burden around the holes is displayed, by comparing the blast design to a triangulation of the actual surrounding face. Dynamic adjustment of hole position, dip, bearing, depth etc. is permitted, and the face triangulation is colour-coded to indicate when each hole has been moved to an optimal position.
Note: Prior to using this tool, load the blast and the triangulation representing the face burden. For ease of viewing hole information in the tool's plot window, it is recommended that the face triangulation used does not extend greatly beyond the blast extent in any direction.
Instructions
Click the  Minimum Burden Adjustment icon on the Drill and Blast toolbar.
or
On the Drill and Blast menu, point to Edit, and then click Minimum Blast Adjustment to display the Select Blast for Minimum Burden Adjustment prompt.
-
Select the blast of interest.
-
Select the face triangulation associated with that blast.
-
On selecting these items ALL other data, apart from the holes in the blast and the triangulation, will be made invisible and the graphics will zoom to the extent of these data.
-
Visibility and original zoom extents will be restored on exiting this option.
The Control Panel
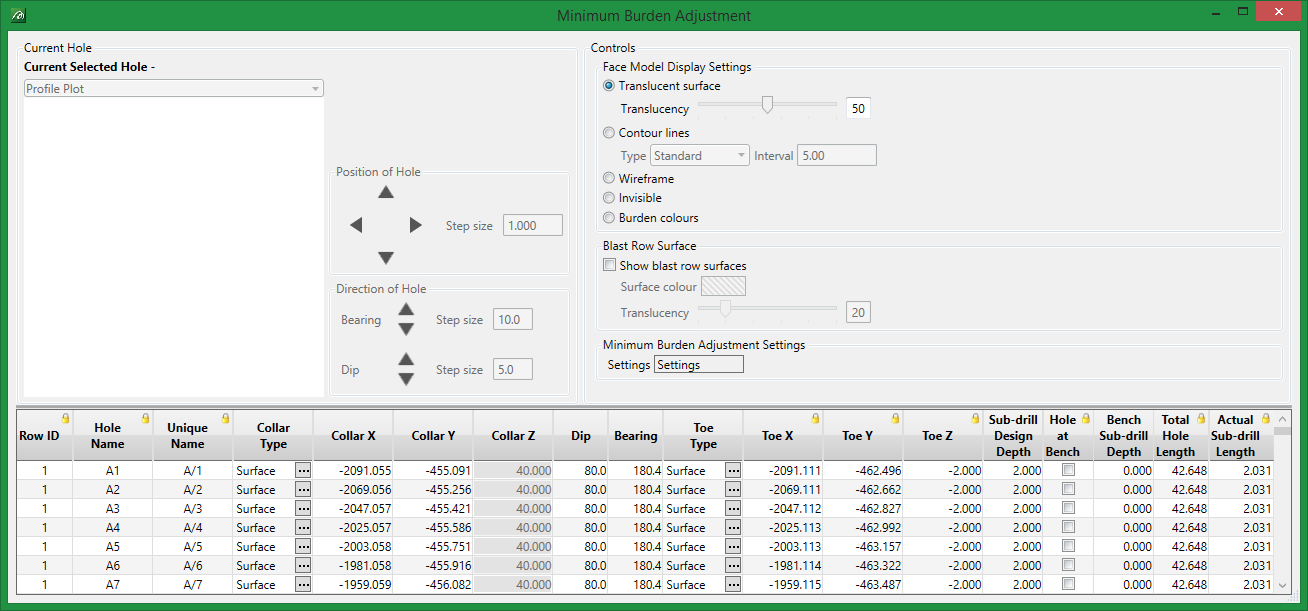
Current Hole
Select each hole to be adjusted, either from the Vulcan window or from the Data-Grid of hole information in the Minimum Burden Adjustment panel.
The holes can be selected through the translucent face triangulation. The selected hole will be highlighted in the Vulcan window and a corresponding plot of hole details will appear in the Control Panel window.
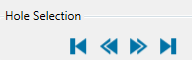
Use the hole selection Arrow buttons to toggle forwards and backwards through the data-grid list of available holes.
The Minimum Burden Adjustment panel features a grey dividing line at the top of the data-grid. Hover the mouse cursor over this line until the cursor symbol changes to a double-headed arrow. Hold down the left mouse button and drag this line up or down to change the proportions of the panel that are allocated to the data-grid and graphic window. The main panel can be rescaled via the corners, or expanded sideways or vertically by hovering the mouse cursor over the edge of the panel in the respective corner/side location, then clicking the left mouse button down and dragging to resize. Expanding the panel sideways will allow more columns of the data-grid to be visible, while expanding the panel in the vertical direction will increase the number of rows of the data-grid that may be viewed at one time.
Access the drop-down menu at the top of the graphic display to toggle between Profile Plot and Minimum Burden Plot.

Use of the mouse wheel is permitted in both these windows to zoom the view. To pan the view, hold down the left and middle (wheel) mouse buttons together and drag the mouse. To reset the view to normal, press the right mouse button.
This is a purely optical zoom to examine the plot, it has no effect on data resolution shown on the plot.
Dip

Click the left and right arrows to INCREASE or DECREASE dip angle respectively. This control uses the dip step-size increment shown on the panel (and settings).
Move

Click the left and right arrows to move the hole AWAY or TOWARDS the face respectively, along the hole's bearing vector. This control uses the Position-step-size shown on the panel (and settings).

Click this option to print the contents of the graphic window to a plot. Uses standard Windows print control.
Change data range

Click this option to limit the data extent seen on the plot to that of interest. This is useful, for example, when the triangulation used is too extensive. The data region of interest is usually around the hole (or can be just part of the hole). Use this to graphically select a portion of the data. Left mouse button click to indicate one corner of the region of interest and, while holding the button down, drag the mouse to the extent of the region and then release the button. Unlike the purely graphical zoom, by limiting the data range the amount of detail seen on the plot in the area of interest is increased.
Default data range

Click this option to return the view to the default data range.
Position of hole
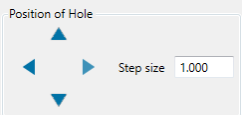
Click these arrows to move the position of the hole collar (or toe for bottom up holes) in the direction of North, South, East or West, in plan view. Elevation is determined by the 'Collar Type' design (or 'Toe Type' design for bottom up holes)
Step size
Enter the step size here (in project units of measure). Step size adjustments can also be made by accessing the Settings panel via the Settings button.
Direction of hole
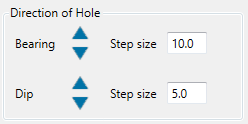
Bearing
Click the up or down arrow to adjust the bearing up or down, respectively, by the nominated Step size.
Step size
Enter the number of degrees that bearing adjustments are to be adjusted by, per click of adjustment arrows by the nominated Step Size. Step size adjustments can also be made by accessing the Settings panel via the Settings button.
Dip
Click the up or down arrow to adjust the dip up or down, respectively, by the nominated Step Size. Step size adjustments can be made by accessing the Settings panel via the Settings button.
Step size
Enter the number of degrees that dip adjustments are to be adjusted by, per click of adjustment arrows. Step size adjustments can also be made by accessing the Settings panel via the Settings button.
Controls

Face Model Display Settings
Translucent surface
Click this option to display the face triangulation as a translucent surface. Use the slider bar to dynamically adjust the degree of translucency, or enter a number between 0 and 100 here.
Contour lines
Click this option to display the face triangulation as contours. Access the drop-down list to toggle the required contour option. Choices are Standard, Start at Min. Z, Start at Max Z., No. between.
Interval/Count
Enter the required contour interval or number of contours here, as appropriate to the chosen contour setting.
Triangulation Display
Wireframe
Click this option to display the face triangulation as a wireframe.
Invisible
Click this option to make the face triangulation invisible
Burden Colours
Click this option to display the face triangulation colour-coded according to blast hole burden to the face. Note that colour scheme can be defined by accessing the Settings via the Settings button below on the panel. Use the slider bar to dynamically adjust the degree of translucency of the triangulation, or enter a number between 0 and 100 here.
Blast Row Surface
Show blast row surfaces
Check this option to show triangulations along each blast row.
Surface colour
Click on the colour to access the colour palette and alter the blast row surface triangulation colour.
Translucency
Use the slider bar to dynamically adjust the degree of translucency of the triangulations, or enter a number between 0 and 100 here.
Data-Grid
Important features:
-
If a hole is selected in the Vulcan window the data-grid listing will scroll to bring the current hole into view in the data-grid window.
- Left click on the column header to sort (by default) the data-grid using that column's data. Note: while this is enabled as default behaviour under Settings, column selection is disabled.
-
Alternatively, the column header may be used to select a column. See Settings > Data-Grid to access this option.
-
Fields/columns of the data-grid may be selected and the operations Cut, Copy and Paste used here via right-click context menu.
Do not paste large amounts of data at one time.
-
Entire rows may be inserted or deleted via the right-click context menu.
-
Data may be modified in the data-grid for the current hole and the plot and display will change dynamically.
-
The amount of space allocated to the data-grid and plot area may be changed easily. Hover the mouse cursor over the grey divider between the data-grid and upper area of the main panel. Hold down the left mouse button and drag the mouse up or down to re-apportion the area allocated to the plot and data-grid.
Minimum Burden Adjustment Settings
Valid Burden tab
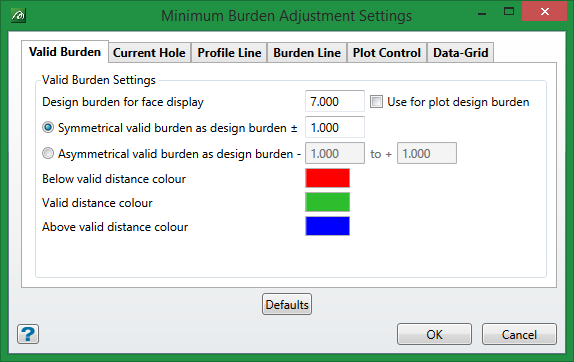
Design burden for face display
As every burden can have its own design burden value, an average value is used for the 'burden colours' display. The value auto-populated here is the computed average burden of the highest numbered blast row in the current blast design (i.e. the face row)*. Enter an alternative number in this field if desired. Click on the Defaults button at the base of the panel to return to this computed average value.
In the event that there is not a face row, or it has a limited number of holes, the average value may be made for the whole blast.
Use for plot design burden
Check this box to apply this value as an override to the hole's own design burden shown in the plots. This may be done so that the burden colours shown on the plots match the 'Burden colours' face display when the Design burden for face display value markedly differs from the holes' actual design burden.
This only overrides the design burden value of face holes (i.e. holes that have a profile against the face).
Where a design burden value has been overridden on the plots it will be shown in italics.
The need for this option is because it is possible that every hole may have its own design burden and the average or user preferred value may be markedly different from some hole's actual value. Being able to use this setting value on the plot display keeps the distance lines shown consistent in their colour with the Face Burden colours (which is why only face holes are overridden).
Symmetrical valid burden as design burden
Enter a value here for the amount of burden variation to be considered as valid design burden when applying colours to the triangulation. For example, a symmetrical distance of +/- 1 will result in burden of values range up to 1m either side of the design burden value entered in the field above also being given the Valid distance colour.
Asymmetrical valid burden as design burden
Enter values here for the burden on the face side of the blast holes and on the side away from the face, respectively, to set the range of valid burden values which will be coloured with the Valid distance colour. For example, for a given default Design value of 35m and asymmetrical values of -2m and +18m, the valid burden range will be between 33m and 53m away from the face.
Below valid distance colour/Valid distance colour/Above valid distance colour
Click on the respective colour field to access the Colour Palette for these zones.
Current hole tab
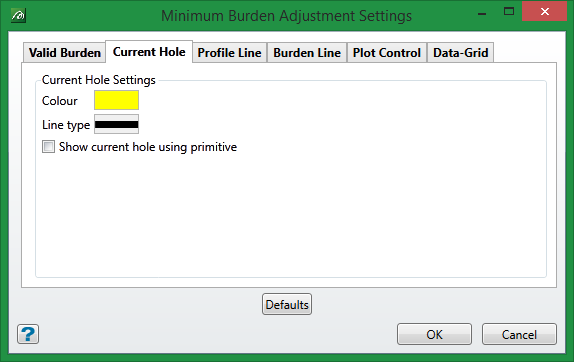
Colour
Click on the colour button to access the colour palette to colour the downhole trace of the current hole.
Line type
Click on the line type button to access the line type palette for the downhole trace of the current hole.
Show current hole using primitive
Check this box on to display the current hole as a three-dimensional cylindrical triangulation.
Profile line tab
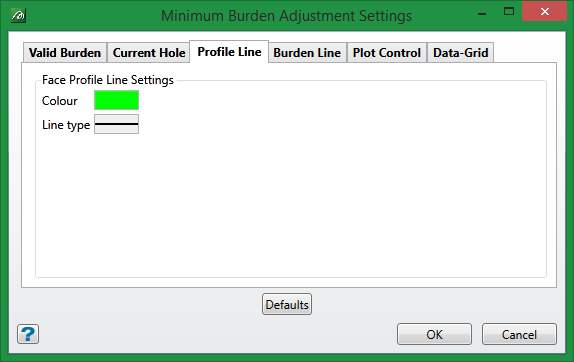
Colour
Click on the colour button to access the colour palette. The face profile line will be drawn on the face triangulation directly in front of the current hole.
Line type
Click on the line type button to access the line type palette. The selected line type will be applied to the face profile line.
Burden Line tab
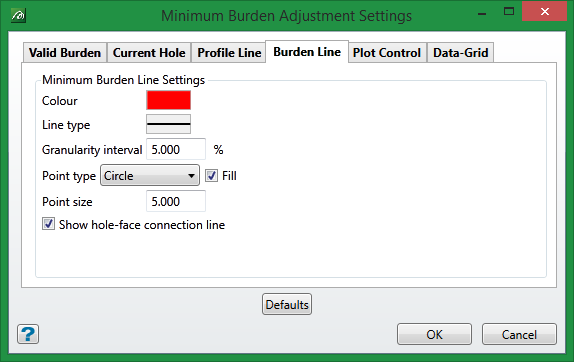
Colour
Click on the colour button to access the colour palette to assign a colour to the minimum burden line settings. These annotations are only visible in Vulcan when the Minimum Burden Plot graphic window is selected on the main Minimum Burden Adjustment panel.
Line type
Click on the line type button to access the line type palette for the minimum burden line.
Granularity interval (%)
Enter a value here to determine the subinterval at which minimum burden lines will be displayed downhole.
Point type
Use the drop-down list to select the symbol type to be displayed at the blast hole and face ends of the minimum burden lines.
Fill
Check this option to fill the symbol type selected above. If unchecked, the chosen symbol will display as a polygon only.
Point size
Enter a value here for the size of the symbol used on the minimum burden line.
Show hole-face connection line
Check this box to draw a line between the symbols at the blast hole and the face at each interval.
Plot Control tab
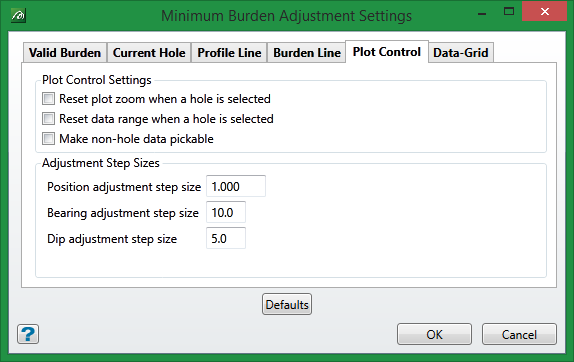
Reset plot zoom when a hole is selected
Check this option to reset plot zoom when a hole is selected. If not set, the previous zoom and pan settings will be applied to the next hole. The plot zoom will always be reset when switch plot types (Profile <-> Minimum Burden) because the plot types will be incompatible.
Reset data range when a hole is selected
Check this option to reset the data range when a hole is selected. If not set, the selected data range extents of the previous hole will be applied to the next hole. This option only applies to the Profile plot and be aware that sometimes the previous selected range may be incompatible with the next hole (in which case select Default Range button).
Make non-hole data pickable.
By default, only the hole data can be selected from graphics during Minimum Burden Adjustment, to make selection easier. Check this option to enable selection of any of the visible data.
Adjustment Step Sizes
Enter the step sizes for Position, Bearing, and Dip adjustment step.
Data-Grid tab
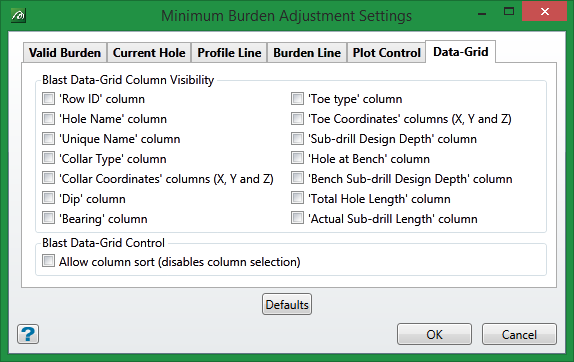
Blast Data-Grid Column visiblity
Uncheck the box of the respective column type to remove the column from display on the Data-Grid. Default setting is for all columns to be displayed.
Blast Data-Grid Control
Allow column sort (disables column selection)
The column header can either be used to set column sorting on that column or can be used to select that column - it cannot do both selection and sort control. Toggle this control to toggle the mode accordingly.
Defaults
Click this button to restore default settings to all values on the tabs of the Minimum Burden Adjustment Settings panel.

