Create
Create Structural Data
Use this option to enter structural data manually in either the Primary or Stereonets Windows. Optionally, the data can be added to the structural database from the
The Create option is useful when you have loaded the poles to many structures onto the Stereonet and want to pick a centroid visually from all these poles and display the plane of that average point.
Instructions
On the Geotech menu, point to Analysis, then click Create.
The panels and prompts displayed in this option depend on the window you are currently in.
- Primary Window
- Stereonets Window
Primary Window
Once selected, you will be prompted to select the location for the structural object. Once the location is indicated, the following panel displays.
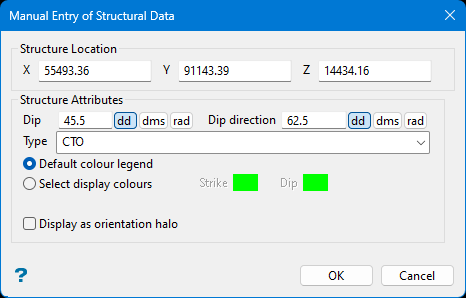
Manual Entry of Structural Data panel
The Manual Entry of Structural Data panel allows you to modify the location of the structural object, as well as define display characteristics.
Structure location
The X, Y and Z coordinate data will be sourced from the point digitised on the screen prior to the panel being displayed. The coordinates can be changed or refined as necessary.
Dip
Enter the dip required for the new structure.
Dip direction
Enter the dip direction required for the new structure.
Type
Use this option to define the structure type, for example Fault, Joint, Slickensides,
Default Colour Legend
Select this option to use the default colour scheme for the structure's attributes. The colour scheme can be viewed and modified by using the Analyse > Legend Edit option, and set using the Geotech > Display > Setup 3D Display option.
This colour scheme will only operate if a structural database is currently open.
Select display colours
Select this option to manually choose the structure's colour attributes from the current colour table.
Display as orientation halo
Select this check box to display the structural object as an orientation halo.
Select OK.
The structural object is then created at the specified location.
Stereonets Window
Once selected, the following panel displays.
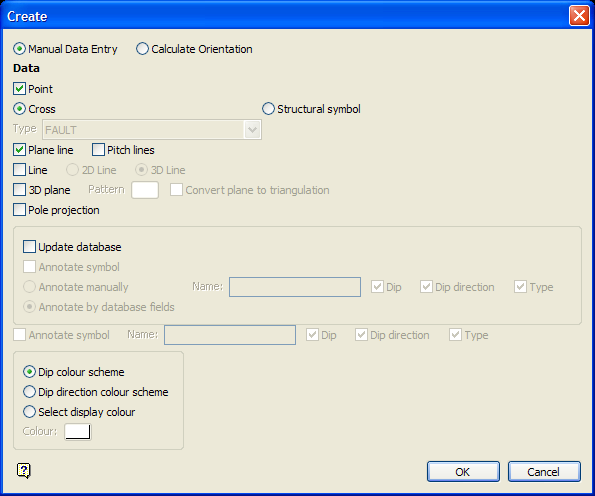
Create panel
The Create panel provides you with the option of either creating the structural data by picking a location on the screen, or having the system create the data by calculating the average orientation from existing structural data. The remainder of this panel allows you to enter the structural object's display attributes.
Manual Data Entry
Select this option to digitise manually the structural point on the screen.
Calculate Orientation
Select this option to calculate automatically an average pole point for a cluster of pole points. You may restrict the selection of data using a pre-designed polygon.
Point
Select this check box to display the point on the stereonet. The Cross and Structural symbol options will be available when this check box is ticked. The Cross and Structural symbol options allow you to plot the point on the stereonet as a cross or as a structural symbol.
If the Structural symbol option is selected, then the Type field will be available. The Type field indicates the structure types that you can select from the drop-down list, for example Fault, Joint. The symbol displayed will directly relate to the structure type. Examples of structural symbols are listed in the Overview of the Utilities documentation.
Plane line
Select this check box to display the plane line on the stereonet. Check the Pitch lines check box to display pitch lines on the stereonet at 10 degree intervals.
Line
Select this check box to display either a 2D or 3D line from the centre of the projection plane to the pole point. The 2D line will be a line in the projection plane, and the 3D line will be projected from the centre of the projection plane into the lower hemispherical projection. It is recommended that the 3D lower hemisphere displays (see the Set Up 3D Display option under the Geotech > Display submenu).
3D Plane
Select this check box to display a 3D plane line in the lower hemispherical projection of the stereonet. You will be able to nominate a pattern fill for the 3D plane.
Check the Convert plane to triangulation check box if you want to convert the 3D plane line into a triangulation. The triangulation can then be solid shaded, or have an image tiled over it.
Upon completion of this panel, the Triangulate 3D Plane panel displays.
Pole projection
Select this check box to project and display the pole point on the stereonet. If this check box is not ticked, then the displayed point will lie in the projection plane.
Update database
Select this check box to add the manual or calculated point to the currently open structural database. When using the Identify option, you will be able to see the associated database information. If this check box is not ticked, then the Identify option will only show basic information such as layer, object, feature, group. Note that this information is only drawn to the screen, and will be cleared when you quit the application.
Upon completion of this panel, the Structural Data Entry panel displays.
Annotate symbol
Select this check box to annotate the symbol. You will be able to enter a name for the structure. The Dip, Dip direction and Type check boxes can be ticked if you require the data from each field to be posted onscreen.
Upon completion of this panel, the Annotate Manual Structural Data panel displays.
Annotate by database fields
Select this option if you require the symbol to be annotated by selected database fields. Upon completion of this panel, the Geotechnical Annotation Fields Entry panel displays.
The annotation and colour options are only available when the Point and Structural symbol options have been selected.
Dip colour scheme
Select this option to colour the symbol(s) using the colour legend for Dip.
Dip direction colour scheme
Select this option to colour the symbol(s) using the colour legend for Dip direction.
Select Display colour
Select this option to display the symbol(s) in the colour chosen from the current colour table.
Select OK.
You will then be asked to pick the location for the structural object on the Stereonet display. When prompted, select Retain to confirm and accept the digitised point. Once confirmed, a pair of angles (cross) will appear, marking the selected position. Alternately, to change the point location, select Edit Position.
The position of the point picked on Stereonet (cross) always reflects the dip and dip direction of a particular entity, even if the Dip/Strike orientation is selected in the Projection Display panel during Stereonet setup. In its turn, the displayed pair of angles (number in the brackets) depends on the whether the Dip/Dip direction or the Dip/Strike orientation was selected on the Stereonet setup panel (Projection Display), as well as whether the Pole projection (from the Create panel) is ticked. The angle pair shows the position of the plane you are about to create in the angular coordinate system defined in Stereonet setup.
The entity whose dip and dip direction describe the point on the Stereonet are either the plane of the structure or the line to the pole point. Note that if the Pole Projection check box on the Create panel is ticked, the entity is the line; otherwise it is the plane of the structure.
Select Edit Position to edit the position or structure type. Once selected, the Edit Data Orientation panel displays.
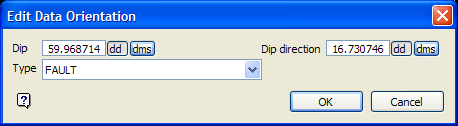
Figure 1: Edit Data Orientation panel
Dip
Enter the new dip value. The dip value can be entered in decimal degrees or degrees minutes seconds (ddd.mm.ss).
Dip direction
Enter the new dip direction value. The dip direction can be entered in decimal degrees or degrees minutes seconds (ddd.mm.ss).
Type
Select the new structure type from the drop-down list.
Select OK.
If you chose to update the database, then the Structural Data Entry panel displays.
The following panel is then displayed.
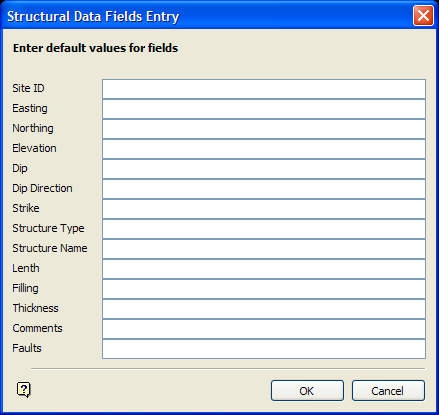
Figure 2: Structural Data Fields Entry panel
Enter the default values for the fields. If you are updating existing records, then any field without a value in the data entry panel will use the default value. Appending new records will cause the default values to be placed in all fields. However, calculated coordinate and orientation information will be placed in the data entry panel based on the object selected or digitised, overwriting any default values.
Select OK.
The following panel is then displayed.
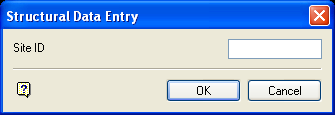
Figure 3: Structural Data Entry panel
Enter the site identifier for the location you digitised. If you chose to increment the site identifier, then the numeric part of the site id will be incremented by one for each of the specified locations.
Select OK.
The following panel is then displayed.
The field values for the specified record will be updated or appended. If you have chosen to update records and a record with a matching site identifier field value is not found, then you will be prompted to append a new record. The new structural data displays using the specified display method, i.e. point, structure object or orientation halo.
If you chose to convert the 3D plane line into a triangulation, then the Triangulate 3D Plane panel displays.
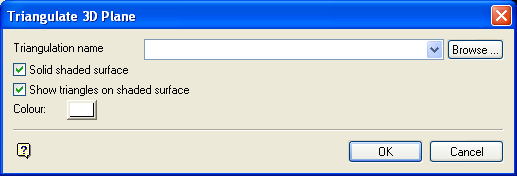
Figure 4: Triangulate 3D Plane panel
Triangulation name
Enter the name for the resulting triangulation file. The list contains all triangulations in the current working directory. Click Browse to select a file from another location. Nominating an existing file will require you to confirm whether or not you want to overwrite the original information.
To create a new file, enter the file name and file extension.
Solid shaded surface
Select this check box to display the new triangulations as solid shaded surfaces, i.e. not transparent and no mesh lines. Solid shading requires additional memory.
Use the  3D/Solid Shading button on the Graphics toolbar to turn the shading on/off once the triangulation has been loaded.
Show triangles on shaded surface
Select this check box to display the actual triangulation lines as well as the solid shading. This check box is only applicable when the Solid shaded surface check box has been ticked.
Colour
Select a colour for the resulting triangulation.
Select OK.
The following panel is then displayed. For more information about the options in this panel, see Model > Triangle Files > Properties....
If you chose to annotate the symbol, then the Annotate Manual Structural Data panel displays
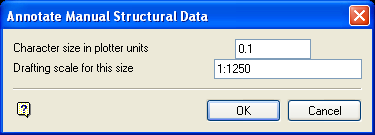
Figure 5: Annotate Manual Structural Data panel
Character size in plotter units
Enter the size of the text on the plot in relation to the drafting scale.
Drafting scale for this size
The drafting scale is used in conjunction with the text size entered above.
If the text size is set to 0.30 and the drafting scale to 1:100, then text will appear on the screen as 0.03cm. Changing the scale in either this option or the Plot option (under the Geotech > Utilities submenu) to 1:1000, results in the text appearing as 0.30cm. Changing the scale to 1: 10 000 results in a text size of 3cm and so forth.
Select OK.
You will then be prompted to select the colour for the annotation, followed by the stereonet to annotate.
If you chose to annotate by database fields, then the Geotechnical Annotation Fields Entry panel displays once a stereonet has been selected.
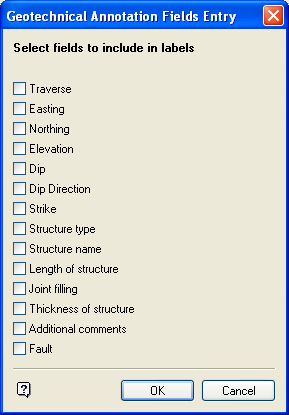
Figure 6: Geotechnical Annotation Fields Entry panel
This panel gets its contents from the fields in the structural database. Check the boxes to display the information you want.
Select OK.
Upon acceptance, you will be returned to the Create panel.
The structure objects created have no link to the structural database, as linking to structural database is only available in the Stereonets Window. Structure objects not linked can be removed from display through the use of the Remove From 3D option (under the Geotech Display submenu).

