Grid Properties
This panel is used to load a coordinate grid and to alter the grid settings on a displayed grid.
This panel can be accessed two ways.
- Right-click the Toggle Grid Display icon on the Graphics toolbar.
- On the Analyse menu, point to Grid, then click Properties.
Axis tab
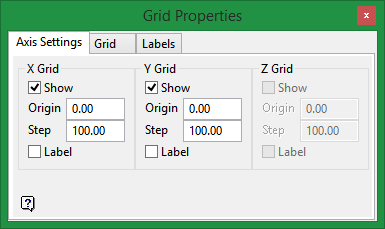
Enter the setting for the axes on the Axis tab. Your choice of grid under the Grid tab will affect which of the X, Y, and Z grid sections is shadowed.
Show
Select this check box to display the grid line.
Origin
Enter a value for the origin of the grid lines. The default is 0.00.
Step
Enter a value for the step. This is the interval between grid lines. If the screen display would be dominated by grid lines, then the grid lines are displayed at multiples of the interval.
Label
Select this check box to label the grid lines. Use the Labels tab to control the labelling parameters.
The information that you entered in the X, Y, and Z grid fields is used to determine the origin and step size of the annotations.
Example: If you selected an origin of '1', and a step size of '100', then the annotations will occur at 1, 101, 201, etc.
Grid tab
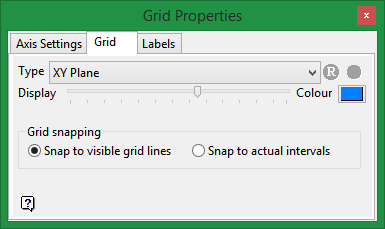
Use the Grid tab to define the grid type, grid colour, grid display, and whether to snap to visible grid lines or actual intervals.
Type
Select the type of grid you want to display. There are 6 types available:
-
XY Plane Produces a 2D grid with constant Z value, which is the current default Z value. The grid is updated automatically if the default Z value is altered.
-
XZ Plane Produces a 2D grid with a constant Y value, which is the Y value at the centre of the screen.
-
YZ Plane Produces a 2D grid with a constant X value, which is the X value at the centre of the screen.
-
Screen Plane Produces a grid, which can be 2D or 3D depending upon your selections on the Axis Settings tab, that is the intersection of the screen plane with planes of constant X, Y, and Z values. This is the same as the Dynamic Grid option in previous versions; however, the grid lines of dynamic grids are now labelled as X, Y, Z rather than as E, N, and L.
-
Primary Plane Produces a grid of the current section plane. These planes are created in the Creation Section option of the Change View > Section option.
-
3D The grid is fitted to the extents of your project (sg1) file and the Reset
 and Zoom Data Extents
  icons are activated. The Zoom Data Extents icon fits the 3D grid to the world and the Reset icon fits the data to the extent of the project file. The information that you entered in the X, Y, and Z grid fields is used to determine the origin and step size of the annotations.
Figure 1: 3D Grid fitted to the .dg1 extents
Display
Defines the intensity of t grid's graphical representation. If the slider value is set as '0', then no grid is displayed. If the slider value is set to full, then the grid will appear to be solid.
Colour
Select the colour for the grid. The overlay colour, which is defined through the Graphics > Colours section of the Tools > Preferences option, is used by default.
Grid Snapping
Select the method for grid snapping:
-
Snap to visible grid lines Select this option to snap, when using the Grid Snap mode on the Digitise toolbar, to the closest displayed point, on the grid plane, beneath the cursor.
-
Snap to actual intervals Select this option to snap, when using the Grid Snap mode on the Digitise toolbar, the closest point, on the grid plane, beneath the cursor. You may snap to a grid intersection that is not displayed on the screen.
Important: It is not possible to use grid snapping when a 3D grid is enabled or if zero (0), one (1), or three (3) aces are displayed for Screen Plane or Primary Plane grids. When digitising using Indicate mode and XY, YZ or YZ plane grids are enabled, the object is snapped to the grid.
Labels tab
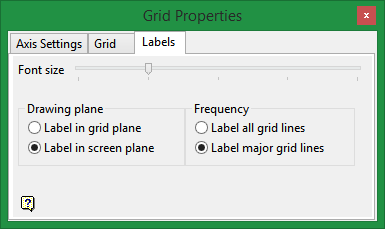
Use this tab to control the appearance and placement of the axes labels.
Font size
Use the slider to select a value for the size of the font.
Drawing plane
Choose the plane in which to place the labels. You can choose to display the labels in the screen plane, in which case they will always be visible regardless of the rotation of the grid, or in the grid plane.
Frequency
Select the frequency of the grid line labelling. You can choose to label all of the grid lines or only the major grid lines.
As you enter values into the panel, the grid display will be updated dynamically. To close the Grid Properties panel, click on the Close Window icon ![]() . To redisplay the Grid Properties panel, right-click on the Grid Properties icon
. To redisplay the Grid Properties panel, right-click on the Grid Properties icon ![]() .
.
The grid settings will be saved to the vulcan.prefs file (for the Primary window) and the file (proj.>wnd file (for sub windows).
Use the Remove option to remove the grids form the screen.

