Drape
The Drape option allows you to drape 'attribute variable data' over a loaded and visible grid mesh model. The attribute variable data of one grid mesh is displayed as colour coded intervals over the selected grid.
A topography map could have pollution data draped over it so that patterns of pollution are shown. Alternatively, a grid mesh can be draped with its own variable data.
Instructions
On the Model menu, select Grid Mesh Surfaces, then click Drape.
Select the grid on which to drape the attribute variable data. The following panel is then displayed.
Drape panel
This panel allows you to nominate the drape model's name and colour.
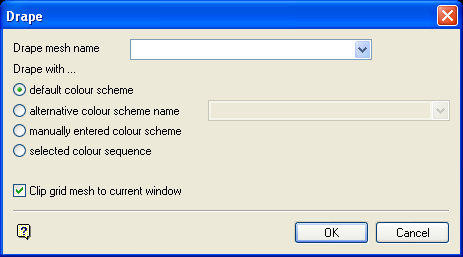
Drape mesh name
Enter, or select from the drop-down list, the grid model identifier (<gfi>) and model variable <MV> parts of the model containing the attribute variable data to be draped. Prefixing the identifier and model variable with an underscore (_) allows you to select grids from other projects.
If you want to drape the model with its own variable data, enter the name of the selected model.
For the contour colours you can select one of the following four methods. The first two methods use intervals and colour legends. The third method allows you to enter manually an interval and select a colour while the fourth method allows you to select a range of colours.
default colour scheme
This method will use the colour legend equivalent to the model being contoured, e.g. 'tp'. If no variable was included with the model name, then the 'sf' legend will be used as this is the default. If no legend exists, then you must enter the intervals and colours manually as with Manually enter colour scheme option.
alternative colour scheme
This method will use a nominated colour legend. For example, while you may want the 'topo.tp' grid mesh to be contoured, you may want to use the intervals and colours that have been set up for another variable, e.g. 'tk'.
manually entered colour scheme
This method allows you, once this panel is completed, to enter manually a series of intervals and select a colour for each interval. The Colour Range panel, in which you enter the intervals, is displayed once this panel is completed.
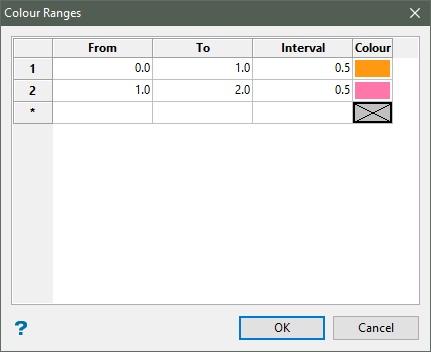
From... To
Enter the minimum and maximum for each range. Up to 256 ranges may be specified.
Interval
Enter subintervals within the specified range. This will result in additional contour lines.
Colour
Left-click in the colour column. From the displayed colour table, select a colour for the range.
Colour legends are 'read' by the system from top to bottom and the first condition that matches the value will be used. For example, the following entries will result in the colour red being used.
Colour 1 of the current colour table will be used for field values not matching any entry in the legend. To use another colour, make a far-reaching entry such as -100000.0 to 100000.0 for numeric legends and assign it a colour. This entry must be placed at the bottom of the legend.
Selection of no colour will result in no colour being applied to the range, this is indicated by an X in the display field (see the diagram above). Objects coloured with "no colour" will not be displayed.
You can also set the colours sequentially, i.e. in the same order as they appear in the colour table, by selecting (left-click in the column heading) the colour column, right-clicking and then selecting Colour Range from the context menu.
You must then select the colour from which you want to start the sequence. This colour will replace the colour with the lowest index value (this is the number of the colour in the colour table) in the column, the remaining colours will be updated automatically to follow the sequence.
selected colour sequence
This method will prompt you, once this panel is completed, to select two colours from the current colour table. The first colour corresponds to the lowest grid value and the second colour to the highest grid value. The contouring will be such that these two colours, and all between them, are assigned equal value ranges that are derived from dividing the total number of colours into the Z value range of the grid mesh.
You may indicate colour 5 for the lowest grid value and 14 for the highest grid value. These 10 colours (5 to 14) will then be evenly divided over the grid mesh Z value range to form the contours.
Clip grid mesh to current window
Select this option if you want to clip the grid mesh to the Primary Window. If this checkbox is ticked, then the section of grid mesh displayed inside the Primary Window will remain visible, however, any part of the grid outside of the current Primary Window area will be 'clipped' or hidden.
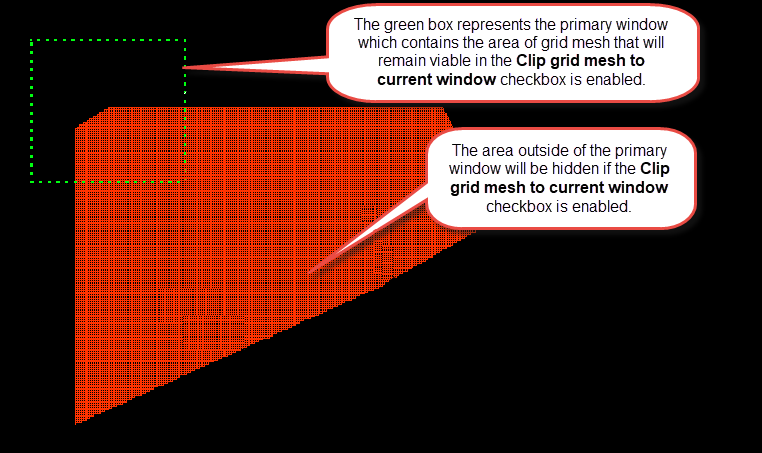
Figure 1: Clipping a Grid Mesh to the Current Window
Select OK.
The model is then draped with the appropriate data. The Drape panel will also be redisplayed, allowing you to select another surface to drape.

