Analyse Vertices
Show Point Statistics
Use the Analyse Vertices option generates statistics on the points in a triangulation. This information can be used to locate and analyse any problem areas in the triangulation.
This option can also be used to gain an indication of the presence of outliers - individual points beyond the 'main' grouping (such as a uniform surface) that may be erroneous (a single point may have significant influence on the mean and distribution of points.) These can be removed using the Filter option.
Refer to the Overview section for more details on typical types of problems associated with triangulations. Use the Analyse Vertices option to generate statistics on the triangles.
Instructions
On the Model menu, point to Triangle Edit, and then click Analyse Vertices option
Select the triangulation. If there is only one triangulation loaded onscreen, then it will be automatically selected.
The following panel is then displayed.
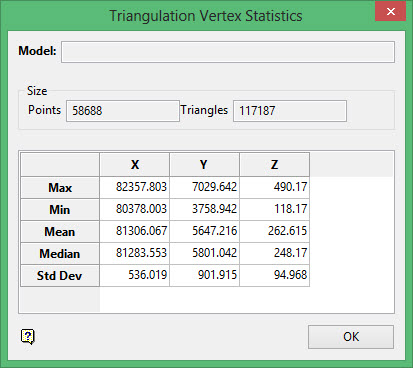
This panel contains information about the points, such as maximum and minimum X, Y and Z co-ordinates and the mean, median and standard deviation of the points. The name of the triangulation displays at the top.
Max
The maximum or largest value of each of the co-ordinates.
Min
The minimum or smallest value of each of the co-ordinates.
Mean
The average value of each of the co-ordinates. The mean or average of a set of values is the sum of the values divided by the number of values.
Median
The middle value, numerically, of each of the co-ordinates. The median of a set of values is found by sorting the values into numeric order and finding the middle score.
Std Dev
The standard deviation of each of the co-ordinates. The standard deviation measures the spread of the scores. Low standard deviations mean that most of the data is clustered around the mean.
Click OK.

