Create
Create a Triangulation Model
Use the Create option to create a triangle model by triangulating data points. The data to be used must already be loaded onto the screen as pickable objects, i.e. not as an underlay. It may be useful to include one or more polygons, as polygons can be used as boundaries to limit the data to be triangulated.
Instructions
On the Model menu, point to Triangle Surface, and then click Create to display the Triangulation panel.
Data tab
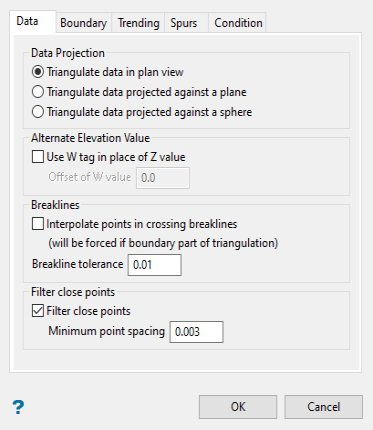
Data projection
Triangulate data in plan view
Select this option to create a horizontal triangulation.
Triangulate data projected against a plane
Select this option to create a triangulation where the selected data is projected onto a user-defined plane. If this option is selected, then the Triangulation plane panel displays upon completion of this panel.
Triangulate data projected against a sphere
Select this option to triangulate the data radially from a central point. If this option is selected, then you will be prompted (upon completion of this panel) to select the sphere origin and a primary direction. Vulcan will draw a diagram to indicate the primary direction, as well as a semicircle to indicate where the 'seam' will be placed - no triangles will be formed over the seam.
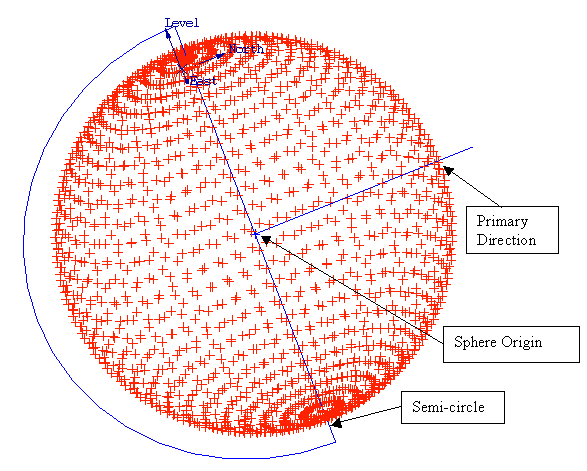
1- Primary Direction and Semicircle over which no triangles will be formed

Figure 1: Triangulation
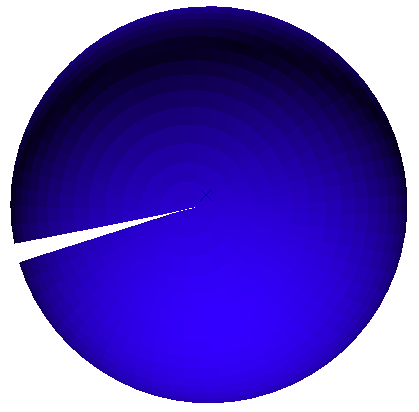
Figure 2: Triangulation rotated to make the "seam" more obvious
Alternate elevation value
Use W tag in place on Z value
Select this check box to replace the Z co-ordinates with a W tag (to a create a model from which you can contour W tag values). Enabling this option will also allow you to specify an offset for the W value.
Breaklines
Interpolate points in crossing breaklines
Select this check box if you are triangulating data containing breaklines that overlap when viewed in the triangulation plane. Additional vertices will be added to the triangulation at all positions where line segments cross. If this check box is not checked, and the data being triangulated contains crossing breaklines, then a message similar to the one below displays in the Report Window. Only the first crossing breakline that is detected will be reported.
Crossing Breaklines Startup Window
**trimake, Warning crossing breaklines Checkpoint (563526.940530,3747658.442238,200.000000) & (563605.282788,374765.507601,200.000000)
Breakline tolerance
Enter the breakline tolerance. This tolerance controls the maximum distance that a triangulation node can be from a breakline before the breakline breaks adjacent triangles. The breakline tolerance stops the forming of long narrow triangles and helps to solve crossing breakline inconsistencies.
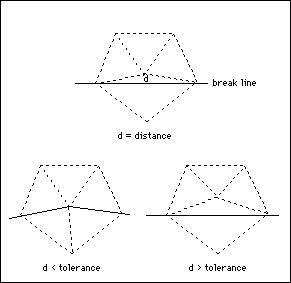
Figure 3: Breakline tolerance
Note: If you are triangulating data on a very regional scale, and the data points are quite a distance apart, then you will need a larger tolerance than when triangulating a detailed data set, such as the back of a dump truck.
An example of a breakline inconsistency is when two contour lines cross. This may be the case if the contours are imported from DXF files. A crossing of two contour lines is called a breakline error. Errors such as this cause triangles to form across these inconsistencies. When a breakline error occurs, Vulcan writes the co-ordinates of the first segment in which the error occurs into the Report Window. Also, all break line errors are logged into the breakline.error_log file. You can use a text editor to examine the co-ordinates in this file. To locate visually where the errors are occurring, create points in Vulcan at the co-ordinates in the error log. It is then easy to see the points and zoom in to the exact problem segments.
The breakline.error_log file is not erased before each triangulation. It is only written when a breakline error occurs. If you want to know if the breakline log file is current, remove or rename breakline.error_log, rerun the triangulation and then check to see if the breakline.error_log was created. If there is no error log file, then no breakline errors occurred in the triangulation.
Filter Close Points
Use this option to remove points that are within the tolerance distance from each other.
Boundary tab
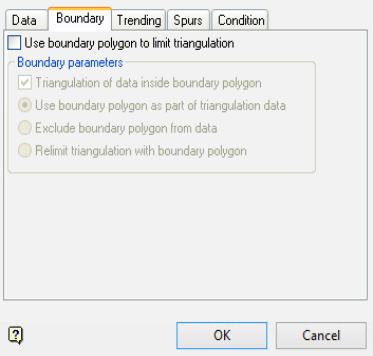
Use boundary polygon to limit triangulation
Select this check box to use polygons as boundaries to limit the data to be triangulated. If this check box is not checked, then all data loaded on the screen will be triangulated.
Boundary parameters
Triangulation of data inside boundary polygon
Select this check box if you only want to triangulate the data (points) inside the polygons. If this check box is not checked, then all data outside the polygons will be triangulated.
Use boundary polygon as part of triangulation data
Select this option to include the data points forming the polygon in the triangulation.
Exclude boundary polygon from data
Select this option to exclude the data points forming the polygon from the triangulation. The polygon controls which data points are triangulated, i.e. inside or outside. The resulting triangulation extends to the data points closest to the polygon.
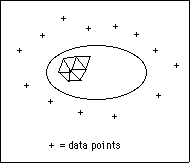
Figure 4: Exclude boundary polygon
Relimit triangulation with boundary polygon
The data points forming the polygon are not used, but the polygon is used to relimit a triangulation of all of the data selected for triangulation. This means that the resulting triangulation will extend to the position of the polygon.
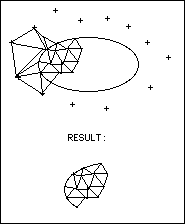
Figure 5: Relimit a triangulation
Trending tab
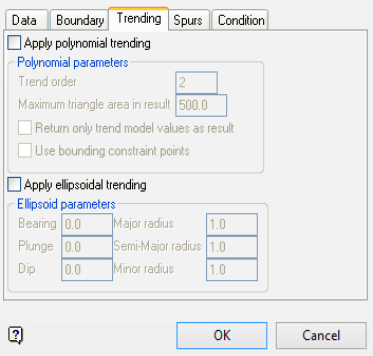
Apply polynomial trending
Select this check box to build into your model an overall geological feel (trend) to the surface. The trend represents a best-fit mathematical model that estimates the surface shape between the data points. A regression method that gives the best fit is used. In the same manner that you can plot a scatter diagram and work out a line of best fit, you can add an extra variable (for example easting or northing) and compute a 3D surface of best fit. The fitted surface represents the regional trend present in the data.
Polynomial parameters
Trend order
Enter the trend order. This value relates to the complexity of the trend surface. Generally, you should not use an order above 3. See the table below for an indication of the order to use.
| Order | Surface |
|---|---|
| 1 | Plane surface |
| 2 | Dome or simple syncline (paraboloid) |
| 3 | Folded surface (anticline and syncline) |
Maximum triangle area in result
Enter the maximum triangle area. The specified value refers to the maximum allowable area for a given triangle in the resulting triangulation.
Specifying a small triangle area will result in a smooth-surfaced triangulation, i.e. the sharp edges of the underlying triangulation will be removed.
Return only trend model values as result
Select this check box to produce the trend surface, without the raw data, as the triangulation. We recommend using this option to view/model the trend of the data.
Use bounding constraint points
Select this check box to control the trending. When trend surfaces are normally built, the trend outside the area of the data (surface strings, points etc.) will generally oscillate wildly and head off to infinity. This uncontrolled trending is usually fine as it is away from the area of interest, i.e. inside the data. However, sometimes it produces bad results at the very edges of the data, which can corrupt the original data. Enabling the Use bounding constraint points check box will prevent this from happening.
Apply ellipsoidal trending
Select this check box to apply local variations to the surface by direction. You will need to specify the ellipsoid parameters (that is bearing, plunge, dip, major radius, semi-major radius and minor radius).
Spurs tab
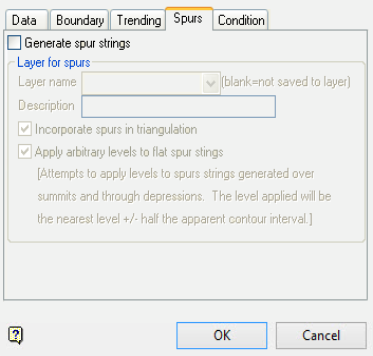
Generate spur strings
Select this check box to generate simple spur strings between contour lines. This forces the triangulation to triangulate between contour lines in places where it may triangulate between points on the same contour line.
If the contour data is modelled without generating and incorporating the spurs strings, then any volumetrics done with the resulting topography will be inaccurate. Since contour data is only an interpolation from the original data, you won't be able to recreate the original contours from the models unless spur strings are used.
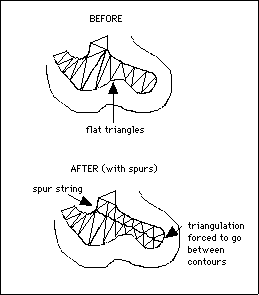
Figure 6: Spur strings
Layer for spurs
Layer name
Select the layer that will be used to store the generated spur strings.
To create a new layer, enter the layer name. The layer name:
- may contain up to 40 characters.
- must begin with an alphanumeric character [0-9] or [a-z].
- cannot include spaces.
- can include hyphens [ - ], plus signs [ + ], underscores [ _ ], periods/dots [. ].
- can include the special characters of ÁÂÃÀÇÉÊÍÓÔÕÚÜÑ that are used in the Spanish and Portuguese languages.
Leave this field blank if you do not want to save the generated spur strings.
Description
Enter a description to further describe the contents of this layer. The description can be up to 80 alphanumeric characters and may include spaces. If a description is not entered, then a default description will be used instead. If the chosen layer already has an assigned description, the description displays when the layer is selected. Existing layer descriptions can be overwritten.
Incorporate spurs in triangulation
Select this check box to incorporate the generated spurs into the triangulation.
Apply arbitrary levels to flat spur strings
Select this check box if you want Vulcan to apply a value to the centre point of the spurs generated across a flat area that is totally enclosed by a contour (for example a summit). As you can see from the note on the panel, Vulcan attempts to assess the contour interval from the data and then applies +/- 0.5× this assessed interval to the centre point of the spur strings. If the data being triangulated are not contours and/or the strings don't have the same Z values at all points (like a contour does) the effect of this option is not always predictable. This option can therefore be turned off (unticked) and spot heights will then have to be used to remove the flat areas.
This option does not apply arbitrary heights to a flat area surrounded by another contour of the same level: it is unable to determine whether the arbitrary value should be positive or negative.
Condition tab
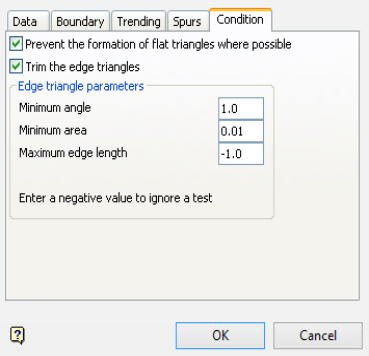
Prevent the formation of flat triangles where possible
Select this check box to prevent the formation of flat triangles, i.e. triangles with all the vertices on the one contour. Enabling this option will cause the system to always form a 'less than perfect' triangle when faced with the scenario of joining points in one direction that would be flat.
Note: The formation of flat triangles cannot always be prevented in cases such as saddle points, dog leg spurs or gullies.
Trim edge triangles
Select this check box to restrict the size of triangles around the edge of a triangulation. You will need to specify the minimum angle, minimum area and maximum edge length.
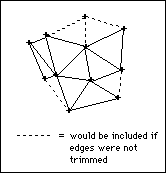
Figure 7: Trim edge triangles
Click OK.
If you selected the Triangulate data projected against a plane option, then the Triangulation plane panel displays.
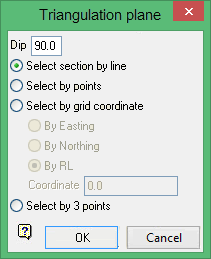
Dip
The dip is the angle of the section from horizontal. Valid dip angles are between -90° and 90°.
Select section by line
Select this option to define the plane by selecting an existing line and specifying the dip.
Only design strings may be picked and it is not possible to pick a line in an underlay. The direction of the view, and therefore the direction of the stepping, depends on the digitised sequence of the line. The digitised sequence of the line can be reversed using the Reverse option (under the Design > Object Edit submenu).
Select by points
Select this option to define the plane by digitising two points and specifying the dip.
To locate a point precisely, use the Snap to Objects or S nap to Points modes (on the Digitise toolbar). Points may be snapped onto underlays, such as block model slices or triangulations. If you use Indicate mode to select the points, then the points have the current default Z value.
Select by grid coordinate
Select this option to define the plane by using a specific grid coordinate. The grid co-ordinates can contain up to three decimal places. To achieve the best results for the following three methods, we recommend using the Zoom Data Extents button on the Graphics toolbar in order to view all of the graphics.
- By Easting - Select this option to enter a specific Easting value (X value).
- By Northing - Select this option to enter a specific Northing value (Y value).
- By RL - Select this option to enter a specific RL value (Z value).
Select by 3 points
Select this option to define the plane by digitising 3 points. To locate a point precisely, use the Snap to Objects or Snap to Points modes (on the Digitise toolbar). Points may be snapped onto underlays, such as block model slices or triangulations.
Using this option will allow you to explicitly define the location and orientation of a plane by indicating 3 points. The first two points define the bearing of the plane, and the third point defines the dip of the plane.
Click OK.
If you selected the Use boundary polygon option, then you will be asked to select a boundary polygon.
The Multiple Selection box is then displayed. From this box, choose your method of selecting the data to be triangulated and select the data.
You will then be asked to confirm the triangulation process. Don't Triangulate cancels the object selection (i.e. no triangulation will be created).
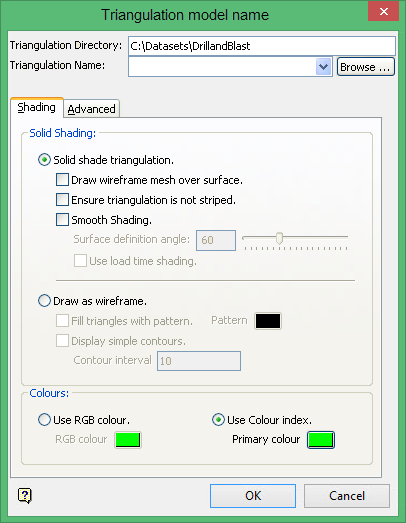
Select Triangulate to triangulate the selected objects. The triangle statistics (i.e. total triangles and points created) displays through the Report Window. The Triangulation model name panel will also be displayed.
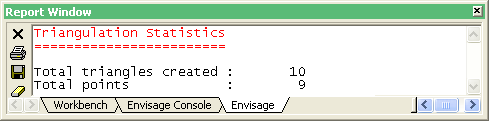
Figure 8: Report Window Output
The resulting triangulation is then displayed onscreen. Display attributes (line colour, pattern) of loaded triangulations can be changed through using the Attributes option (under the Model > Triangle Utility submenu) or the Triangulation Properties button ![]() on the Status toolbar.
on the Status toolbar.

