Geographic
Displaying a Latitude/Longitude grid
Use the Geographic option to display a latitude/longitude grid on the screen. The UTM (Universal Transverse Mercator) coordinate systems supported are:
-
Australian Map grid (AMG)
-
Integrated survey grid (ISG)
-
Map Grid of Australia (MGA)
All three are grid coordinates used in Australia. The program needs to know the zone, and the coordinate system of the current window. It can then calculate the latitude and longitude using Redfearns Formulae
The grid consists of line and text objects that are stored in a temporary layer (named dig$ge.grd ). Standard grids are stored in an underlay. As this layer is temporary, it is deleted when Vulcan is exited. Thus to maintain the layer, rename and save it.
Instructions
On the Analyse menu, point to Grid, and then click Geographic to display the Enter UTM zone panel.
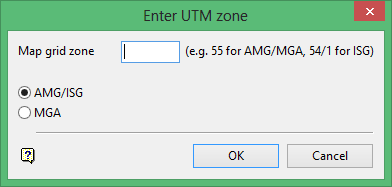
Map grid zone
Enter the UTM zone. For AMG/MGA grids the zone is entered as an integer (between 49 and 56). For ISG, the zone is in two parts, separated by a forward slash. The first part is an integer as per AMG, the second part is 1, 2 or 3. For New South Wales, valid values are 54/2 to 56/2.
AMG/ISG
Select this option if the coordinate system of the current window is AMG or ISG. You can use the View > Windows > Edit option to determine the current coordinate system.
MGA
Select this option if the coordinate system of the current window is MGA.
Click OK.
Indicate the grid boundary by digitising the lower left and upper right corners.
The following panel displays.
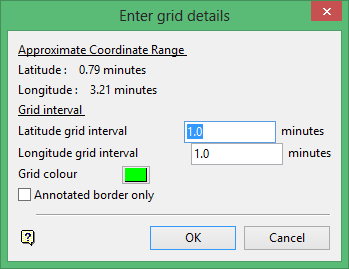
Approximate Coordinate Range
This shows the approximate range of the grid boundary nominated in the previous step (when indicating the geographic grid boundary). It assists you with specifying a useful grid interval (see below).
Grid Interval
Enter, in minuted of arc, the grid interval for the latitude and longitude.
Grid colour
Select the colour for the grid.
Annotated border only
Check this box if you only want border annotations. Check marks are placed along the border a the grid intervals instead of grid line. If the check box is not enable, both border annotations and grid lines are displayed.
Click OK.
The annotation are then displayed. The text and font size for the annotations are set through the Defaults : 2D Text section of the Tools > Preferences option.

